The Best-Paying American Cities for Carpenters in 2021
The residential real estate market has been booming during the COVID-19 pandemic, with more buyers looking for homes and competing for unusually low levels of inventory. With new supply desperately needed, the market currently presents enormous opportunities for builders and developers who are able to provide new stock.
However, the supply of both materials and labor have presented ongoing challenges for construction companies. With global supply chains breaking down and many industries currently facing labor shortages, the availability of critical resources has been highly volatile. To secure the people and materials needed to complete projects, firms have been forced into paying more for a variety of inputs.
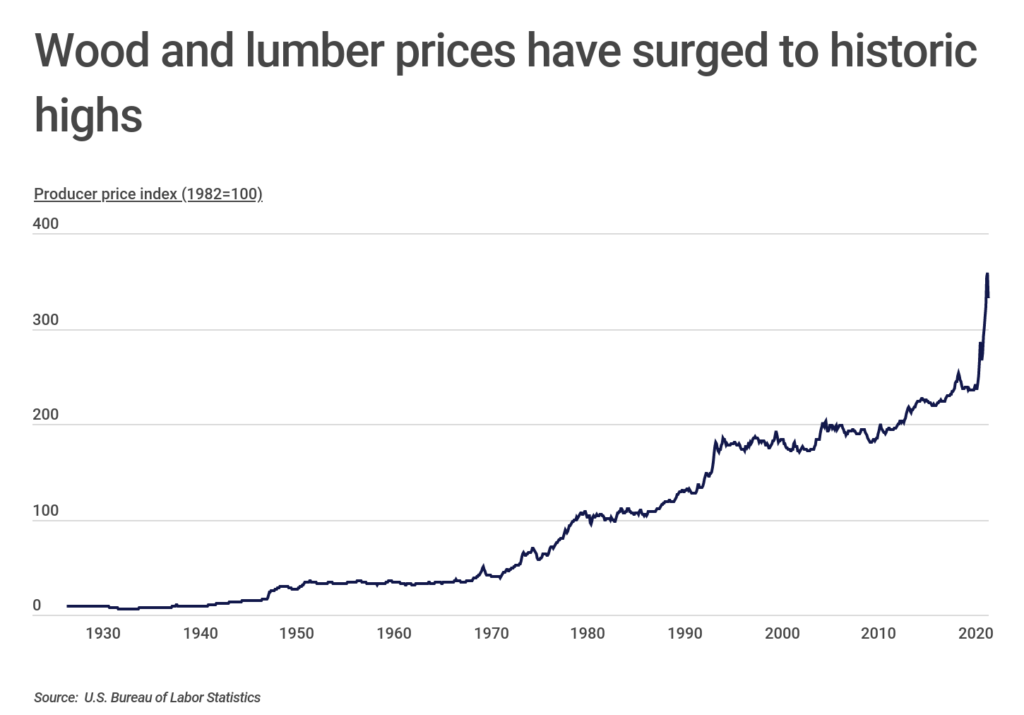
For builders, one of the most consequential supply chain breakdowns has been for lumber. Because there is more limited supply, prices have spiked dramatically. In June 2021, the price of lumber was nearly 50% higher than it was at the start of the pandemic in March 2020. Prices fell somewhat in July 2021, but remain at historic highs and well above pre-pandemic levels.
The availability of labor has also been hard to predict, and carpenters are one of the construction jobs where shortages have been most acute. In October 2020, more than 70% of builders reported some or a serious shortage of labor for carpenters. And the good news for carpenters is that many employers are responding by raising wages to attract and retain workers.
Carpenters already make good wages compared to other professions with similar educational requirements. The median annual wage for carpenters is $49,520, which exceeds the median not only for other construction trades ($47,480) but also for all occupations ($41,950). With employers feeling the pressure to raise wages and keep up with demand for construction, the occupations’ position could improve even further.
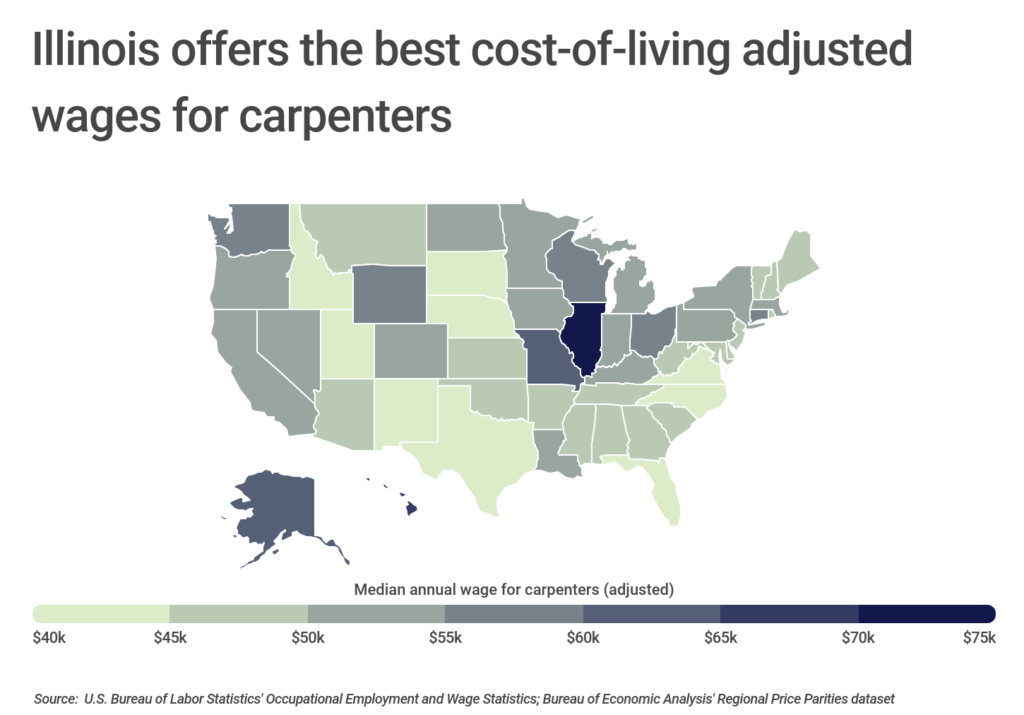
Like with other professions, some locations pay better than others for carpenters’ services, and one state clearly stands above the rest. Illinois offers carpenters a cost-of-living adjusted median annual wage of $75,144—nearly $10,000 higher than the next state, 50% higher than the national median, and the only state with an adjusted wage above $70,000. Illinois’ place at the top of the list is attributable to relatively high unionization and strong prevailing wage laws. Other top states include Hawaii, which has the nation’s highest rate of union membership, and Missouri, whose carpenters may benefit from the opportunity to take on jobs in neighboring Illinois.
FOR CARPENTERS
Construction takeoff is the process of counting and measuring the materials and labor required for a construction project. See our construction takeoff guide for more information.
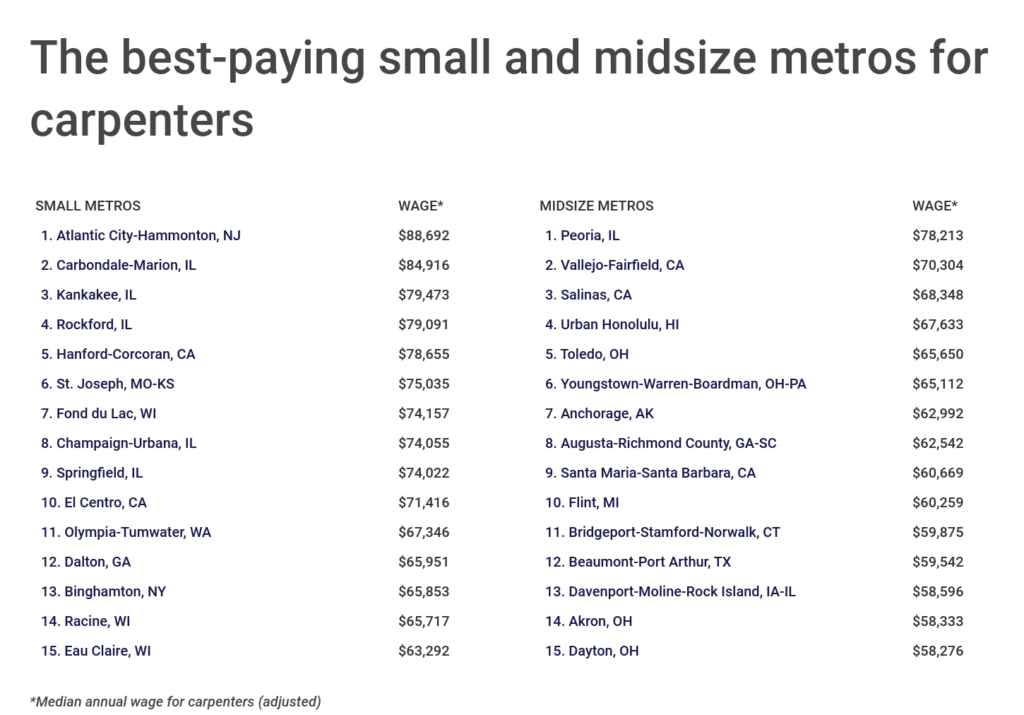
Unsurprisingly, at the metro level, Illinois-based locations are also among the best-paying for carpenters. Many of the top-paying small and midsize metropolitan areas for carpenters are in Illinois, as are the two top-paying large metros: Chicago and St. Louis, whose metro area spans the Missouri-Illinois border.
The data used in this analysis is from the U.S. Bureau of Labor Statistics Occupational Employment and Wage Statistics and the U.S. Bureau of Economic Analysis Regional Price Parities dataset. To determine the best-paying locations for carpenters, researchers at Construction Coverage calculated the median annual earnings for carpenters, adjusted for cost-of-living differences.
Here are the best-paying metros for carpenters.
The Best-Paying Large Metros for Carpenters

Photo Credit: Bob Pool / Shutterstock
15. Portland-Vancouver-Hillsboro, OR-WA
- Median annual wage for carpenters (adjusted): $54,886
- Median annual wage for carpenters (actual): $57,630
- Median annual wage for all workers (actual): $48,050
- Relative concentration of carpenters (compared to average): +88.0%
- Relative cost of living (compared to average): +5.0%
- Population: 2,510,259

Photo Credit: Sean Pavone / Shutterstock
14. Los Angeles-Long Beach-Anaheim, CA
- Median annual wage for carpenters (adjusted): $55,244
- Median annual wage for carpenters (actual): $65,630
- Median annual wage for all workers (actual): $45,550
- Relative concentration of carpenters (compared to average): -10.0%
- Relative cost of living (compared to average): +18.8%
- Population: 13,109,903

Photo Credit: stellamc / Shutterstock
13. Fresno, CA
- Median annual wage for carpenters (adjusted): $55,508
- Median annual wage for carpenters (actual): $54,120
- Median annual wage for all workers (actual): $37,050
- Relative concentration of carpenters (compared to average): +7.0%
- Relative cost of living (compared to average): -2.5%
- Population: 1,000,918

Photo Credit: Sean Pavone / Shutterstock
12. Philadelphia-Camden-Wilmington, PA-NJ-DE-MD
- Median annual wage for carpenters (adjusted): $55,565
- Median annual wage for carpenters (actual): $58,510
- Median annual wage for all workers (actual): $46,500
- Relative concentration of carpenters (compared to average): -9.0%
- Relative cost of living (compared to average): +5.3%
- Population: 6,107,906

Photo Credit: Sean Pavone / Shutterstock
11. Detroit-Warren-Dearborn, MI
- Median annual wage for carpenters (adjusted): $56,076
- Median annual wage for carpenters (actual): $53,440
- Median annual wage for all workers (actual): $44,840
- Relative concentration of carpenters (compared to average): -23.0%
- Relative cost of living (compared to average): -4.7%
- Population: 4,304,136

Photo Credit: Virrage Images / Shutterstock
10. Las Vegas-Henderson-Paradise, NV
- Median annual wage for carpenters (adjusted): $56,574
- Median annual wage for carpenters (actual): $54,820
- Median annual wage for all workers (actual): $37,690
- Relative concentration of carpenters (compared to average): +96.0%
- Relative cost of living (compared to average): -3.1%
- Population: 2,315,963

Photo Credit: Checubus / Shutterstock
9. Seattle-Tacoma-Bellevue, WA
- Median annual wage for carpenters (adjusted): $56,576
- Median annual wage for carpenters (actual): $64,780
- Median annual wage for all workers (actual): $58,330
- Relative concentration of carpenters (compared to average): +54.0%
- Relative cost of living (compared to average): +14.5%
- Population: 4,018,598

Photo Credit: Checubus / Shutterstock
8. Minneapolis-St. Paul-Bloomington, MN-WI
- Median annual wage for carpenters (adjusted): $56,851
- Median annual wage for carpenters (actual): $58,500
- Median annual wage for all workers (actual): $49,700
- Relative concentration of carpenters (compared to average): +18.0%
- Relative cost of living (compared to average): +2.9%
- Population: 3,657,477

Photo Credit: Henryk Sadura / Shutterstock
7. Cleveland-Elyria, OH
- Median annual wage for carpenters (adjusted): $58,276
- Median annual wage for carpenters (actual): $52,390
- Median annual wage for all workers (actual): $42,740
- Relative concentration of carpenters (compared to average): -30.0%
- Relative cost of living (compared to average): -10.1%
- Population: 2,043,807

Photo Credit: f11photo / Shutterstock
6. Kansas City, MO-KS
- Median annual wage for carpenters (adjusted): $58,772
- Median annual wage for carpenters (actual): $54,540
- Median annual wage for all workers (actual): $43,200
- Relative concentration of carpenters (compared to average): -13.0%
- Relative cost of living (compared to average): -7.2%
- Population: 2,173,212

Photo Credit: f11photo / Shutterstock
5. Milwaukee-Waukesha-West Allis, WI
- Median annual wage for carpenters (adjusted): $58,953
- Median annual wage for carpenters (actual): $55,770
- Median annual wage for all workers (actual): $43,380
- Relative concentration of carpenters (compared to average): +10.0%
- Relative cost of living (compared to average): -5.4%
- Population: 1,577,676

Photo Credit: Jonny Trego / Shutterstock
4. Louisville/Jefferson County, KY-IN
- Median annual wage for carpenters (adjusted): $59,609
- Median annual wage for carpenters (actual): $53,410
- Median annual wage for all workers (actual): $39,330
- Relative concentration of carpenters (compared to average): -17.0%
- Relative cost of living (compared to average): -10.4%
- Population: 1,268,993

Photo Credit: Jason Sponseller / Shutterstock
3. Pittsburgh, PA
- Median annual wage for carpenters (adjusted): $66,883
- Median annual wage for carpenters (actual): $61,800
- Median annual wage for all workers (actual): $43,200
- Relative concentration of carpenters (compared to average): +16.0%
- Relative cost of living (compared to average): -7.6%
- Population: 2,309,246

Photo Credit: f11photo / Shutterstock
2. St. Louis, MO-IL
- Median annual wage for carpenters (adjusted): $71,199
- Median annual wage for carpenters (actual): $64,150
- Median annual wage for all workers (actual): $42,060
- Relative concentration of carpenters (compared to average): +39.0%
- Relative cost of living (compared to average): -9.9%
- Population: 2,805,473

Photo Credit: marchello74 / Shutterstock
1. Chicago-Naperville-Elgin, IL-IN-WI
- Median annual wage for carpenters (adjusted): $81,809
- Median annual wage for carpenters (actual): $84,100
- Median annual wage for all workers (actual): $45,420
- Relative concentration of carpenters (compared to average): -8.0%
- Relative cost of living (compared to average): +2.8%
- Population: 9,406,638
Detailed Findings & Methodology
The data used in this analysis is from the U.S. Bureau of Labor Statistics Occupational Employment and Wage Statistics and the U.S. Bureau of Economic Analysis Regional Price Parities dataset. To determine the best-paying locations for carpenters, researchers calculated the median annual earnings for carpenters, adjusted for cost-of-living differences. To improve relevance, only metropolitan areas with at least 100,000 residents were included. Additionally, metros were grouped into cohorts based on population size: small (100,000-349,999), midsize (350,000-999,999), and large (1,000,000 or more).
Each company featured in our guides has been independently selected and reviewed by our research team. If you select one of these companies and click on a link, we may earn a commission.
By clicking on these links, you may be taken to one of our insurance partners. The specific company listed here may or may not be included in our partner’s network at this time.