U.S. Cities With the Worst Pest Problem in 2021
No household wants to face a pest problem, but over 14 million U.S. households encounter rodents, roaches, or other pests each year, according to the Census Bureau. These pests can trigger a variety of health concerns including asthma and may bring disease into the home. Once they establish themselves, pests can also damage the home itself and property inside.
Among the most common household pests are rodents and cockroaches, although termites also present a major threat in certain parts of the country. Seeking food and shelter, pests can creep into homes in a variety of ways, many of them related to the condition of the house. Problems like cracks or holes in a home’s walls, foundation, windows, or roof can provide openings into the home, while leaking water or sewer pipes provide the moist conditions that most pests prefer.
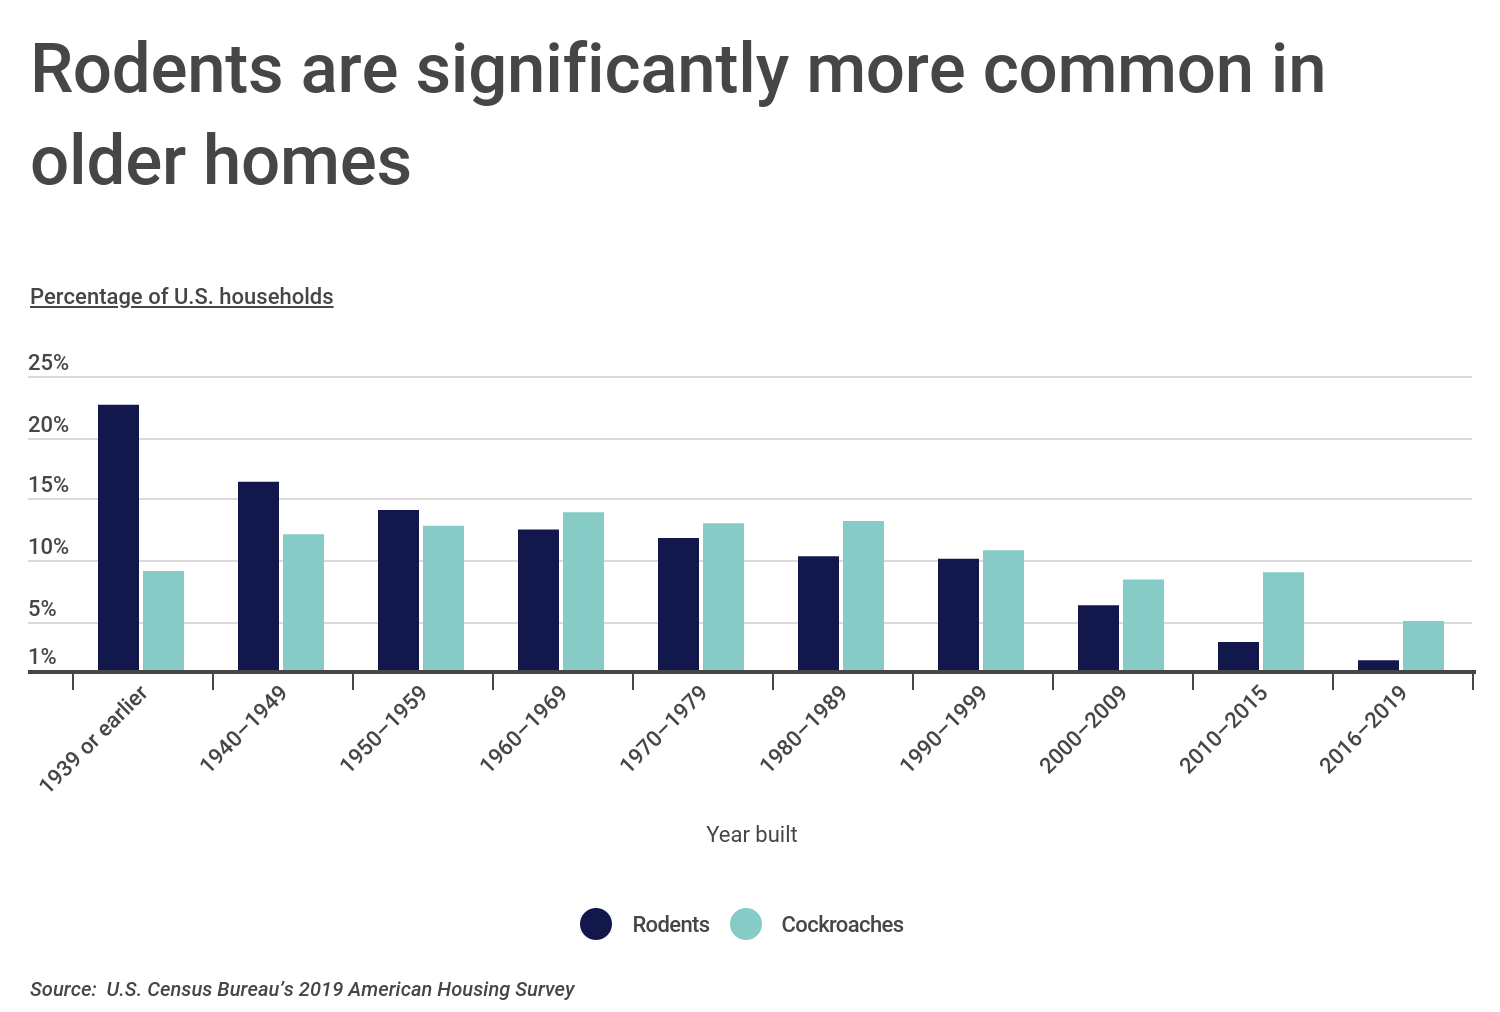
Given how pests establish themselves in homes, it is little surprise that pests—particularly rodents—tend to be seen more commonly in older units that have naturally deteriorated over time. More than one in five homes (22.7%) built before 1939 had a rodent sighting in the past 12 months, compared to just 1.8% of homes built since 2016. The data on home age and cockroach sightings is more complicated: cockroach sightings are most common in households built from the 1950s through the 1980s and less common before and after. This is likely in part because most of the oldest homes in the U.S. are found in areas where cockroaches are less common, while newer homes show less of the deterioration that allows roaches to enter the home.
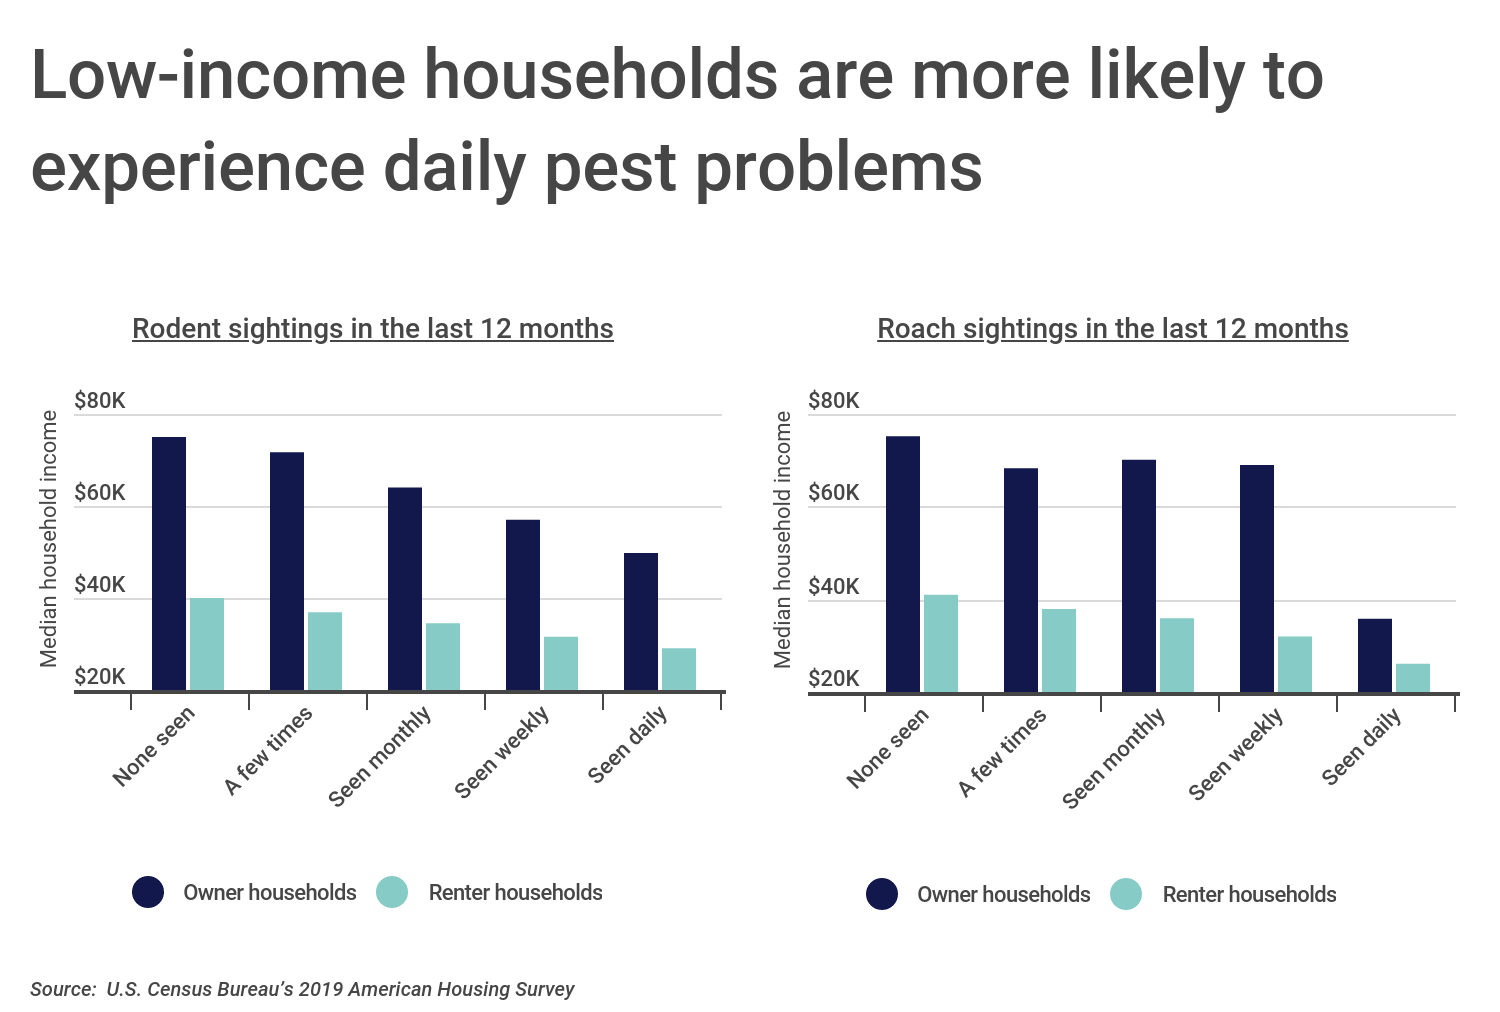
For related reasons, a household’s income levels also bear a relationship to how frequently the home’s residents encounter pests. Among both owners and renters, the median income for households who had not seen a rodent or roach in the last 12 months was far higher than the median income for households who saw such pests daily. This is likely because households with greater means can afford to live in newer units or units that have been better maintained and keep up with the costs of ongoing maintenance and other preventive measures.
In addition to the age and condition of a home, where the home is located also impacts the type and frequency of pest issues. Rodents are usually more common in colder regions like the Northeast, where they seek out warm locations for shelter during the fall and winter months. Insects like cockroaches and ants thrive in warmer climates like those found in the South. And both roaches and rodents prefer more damp or humid climates, which make them less common in the dryer West. Taken together, these location-specific factors have a major impact on how likely a home is to face a pest problem.
To determine the locations with the worst pest problem, researchers at Construction Coverage calculated a composite index equally weighing the percentage of households with rodents and percentage of households with cockroaches for each location. The data used in this analysis is from the U.S. Census Bureau’s American Housing Survey. In the event of a tie, the location with the higher percentage of households with rodents was ranked higher. Only select metropolitan areas and states with data available from the American Housing Survey were considered in the analysis.
Here are the major metropolitan areas with the worst pest problem.
Major U.S. Metros With the Worst Pest Problem

Photo Credit: evenfh / Shutterstock
10. New Orleans-Metairie, LA
- Composite index: 58.3
- Percentage of households with rodents: 5.8%
- Percentage of households with cockroaches: 29.8%
- Percentage of homes built before 1940: 13.0%
- Median household income: $48,600
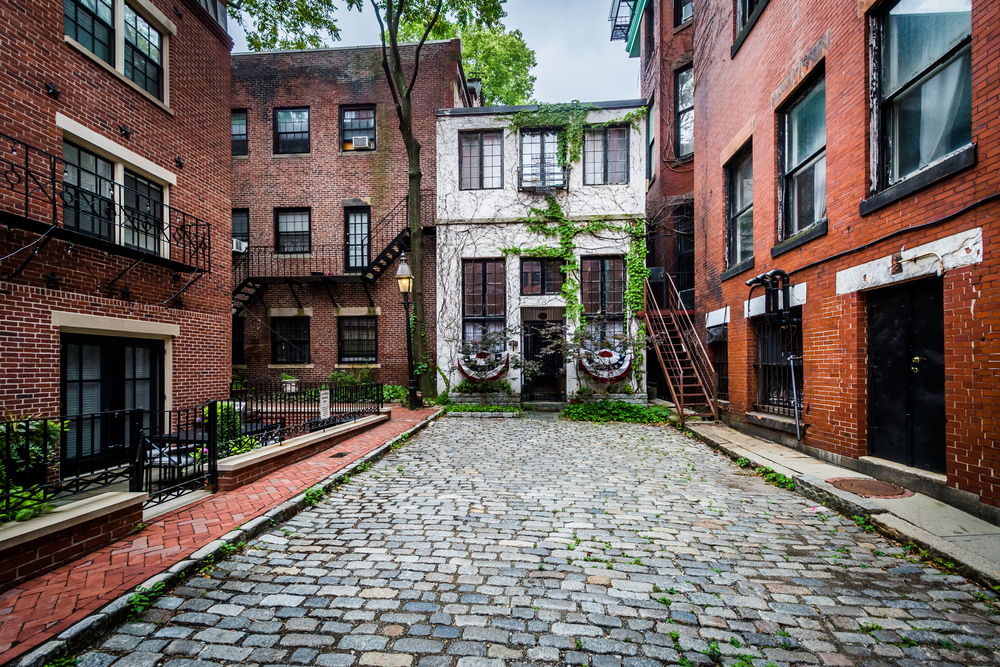
Photo Credit: Jon Bilous / Shutterstock
9. Boston-Cambridge-Newton, MA-NH
- Composite index: 60.4
- Percentage of households with rodents: 18.4%
- Percentage of households with cockroaches: 2.9%
- Percentage of homes built before 1940: 32.6%
- Median household income: $87,000

Photo Credit: wonderlustpicstravel / Shutterstock
8. Chicago-Naperville-Elgin, IL-IN-WI
- Composite index: 62.5
- Percentage of households with rodents: 13.3%
- Percentage of households with cockroaches: 4.5%
- Percentage of homes built before 1940: 20.7%
- Median household income: $72,000
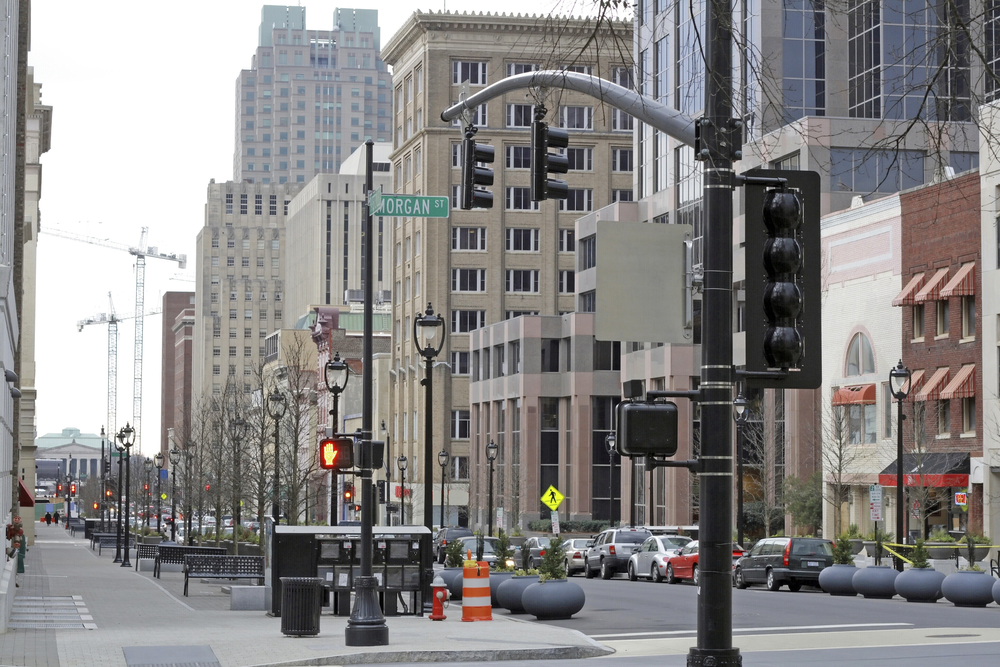
Photo Credit: Kirill Livshitskiy / Shutterstock
7. Raleigh, NC
- Composite index: 64.6
- Percentage of households with rodents: 8.9%
- Percentage of households with cockroaches: 24.1%
- Percentage of homes built before 1940: 2.9%
- Median household income: $75,000

Photo Credit: iampaese / Shutterstock
6. Kansas City, MO-KS MSA
- Composite index: 64.6
- Percentage of households with rodents: 12.2%
- Percentage of households with cockroaches: 6.4%
- Percentage of homes built before 1940: 12.2%
- Median household income: $67,000

Photo Credit: Victor Moussa / Shutterstock
5. New York-Newark-Jersey City, NY-NJ-PA
- Composite index: 66.7
- Percentage of households with rodents: 11.2%
- Percentage of households with cockroaches: 11.1%
- Percentage of homes built before 1940: 27.7%
- Median household income: $70,000
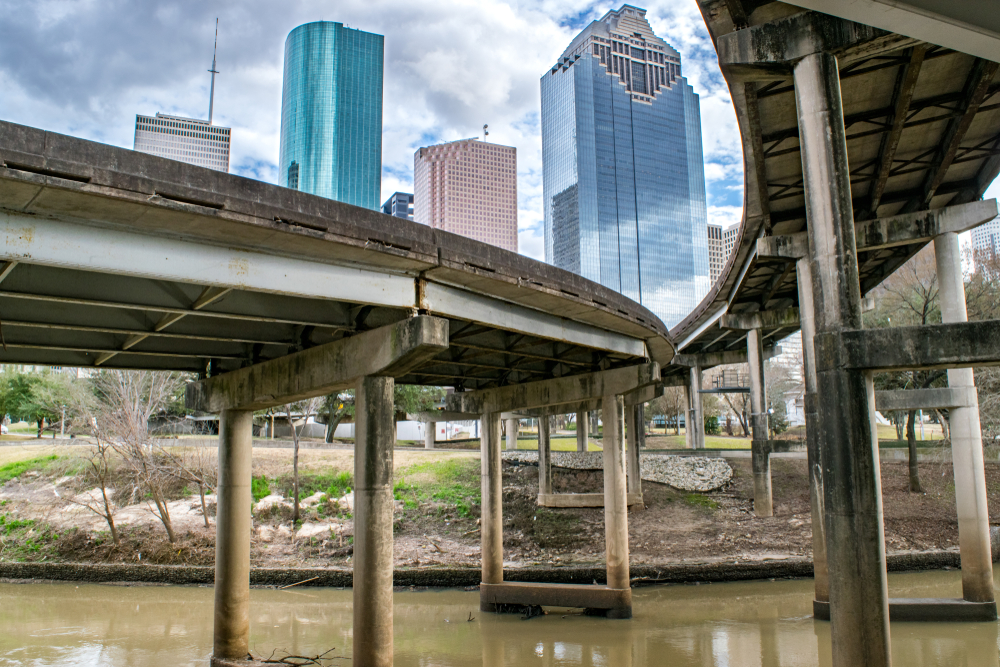
Photo Credit: Nate Hovee / Shutterstock
4. Houston-The Woodlands-Sugar Land, TX
- Composite index: 68.8
- Percentage of households with rodents: 6.8%
- Percentage of households with cockroaches: 35.2%
- Percentage of homes built before 1940: 2.4%
- Median household income: $60,000

Photo Credit: Sean Pavone / Shutterstock
3. Memphis, TN-MS-AR
- Composite index: 68.8
- Percentage of households with rodents: 11.1%
- Percentage of households with cockroaches: 18.6%
- Percentage of homes built before 1940: 4.9%
- Median household income: $45,000

Photo Credit: photosounds / Shutterstock
2. Philadelphia-Camden-Wilmington, PA-NJ-DE-MD
- Composite index: 72.9
- Percentage of households with rodents: 18.9%
- Percentage of households with cockroaches: 6.1%
- Percentage of homes built before 1940: 22.6%
- Median household income: $71,570

Photo Credit: A G Baxter / Shutterstock
1. Washington-Arlington-Alexandria, DC-VA-MD-WV
- Composite index: 75.0
- Percentage of households with rodents: 15.1%
- Percentage of households with cockroaches: 8.6%
- Percentage of homes built before 1940: 8.1%
- Median household income: $100,000
Detailed Findings & Methodology
The data used in this analysis is from the U.S. Census Bureau’s American Housing Survey for the year 2019, the most recent data available. To determine the locations with the worst pest problem, researchers calculated a composite index equally weighing the percentage of households with rodents and percentage of households with cockroaches for each location. In the event of a tie, the location with the higher percentage of households with rodents was ranked higher. Only select metropolitan areas and states with data available from the American Housing Survey were considered in the analysis.
Each company featured in our guides has been independently selected and reviewed by our research team. If you select one of these companies and click on a link, we may earn a commission.
By clicking on these links, you may be taken to one of our insurance partners. The specific company listed here may or may not be included in our partner’s network at this time.