Cities With the Most Mortgage Delinquencies
Note: This is the most recent release of our Cities With the Most Mortgage Delinquencies study. To see data from previous years, please visit the Full Results section below.
Following record-breaking unemployment numbers in the early stages of the COVID-19 pandemic, congress passed the CARES Act, which invoked a moratorium on home foreclosures and provided loan forbearance options for federally-backed mortgages. While the relief options offered through the CARES Act applied only to federally-backed mortgages—which comprise about 70% of the total—many private lenders offered similar protections.
These protections were critical not only for keeping Americans in their homes, but also because of the outsized importance of the housing market on the broader economy.
Composition of U.S. Household Debt
Mortgage loans account for more than 70% of total household debt
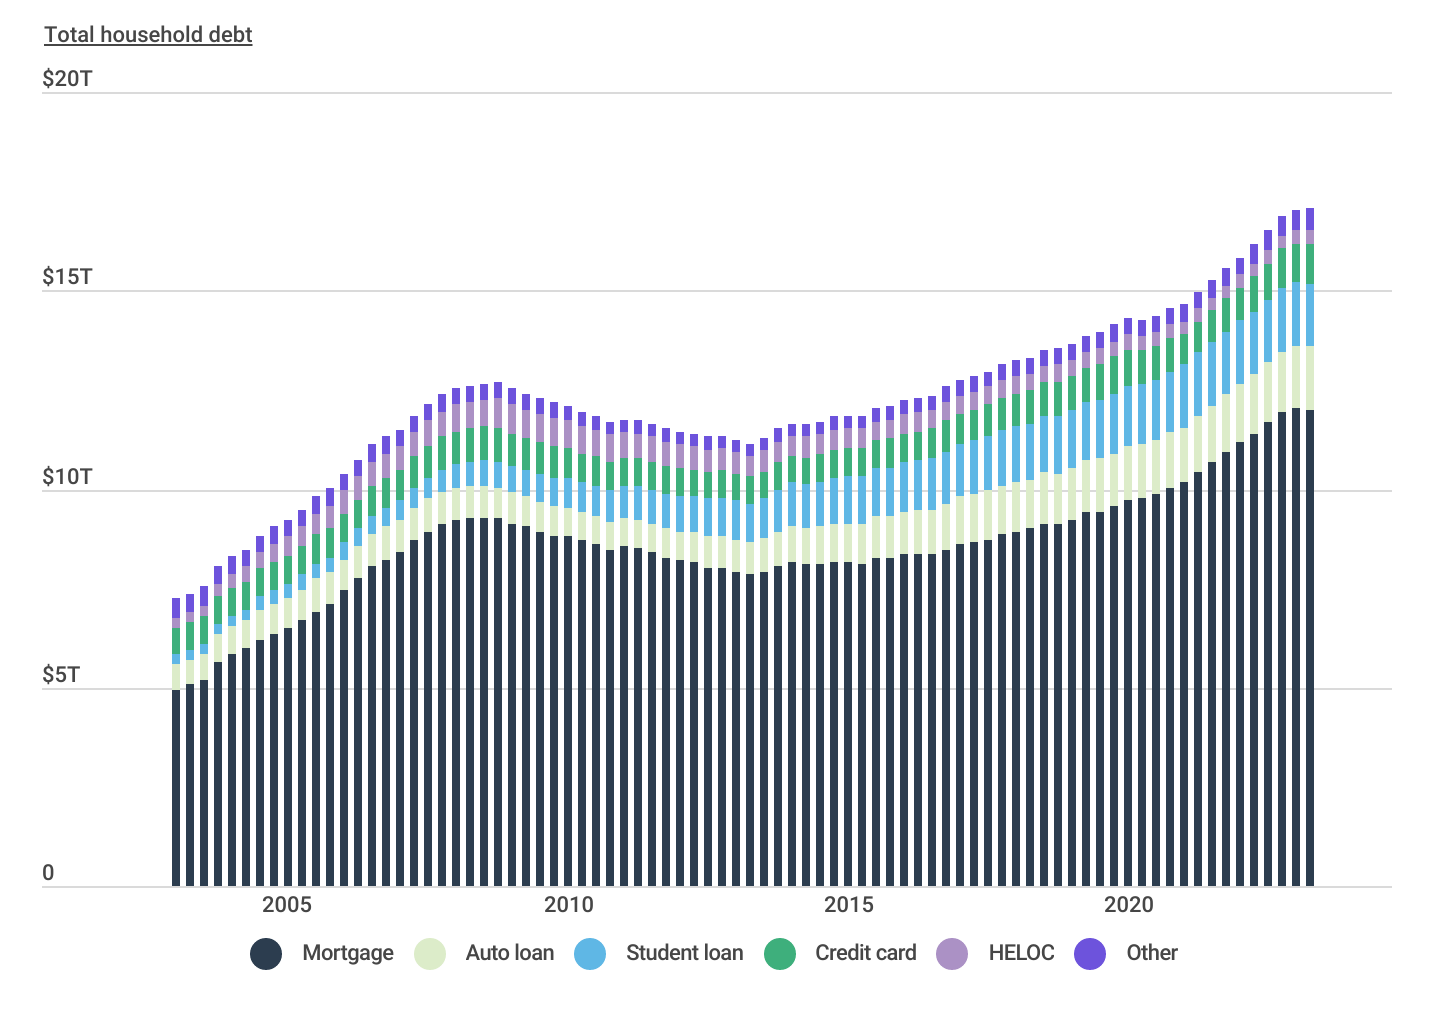
Nationally, total mortgage debt now stands at more than $12 trillion and accounts for more than 70% of the total debt held by U.S. households. Outstanding mortgage debt rose sharply over the past several years as below-average interest rates, elevated demand for housing, and a surge in residential construction pushed new mortgage originations to record levels.
Compared to mortgages, other consumer loan categories represent a much smaller proportion of total outstanding debt. Auto loans and student loans are the next largest loan types—each of which accounts for just over 9% of total debt or 18.5% combined. Credit card debt stands at approximately 6% while HELOC and other loan types comprise the remaining 5%.
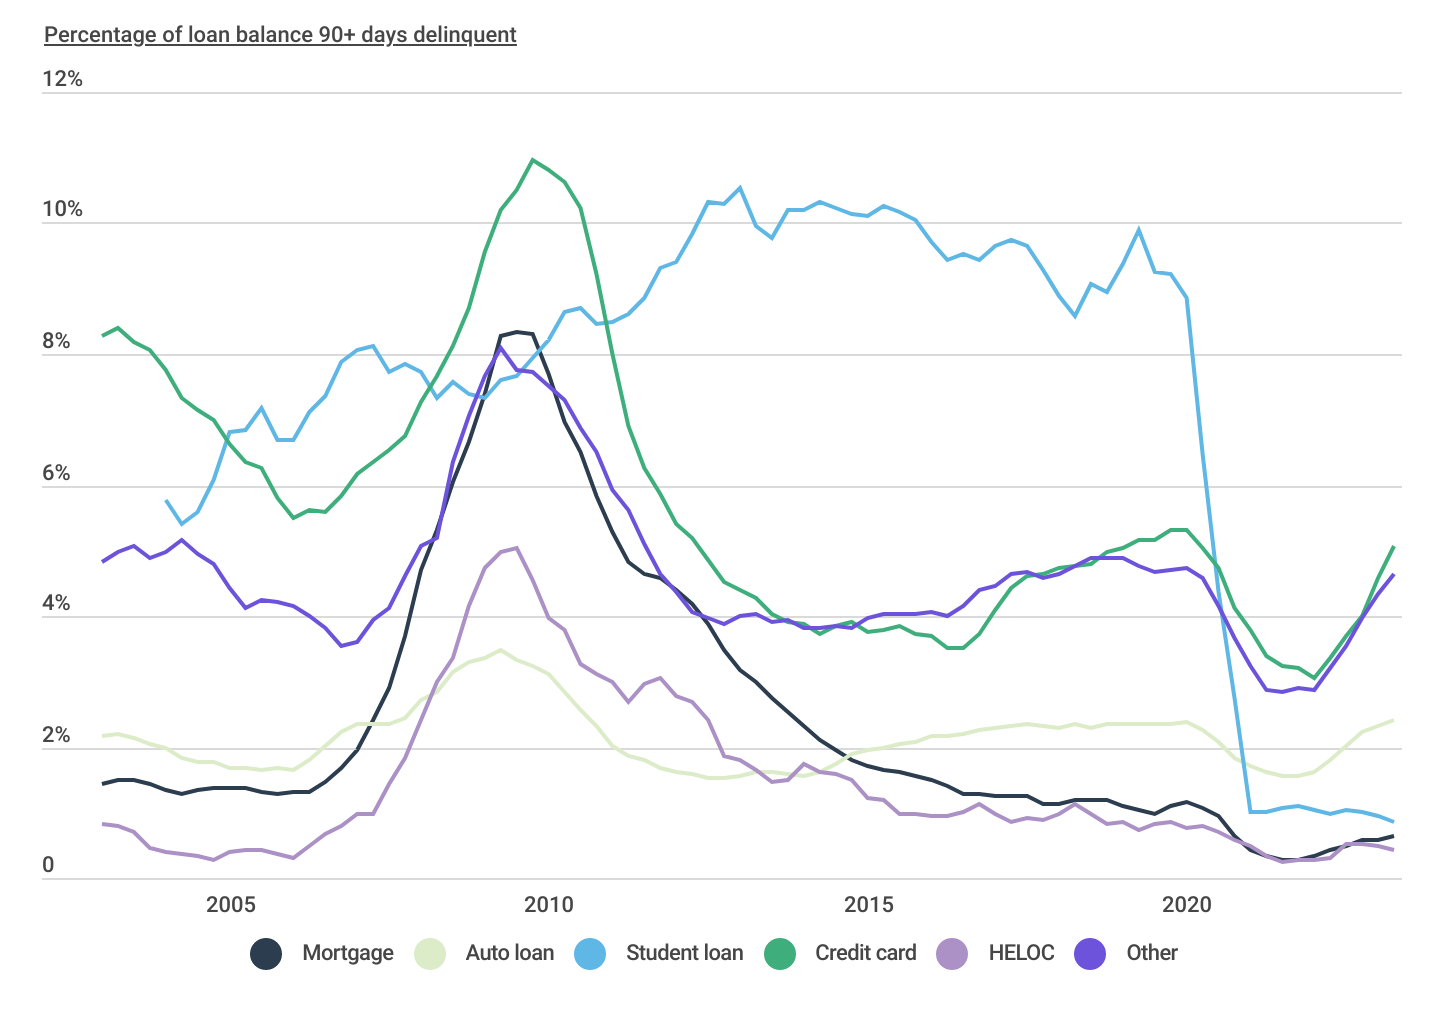
Serious (90+ Day) Delinquency Rates by Loan Type
Mortgage delinquencies remain at historically low levels
TRENDING ON CONSTRUCTION COVERAGE
Starting a new construction project? Read up on builders risk insurance and construction takeoff software.
Data from the New York Fed highlights how COVID-era financial assistance programs like loan forbearance, direct relief payments, and enhanced unemployment benefits worked to stave off loan delinquencies. Over the course of 2020 and 2021 when these programs were in effect, the percentage of loans in serious delinquency dropped to historically low levels across most major loan types. Serious mortgage delinquencies, for example, experienced a 75% drop from a pre-pandemic rate of 1.1% to a low of 0.27% in Q4 of 2021. Similar trends were observed for credit cards, auto loans, student loans, and HELOCs to varying degrees.
Unfortunately, a combination of rising interest rates and the end of most federal and state-level enhanced benefits programs has led to rising rates of missed payments, especially for credit card loans and auto loans. Fortunately, serious delinquencies for mortgage loans have remained very low even since these programs ended, which is likely the result of a strong job market and the fact that despite rising interest rates for new mortgages, most homeowners who bought or refinanced before 2022 were able to lock in low rates.
Geographic Differences in Mortgage Delinquencies
The South & East Coast have the highest rates of delinquent mortgages
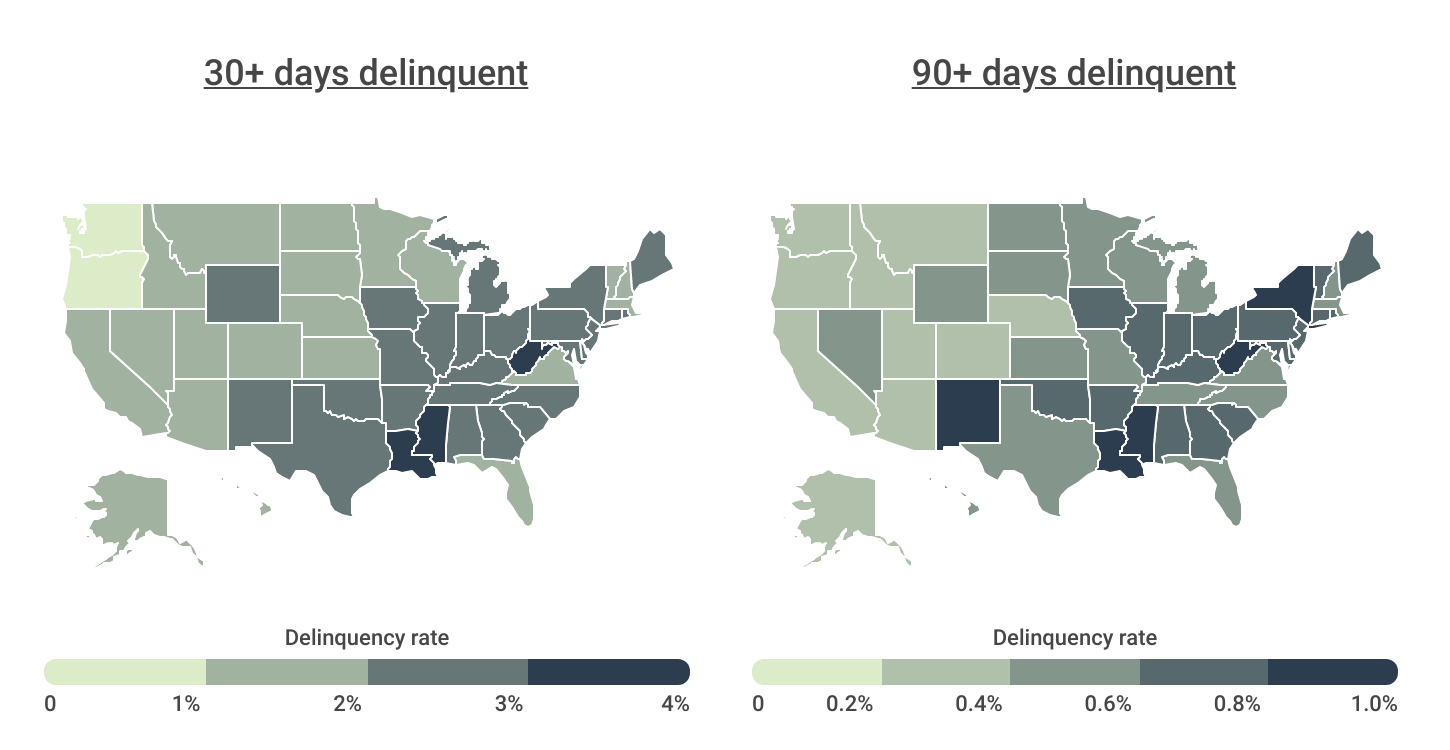
While mortgage delinquency rates remain low nationally, the concentration of delinquent mortgages varies significantly by location. In general, delinquency rates tend to be highest in areas with higher levels of unemployment and poverty, lower levels of income, and lower property values.
Regionally, states in the South and pockets of the East Coast tend to have the highest delinquency rates. For example, Mississippi, Louisiana, and West Virginia are the top three states for both 30-day and 90-day mortgage delinquencies. Other states with high rates of missed payments include Alabama and Arkansas. At the opposite end of the spectrum, Oregon, Washington, and California report the lowest rates of delinquent mortgages.
Similar trends hold at the local level with major metropolitan areas in the South—like New Orleans, San Antonio, and Memphis—reporting high rates. Residents in West Coast metros like San Jose, San Francisco, and San Diego, on the other hand, are far less likely to miss a mortgage payment.
Below is a complete breakdown of delinquency rates across more than 250 metropolitan areas and all 50 states. The analysis was conducted by researchers at Construction Coverage using data from the Consumer Financial Protection Bureau, U.S. Census Bureau, and Zillow. For more information, refer to the methodology section.
Top & Bottom Large Metros for Mortgage Delinquencies
| Top Metros | Percentage* |
|---|---|
| 1. New Orleans-Metairie, LA | 3.0% |
| 2. San Antonio-New Braunfels, TX | 2.9% |
| 3. Memphis, TN-MS-AR | 2.8% |
| 4. Houston-The Woodlands-Sugar Land, TX | 2.7% |
| 5. Birmingham-Hoover, AL | 2.7% |
| 6. Tulsa, OK | 2.5% |
| 7. Philadelphia-Camden-Wilmington, PA-NJ-DE-MD | 2.5% |
| 8. Rochester, NY | 2.5% |
| 9. Buffalo-Cheektowaga-Niagara Falls, NY | 2.4% |
| 10. Cleveland-Elyria, OH | 2.3% |
| 11. Louisville/Jefferson County, KY-IN | 2.3% |
| 12. Pittsburgh, PA | 2.3% |
| 13. Hartford-West Hartford-East Hartford, CT | 2.2% |
| 14. Atlanta-Sandy Springs-Roswell, GA | 2.2% |
| 15. Baltimore-Columbia-Towson, MD | 2.2% |
| Bottom Metros | Percentage* |
|---|---|
| 1. San Jose-Sunnyvale-Santa Clara, CA | 0.4% |
| 2. San Francisco-Oakland-Hayward, CA | 0.6% |
| 3. San Diego-Carlsbad, CA | 0.7% |
| 4. Seattle-Tacoma-Bellevue, WA | 0.8% |
| 5. Portland-Vancouver-Hillsboro, OR-WA | 0.8% |
| 6. Sacramento–Roseville–Arden-Arcade, CA | 0.9% |
| 7. Los Angeles-Long Beach-Anaheim, CA | 0.9% |
| 8. Denver-Aurora-Lakewood, CO | 1.0% |
| 9. Austin-Round Rock, TX | 1.1% |
| 10. Salt Lake City, UT | 1.2% |
| 11. Milwaukee-Waukesha-West Allis, WI | 1.2% |
| 12. Minneapolis-St. Paul-Bloomington, MN-WI | 1.2% |
| 13. Boston-Cambridge-Newton, MA-NH | 1.2% |
| 14. Orlando-Kissimmee-Sanford, FL | 1.2% |
| 15. Raleigh, NC | 1.3% |
TRENDING ON CONSTRUCTION COVERAGE
Landlord insurance can provide major savings when something goes wrong with your rental. And because you want to minimize your costs when shopping for insurance, here’s everything you need to know about landlord insurance, including expert reviews of the best landlord insurance companies.
Top & Bottom Midsize Metros for Mortgage Delinquencies
| Top Metros | Percentage* |
|---|---|
| 1. McAllen-Edinburg-Mission, TX | 4.4% |
| 2. Huntington-Ashland, WV-KY-OH | 4.2% |
| 3. Baton Rouge, LA | 4.0% |
| 4. Jackson, MS | 3.9% |
| 5. Mobile, AL | 3.9% |
| 6. Lafayette, LA | 3.8% |
| 7. Corpus Christi, TX | 3.8% |
| 8. Shreveport-Bossier City, LA | 3.7% |
| 9. Gulfport-Biloxi-Pascagoula, MS | 3.7% |
| 10. Beaumont-Port Arthur, TX | 3.7% |
| 11. Brownsville-Harlingen, TX | 3.4% |
| 12. El Paso, TX | 3.2% |
| 13. Toledo, OH | 3.1% |
| 14. Columbia, SC | 3.0% |
| 15. Fayetteville, NC | 2.8% |
| Bottom Metros | Percentage* |
|---|---|
| 1. Santa Rosa, CA | 0.7% |
| 2. North Port-Sarasota-Bradenton, FL | 0.8% |
| 3. Fort Collins, CO | 0.8% |
| 4. Oxnard-Thousand Oaks-Ventura, CA | 0.8% |
| 5. Naples-Immokalee-Marco Island, FL | 0.8% |
| 6. Salinas, CA | 0.8% |
| 7. Palm Bay-Melbourne-Titusville, FL | 0.9% |
| 8. Santa Maria-Santa Barbara, CA | 0.9% |
| 9. Madison, WI | 0.9% |
| 10. Vallejo-Fairfield, CA | 1.0% |
| 11. Eugene, OR | 1.0% |
| 12. Ann Arbor, MI | 1.1% |
| 13. Salem, OR | 1.1% |
| 14. Boise City, ID | 1.1% |
| 15. Provo-Orem, UT | 1.1% |
Top & Bottom Small Metros for Mortgage Delinquencies
| Top Metros | Percentage* |
|---|---|
| 1. Laredo, TX | 5.9% |
| 2. Lake Charles, LA | 4.6% |
| 3. Charleston, WV | 4.3% |
| 4. Dover, DE | 4.1% |
| 5. East Stroudsburg, PA | 3.9% |
| 6. Florence, SC | 3.8% |
| 7. Muskegon, MI | 3.6% |
| 8. Elkhart-Goshen, IN | 3.3% |
| 9. Yuma, AZ | 3.3% |
| 10. Longview, TX | 3.3% |
| 11. Pueblo, CO | 3.2% |
| 12. Burlington, NC | 3.1% |
| 13. Chambersburg-Waynesboro, PA | 3.0% |
| 14. Amarillo, TX | 3.0% |
| 15. Macon-Bibb County, GA | 2.9% |
| Bottom Metros | Percentage* |
|---|---|
| 1. Bend-Redmond, OR | 0.4% |
| 2. Boulder, CO | 0.4% |
| 3. Lincoln, NE | 0.5% |
| 4. Napa, CA | 0.6% |
| 5. Santa Cruz-Watsonville, CA | 0.7% |
| 6. Oshkosh-Neenah, WI | 0.7% |
| 7. Olympia-Tumwater, WA | 0.7% |
| 8. Kahului-Wailuku-Lahaina, HI | 0.7% |
| 9. Bremerton-Silverdale, WA | 0.8% |
| 10. Eau Claire, WI | 0.8% |
| 11. Santa Fe, NM | 0.8% |
| 12. Appleton, WI | 0.9% |
| 13. St. George, UT | 0.9% |
| 14. Punta Gorda, FL | 0.9% |
| 15. San Luis Obispo-Paso Robles-Arroyo Grande, CA | 0.9% |
Top & Bottom States for Mortgage Delinquencies
| Top States | Percentage* |
|---|---|
| 1. Mississippi | 4.0% |
| 2. Louisiana | 3.6% |
| 3. West Virginia | 3.4% |
| 4. Alabama | 2.7% |
| 5. Arkansas | 2.6% |
| 6. Indiana | 2.6% |
| 7. New Mexico | 2.5% |
| 8. Oklahoma | 2.5% |
| 9. Pennsylvania | 2.5% |
| 10. Texas | 2.5% |
| 11. Delaware | 2.3% |
| 12. Kentucky | 2.3% |
| 13. Georgia | 2.3% |
| 14. South Carolina | 2.3% |
| 15. Connecticut | 2.2% |
| Bottom States | Percentage* |
|---|---|
| 1. Washington | 0.9% |
| 2. Oregon | 0.9% |
| 3. California | 1.1% |
| 4. Nebraska | 1.2% |
| 5. Montana | 1.2% |
| 6. Colorado | 1.2% |
| 7. Wisconsin | 1.2% |
| 8. Hawaii | 1.2% |
| 9. Alaska | 1.3% |
| 10. Utah | 1.3% |
| 11. North Dakota | 1.3% |
| 12. Minnesota | 1.4% |
| 13. Idaho | 1.4% |
| 14. Arizona | 1.4% |
| 15. South Dakota | 1.5% |
*Percentage of mortgages 30+ days delinquent
Methodology
The data used in this study is from the Consumer Financial Protection Bureau’s Mortgage Performance Trends dataset, the U.S. Census Bureau’s 2022 American Community Survey 1-Year Estimates, and Zillow’s Zillow Home Value Index (ZHVI). To determine the locations with the most mortgage delinquencies, researchers ranked locations based on the percentage of mortgages at least 30 days delinquent as of December 2022. In the event of a tie, the location with the greater percentage of mortgages at least 90 days delinquent was ranked higher. For additional context, researchers also included the average unemployment rate and median household income for 2022, as well as the most recent ZHVI.
References
- U.S. Government Accountability Office. (2020, April 28). CARES Act provides relief to some homeowners during coronavirus outbreak. https://www.gao.gov/blog/cares-act-provides-relief-some-homeowners-during-coronavirus-outbreak
- Federal Reserve Bank of New York. (2023, August). Quarterly Report on Household Debt and Credit 2023:Q2. https://www.newyorkfed.org/medialibrary/interactives/householdcredit/data/pdf/HHDC_2023Q2
- Federal Reserve Bank of Philadelphia. (2023, July 5). Large Bank Credit Card and Mortgage Data [Data set]. https://fred.stlouisfed.org/series/RCMFLOORIG
- U.S. Bureau of Labor Statistics. (2023, September 1). The Employment Situation—August 2023. https://www.bls.gov/news.release/pdf/empsit.pdf
- Consumer Financial Protection Bureau. (2023, June). Mortgage performance trends [Data set]. https://www.consumerfinance.gov/data-research/mortgage-performance-trends/
- U.S. Census Bureau. (2022). American Community Survey [Data set]. https://www.census.gov/programs-surveys/acs
- Zillow. (2023, August). Housing Data [Data set]. https://www.zillow.com/research/data/
Full Results
Each company featured in our guides has been independently selected and reviewed by our research team. If you select one of these companies and click on a link, we may earn a commission.
By clicking on these links, you may be taken to one of our insurance partners. The specific company listed here may or may not be included in our partner’s network at this time.