The Best Cities to Buy a Rental Property
While COVID-19 has been detrimental to many American families, it has helped solidify the financial footing of others. With less money being spent on expenses like travel, commuting, or eating out, household savings rates rose to record levels in 2020. For middle- and high-income workers whose jobs were not interrupted by the pandemic, direct payments from the federal government and other economic stimulus funds also meant more money in the bank. And with at least a few more months before the bulk of the U.S. is vaccinated and life begins returning to normal, many of those people have been looking for the best ways to manage that money while waiting out the pandemic.
But COVID-19 has also created much more economic uncertainty, and this will affect what sort of opportunities people pursue with the money they have on hand. For instance, the uncertain environment could lead to lower rates of startup formation as would-be entrepreneurs might be more hesitant to put their savings toward new ventures. The stock market nosedived early in the pandemic before recovering over the course of 2020, but many of the gains were driven by sectors like technology that took on extra significance in the pandemic. It remains to be seen whether those sectors can keep up the level of growth they showed in 2020—and whether the sectors that struggled can bounce back after the threat of COVID-19 has passed.
Meanwhile, simply holding money in savings may be a losing proposition as well. After trillions of dollars in federal stimulus and with demand for many goods and services likely to recover in 2021, some experts are worried that the U.S. will soon see rapid inflation. Given the low interest rates most banks pay, money left in a savings account may end up worth less in an environment of high inflation.
In light of all these factors, many have turned to real estate, sending residential sales skyrocketing in 2020. Rental properties, in particular, are a product with steady demand, even in difficult economic times, and rent payments often cover the bulk of the investor’s costs over the life of the investment. Current mortgage interest rates are low, which means that favorable financing is easier to obtain. And while the residential real estate market is highly competitive for buyers at the moment due to low housing inventory, these conditions are also accelerating an appreciation in home values nationwide, which boosts investors’ long-term return.
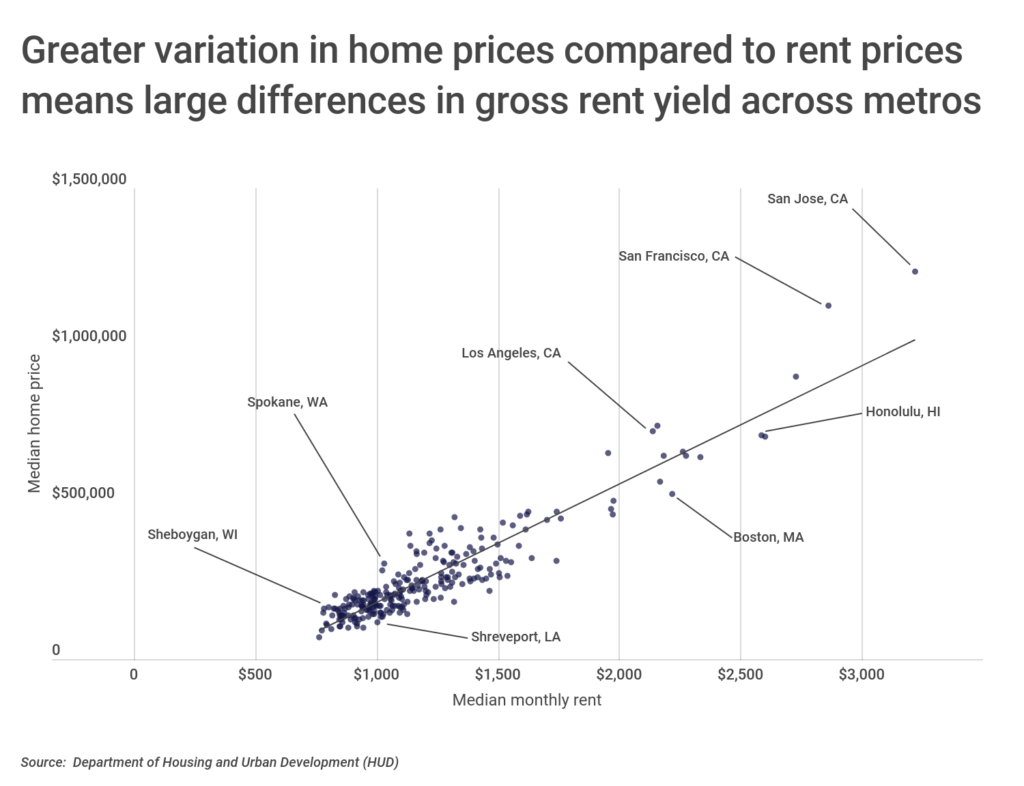
As is often the case with real estate, the potential investment opportunity in rentals looks different across different local markets. The key measure to analyze is gross rent yield, or the annualized rent to home price ratio. In general, there is a strong correlation between home prices and rent, which makes sense because one of a landlord’s primary considerations in setting rent is the cost of their home loan payments. But home prices tend to vary more across markets than rents do, so areas with more expensive homes will not generate as favorable of a return as areas with lower priced homes but comparable rent levels.
To identify the states and metros where rentals are the best investment, researchers at Construction Coverage created a composite score based on five key factors. The most important is gross rent yield, which accounts for half of the composite index; higher scores are preferable. Other factors include recent and projected changes in home prices, which indicates the potential long-term returns; the property tax burdens, which can increase costs for owners; and the unemployment rate, which is preferred to be lower, indicating that more potential tenants are working and have the ability to pay rent.
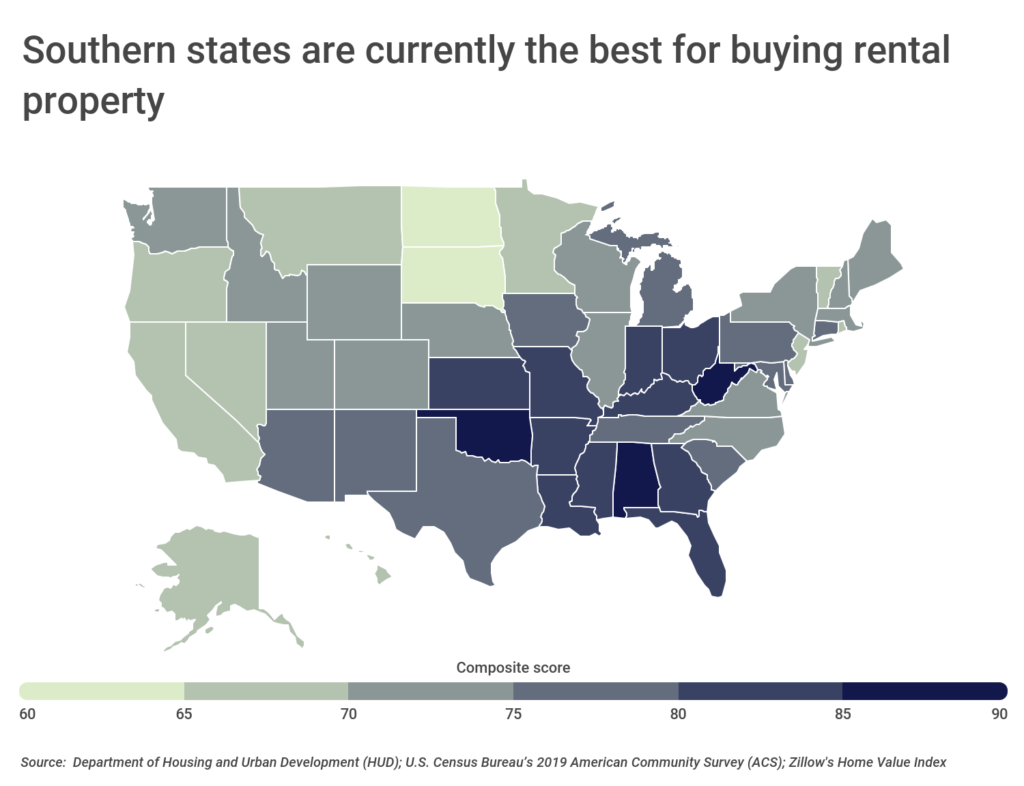
At the state level, this combination of factors highlighted locations in the South and Midwest as best for buying a rental property. Alabama (88.3 out of 100 on the composite score), Oklahoma (85.5), and West Virginia (85.2) led all states. States in these regions tend to have lower median home values, which improves the gross rental yield, and property owners also benefit from lower property tax levels.
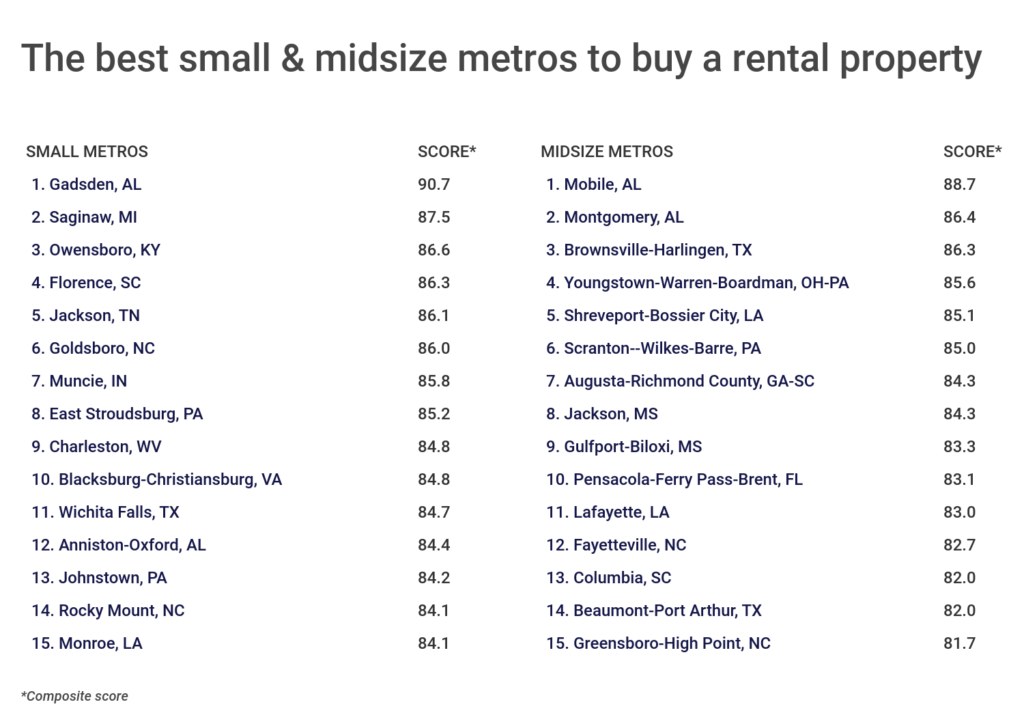
The story is much the same at the metro level. Many of the best markets to buy a rental are located in states that our composite score highlighted, and largely for the same reason: lower home values driving the key ingredient in the index, a favorable gross rental yield.
Here are the best metropolitan areas to buy a rental property.
The Best Large Metros to Buy a Rental Property

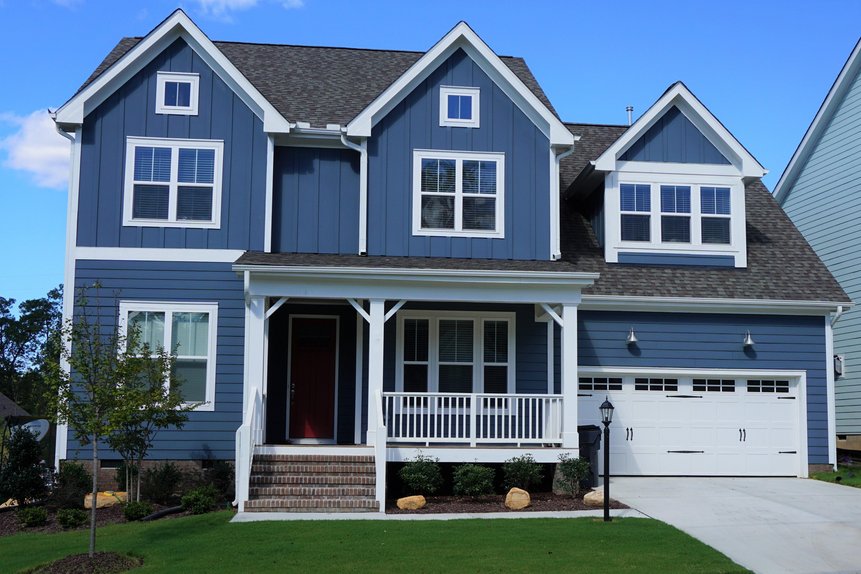
Photo Credit: Alamy Stock Photo
15. Kansas City, MO-KS
- Composite score: 75.8
- Gross rental yield: 6.05%
- Median home price: $220,301
- Previous 1-year change in home price: 9.98%
- Projected 1-year change in home price: 10.40%
- Average property tax burden: 1.17%
- 2019 unemployment rate: 3.4%
FOR COMMERCIAL PROPERTY OWNERS
As a way to protect your property and assets, make sure to have commercial property insurance coverage.

Photo Credit: Alamy Stock Photo
14. Miami-Fort Lauderdale-Pompano Beach, FL
- Composite score: 76.3
- Gross rental yield: 6.69%
- Median home price: $312,574
- Previous 1-year change in home price: 6.98%
- Projected 1-year change in home price: 8.40%
- Average property tax burden: 0.92%
- 2019 unemployment rate: 4.3%
Photo Credit: Alamy Stock Photo
13. Virginia Beach-Norfolk-Newport News, VA-NC
- Composite score: 76.3
- Gross rental yield: 6.55%
- Median home price: $259,731
- Previous 1-year change in home price: 7.78%
- Projected 1-year change in home price: 9.50%
- Average property tax burden: 0.84%
- 2019 unemployment rate: 5.1%

Photo Credit: Alamy Stock Photo
12. Orlando-Kissimmee-Sanford, FL
- Composite score: 76.7
- Gross rental yield: 6.57%
- Median home price: $268,806
- Previous 1-year change in home price: 7.17%
- Projected 1-year change in home price: 8.80%
- Average property tax burden: 0.86%
- 2019 unemployment rate: 4.1%

Photo Credit: Alamy Stock Photo
11. Pittsburgh, PA
- Composite score: 77.0
- Gross rental yield: 6.69%
- Median home price: $174,771
- Previous 1-year change in home price: 9.25%
- Projected 1-year change in home price: 10.10%
- Average property tax burden: 1.48%
- 2019 unemployment rate: 4.3%

Photo Credit: Alamy Stock Photo
10. Phoenix-Mesa-Chandler, AZ
- Composite score: 77.3
- Gross rental yield: 5.35%
- Median home price: $315,045
- Previous 1-year change in home price: 15.30%
- Projected 1-year change in home price: 14.70%
- Average property tax burden: 0.57%
- 2019 unemployment rate: 4.5%

Photo Credit: Alamy Stock Photo
9. New Orleans-Metairie, LA
- Composite score: 77.7
- Gross rental yield: 6.65%
- Median home price: $217,016
- Previous 1-year change in home price: 7.49%
- Projected 1-year change in home price: 8.00%
- Average property tax burden: 0.65%
- 2019 unemployment rate: 5.4%

Photo Credit: Alamy Stock Photo
8. Atlanta-Sandy Springs-Alpharetta, GA
- Composite score: 77.8
- Gross rental yield: 6.51%
- Median home price: $255,109
- Previous 1-year change in home price: 8.93%
- Projected 1-year change in home price: 10.10%
- Average property tax burden: 0.88%
- 2019 unemployment rate: 4.3%

Photo Credit: Alamy Stock Photo
7. Detroit-Warren-Dearborn, MI
- Composite score: 78.1
- Gross rental yield: 6.72%
- Median home price: $195,270
- Previous 1-year change in home price: 9.78%
- Projected 1-year change in home price: 12.30%
- Average property tax burden: 1.37%
- 2019 unemployment rate: 5.3%

Photo Credit: Alamy Stock Photo
6. Indianapolis-Carmel-Anderson, IN
- Composite score: 78.2
- Gross rental yield: 6.34%
- Median home price: $200,366
- Previous 1-year change in home price: 10.59%
- Projected 1-year change in home price: 9.80%
- Average property tax burden: 0.88%
- 2019 unemployment rate: 4.2%

Photo Credit: Alamy Stock Photo
5. Rochester, NY
- Composite score: 78.3
- Gross rental yield: 7.20%
- Median home price: $169,546
- Previous 1-year change in home price: 9.87%
- Projected 1-year change in home price: 10.50%
- Average property tax burden: 2.56%
- 2019 unemployment rate: 4.1%

Photo Credit: Alamy Stock Photo
4. Oklahoma City, OK
- Composite score: 79.8
- Gross rental yield: 7.48%
- Median home price: $171,213
- Previous 1-year change in home price: 7.36%
- Projected 1-year change in home price: 7.30%
- Average property tax burden: 0.93%
- 2019 unemployment rate: 4.1%

Photo Credit: Alamy Stock Photo
3. Memphis, TN-MS-AR
- Composite score: 81.7
- Gross rental yield: 7.69%
- Median home price: $167,904
- Previous 1-year change in home price: 10.57%
- Projected 1-year change in home price: 9.70%
- Average property tax burden: 1.01%
- 2019 unemployment rate: 6.0%

Photo Credit: Alamy Stock Photo
2. Tampa-St. Petersburg-Clearwater, FL
- Composite score: 81.8
- Gross rental yield: 6.76%
- Median home price: $240,308
- Previous 1-year change in home price: 11.43%
- Projected 1-year change in home price: 12.30%
- Average property tax burden: 0.90%
- 2019 unemployment rate: 4.6%

Photo Credit: Alamy Stock Photo
1. Birmingham-Hoover, AL
- Composite score: 86.6
- Gross rental yield: 7.61%
- Median home price: $184,012
- Previous 1-year change in home price: 9.27%
- Projected 1-year change in home price: 9.10%
- Average property tax burden: 0.49%
- 2019 unemployment rate: 4.5%
Methodology & Detailed Findings
To identify the best cities and states to buy rental property, researchers created a composite score using the following metrics:
- Gross rental yield: The ratio of annualized median rent to Zillow’s Home Value Index
- Previous 1-year change in home price: A smoothed, seasonally adjusted measure of the typical home value and market changes across a given region and housing type
- Projected 1-year change in home price: The one-year forecast of the Zillow Home Values Index
- Average property tax burden: Aggregate annual real estate taxes paid as a proportion of aggregate home value
- 2019 unemployment rate: Percentage of the population that is unemployed
For the gross rental yield, previous 1-year change in home prices, and projected 1-year change in home prices, a higher number was associated with being better for buying a rental property. For the average property tax burden and unemployment rates, a lower number was associated with being better for buying rental property. Metrics were given the following weight in the calculation of the composite score: gross rental yield (50%); previous 1-year change in home price (10%); projected 1-year change in home price (10%); average property tax burden (20%); 2019 unemployment rate (10%).
Gross rental yield data was derived from the Department of Housing and Urban Development (HUD), the U.S. Census Bureau’s 2019 American Community Survey (ACS), and Zillow. Gross rental yield was calculated as the ratio of annualized median rent to Zillow’s Home Value Index. Median rent was calculated as the weighted average of rent for a studio, 1-bedroom, 2-bedroom, 3-bedroom, and 4-bedroom apartment. The number of renter households by bedroom from the ACS were used as weights. Home price data came from Zillow’s most recent Home Value Index. Projected 1-year change in home prices for the states were calculated by finding the population-based weighted average of the composite metro values within each state. Property tax data and unemployment rates came from the U.S. Census Bureau’s 2019 ACS. The average property tax burden for each metro was calculated by dividing aggregate real estate taxes paid by the aggregate value of homes in each location.
To improve relevance, metros were grouped based on population size: small (100,000-349,999), midsize (349,999—999,999), and large (1,000,000 or more).