
The Best-Paying American Cities for Civil Engineers in 2022
All businesses and economies are built on infrastructure. Networks of roads, rail, bridges, ports, utilities, and more make it possible to provide goods and services across the country. Quality infrastructure helps lower the cost of supplies and transportation, which helps stimulate further economic growth. By one estimate, every dollar spent on infrastructure generates $3 in additional economic return.
Unfortunately, the quality of infrastructure in the U.S. has been in a period of decline. The American Society of Civil Engineers currently rates U.S. infrastructure at a C- level on its annual report card, and for most of the last 25 years, the U.S. has struggled to score higher than a D overall. Low levels of investment in new infrastructure and growing backlogs of maintenance needs for existing systems have contributed to the country’s low marks in recent years.
But recently, the federal government has acted to address the nation’s infrastructure needs. One of the Biden Administration and Congress’s major accomplishments in 2021 was a bipartisan law intended to modernize U.S. infrastructure, enacted last November. The $1.2 trillion package included significant investments ranging from traditional infrastructure needs like roads, bridges, rail, and water and electricity distribution to emerging priorities including broadband, electric vehicle chargers, and climate resilience. Implementation of the bill is poised to directly create hundreds of thousands of new jobs in the U.S. economy each year and allow other businesses that rely on infrastructure to grow and expand in the years ahead.
RELATED
Even the best civil engineering firms face liability-related lawsuits, which is why it’s important for them to have reliable insurance. In addition to having general liability insurance, civil engineers should also maintain a policy with one of the best errors and omissions insurance companies. E&O insurance protects firms in the event that they make a mistake while performing their work.
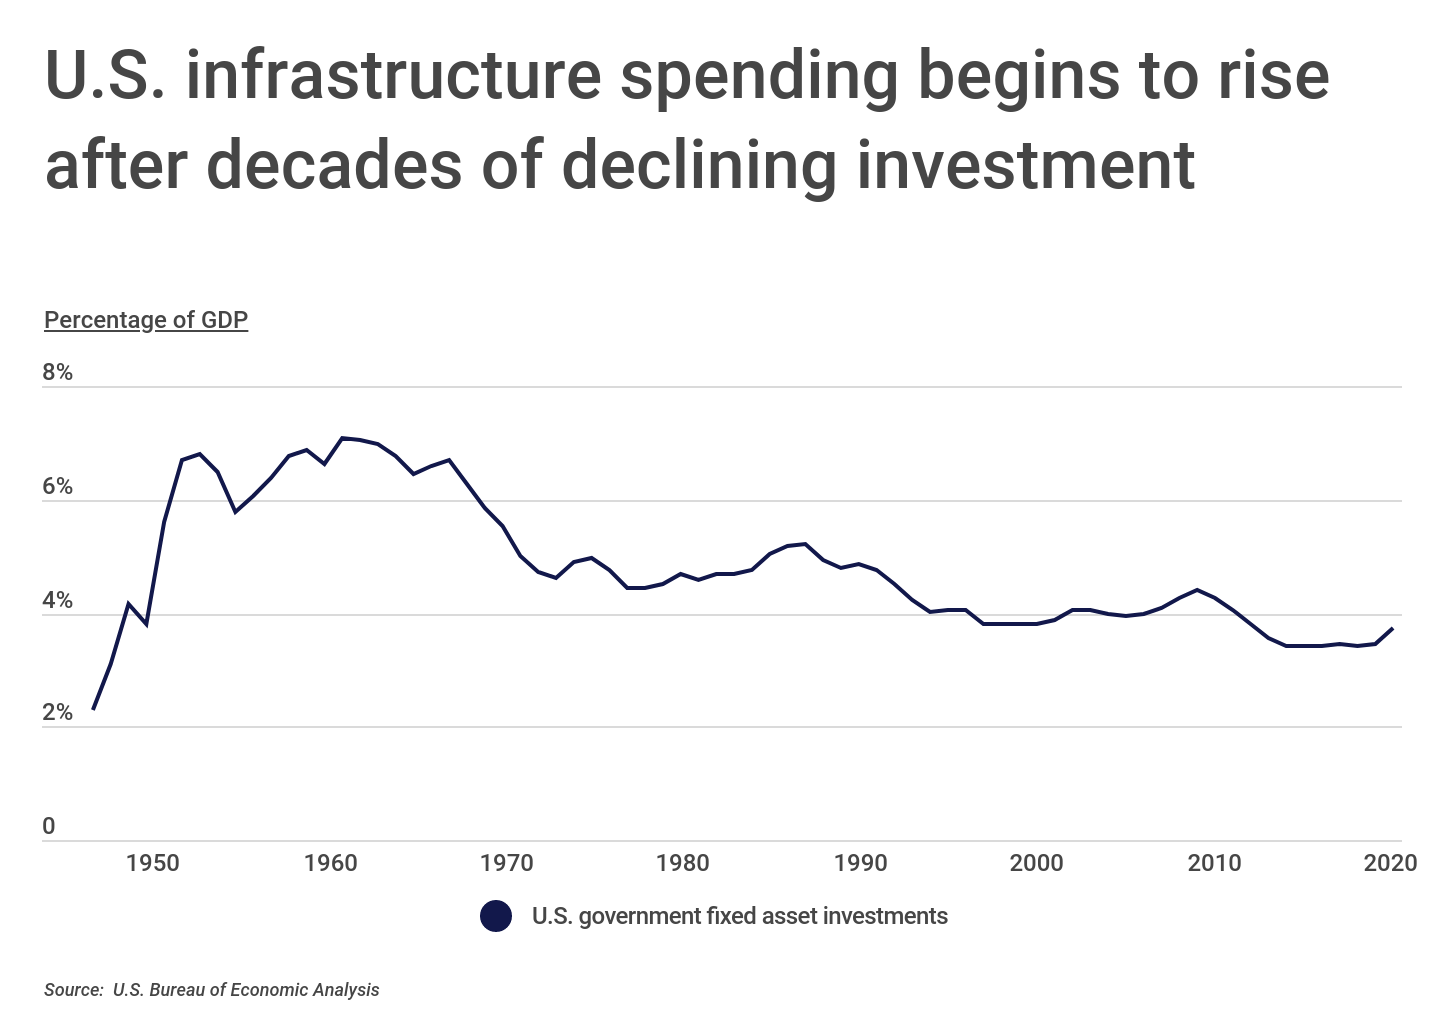
The infrastructure bill will bring much-needed investment after decades of declining spending relative to GDP. After World War II, the U.S. government invested heavily in physical infrastructure like the Interstate Highway System, dams, and ports, which set up the U.S. for an economic boom. Government spending on infrastructure as a percentage of GDP peaked at 7.08% in 1961 and has declined over time. Following a brief increase with the American Recovery and Reinvestment Act of 2009 in response to the Great Recession, U.S. government infrastructure spending has been flat at around 3.5% of GDP for the last decade.
The new legislation also represents an opportunity for infrastructure professionals, including engineers. Civil engineers, who design, operate, construct, and maintain infrastructure projects, will be critical in carrying out new projects in the years ahead. The Bureau of Labor Statistics estimated in 2020 that civil engineering jobs would grow by 8% by 2030, a number that could increase with new demand.
TRENDING SOFTWARE FOR CONSTRUCTION
- Construction takeoff – automatically generates material counts from digital plans.
- Construction estimating – speeds up and improves the accuracy of material and labor cost estimates.
- Construction project management – serves as the primary collaboration and communication tool for large projects.
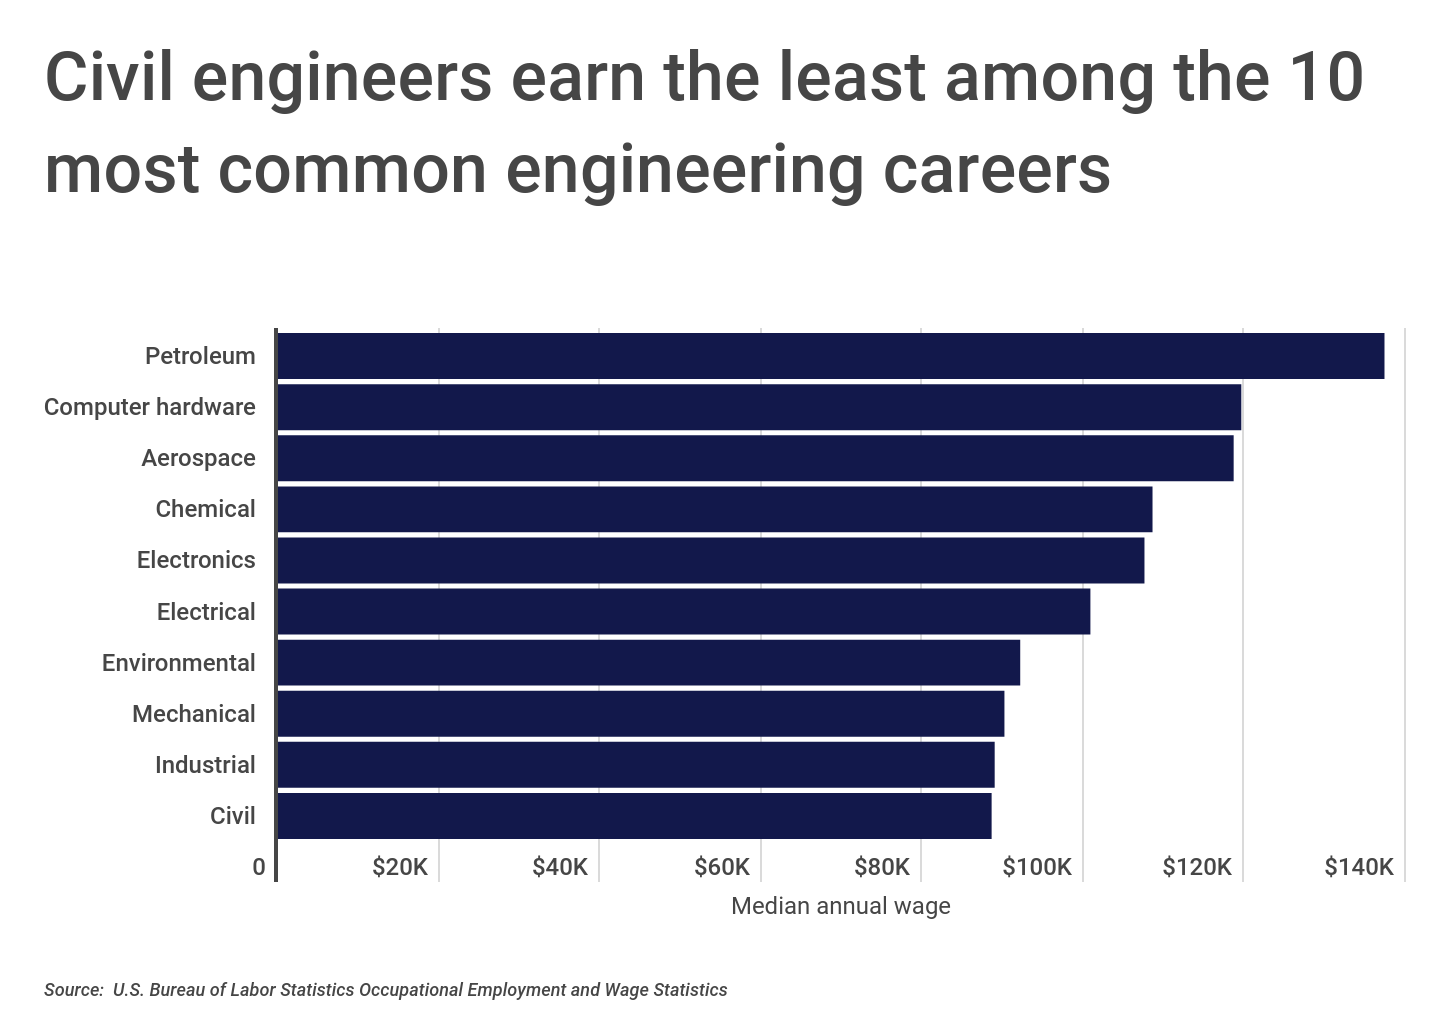
Civil engineers are also currently the lowest-paid of the largest engineering disciplines at a median annual wage of $88,570. Part of the reason is that many civil engineering projects are publicly funded, which means bidders must keep costs low. But with heightened demand for their skillset, civil engineers could also potentially see wage growth in the years ahead.
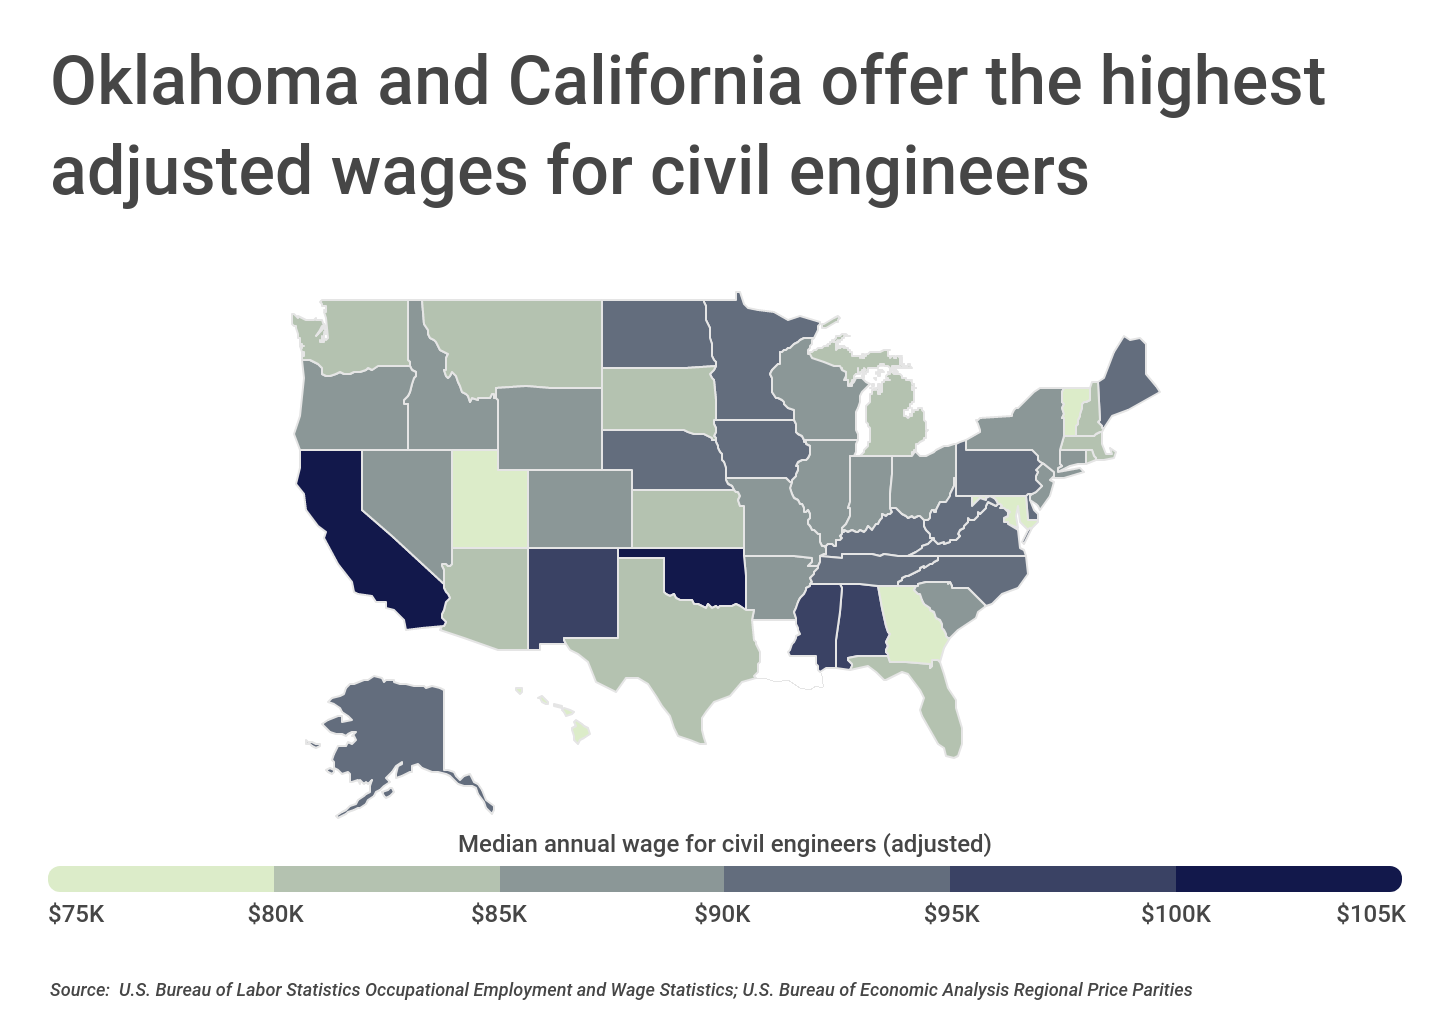
Wages for civil engineers vary by location, which can reflect factors like the demand for infrastructure projects, the supply of engineers, and cost of living. For example, California—a high-cost state with many large cities that have significant infrastructure needs—is one of the best-paying states for civil engineers at $101,332. In contrast, civil engineers in a smaller, more rural state like Vermont only earn $76,455 per year, after adjusting for cost of living.
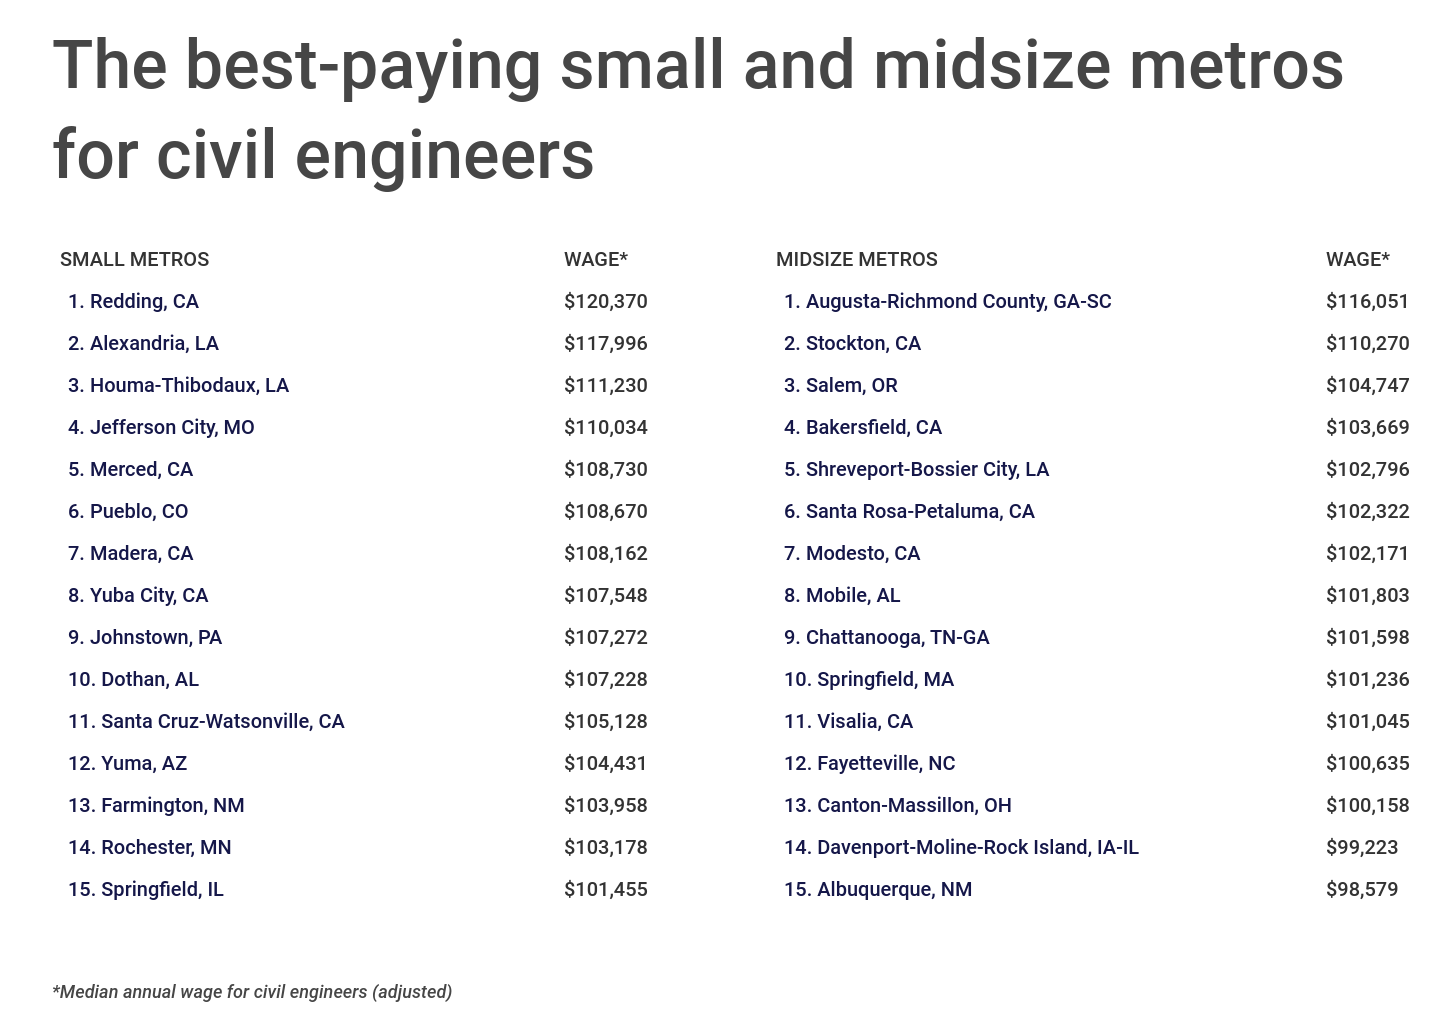
At the metro level, population growth, density, and geography are also factors. Many of the best-paying cities for engineers are sprawling metros that have more roads and bridges, quickly growing locations that need infrastructure to support the population, or a location like New Orleans, which has unique needs for flood control due to its location on the Mississippi River.
The data used in this analysis is from the U.S. Bureau of Labor Statistics Occupational Employment and Wage Statistics and the U.S. Bureau of Economic Analysis Regional Price Parities datasets. To determine the best-paying locations for civil engineers, researchers at Construction Coverage calculated the median annual wage for civil engineers, adjusted for cost-of-living differences. In the event of a tie, the location with the higher median annual wage for civil engineers, unadjusted, was ranked higher.
Here are the best-paying U.S. metropolitan areas for civil engineers.
The Best-Paying Large Metros for Civil Engineers

Photo Credit: Andrew Zarivny / Shutterstock
15. Rochester, NY
- Median annual wage for civil engineers (adjusted): $91,617
- Median annual wage for civil engineers (actual): $90,060
- Median annual wage for all architecture & engineering jobs (actual): $79,510
- Median annual wage for all jobs (actual): $42,430
- Concentration of civil engineers (compared to average): -23.0%
RELATED POSTS

Photo Credit: Virrage Images / Shutterstock
14. Las Vegas-Henderson-Paradise, NV
- Median annual wage for civil engineers (adjusted): $91,872
- Median annual wage for civil engineers (actual): $89,300
- Median annual wage for all architecture & engineering jobs (actual): $77,160
- Median annual wage for all jobs (actual): $37,690
- Concentration of civil engineers (compared to average): -13.0%

Photo Credit: The Speedy Butterfly / Shutterstock
13. Memphis, TN-MS-AR
- Median annual wage for civil engineers (adjusted): $93,679
- Median annual wage for civil engineers (actual): $86,840
- Median annual wage for all architecture & engineering jobs (actual): $72,200
- Median annual wage for all jobs (actual): $37,110
- Concentration of civil engineers (compared to average): -69.0%

Photo Credit: Sean Pavone / Shutterstock
12. Louisville/Jefferson County, KY-IN
- Median annual wage for civil engineers (adjusted): $96,083
- Median annual wage for civil engineers (actual): $88,300
- Median annual wage for all architecture & engineering jobs (actual): $71,920
- Median annual wage for all jobs (actual): $39,330
- Concentration of civil engineers (compared to average): -11.0%

Photo Credit: AevanStock / Shutterstock
11. Pittsburgh, PA
- Median annual wage for civil engineers (adjusted): $98,798
- Median annual wage for civil engineers (actual): $94,550
- Median annual wage for all architecture & engineering jobs (actual): $79,070
- Median annual wage for all jobs (actual): $43,200
- Concentration of civil engineers (compared to average): +46.0%

Photo Credit: cordwainer / Shutterstock
10. San Jose-Sunnyvale-Santa Clara, CA
- Median annual wage for civil engineers (adjusted): $98,903
- Median annual wage for civil engineers (actual): $110,870
- Median annual wage for all architecture & engineering jobs (actual): $123,400
- Median annual wage for all jobs (actual): $69,620
- Concentration of civil engineers (compared to average): +5.0%

Photo Credit: Sean Pavone / Shutterstock
9. San Francisco-Oakland-Berkeley, CA
- Median annual wage for civil engineers (adjusted): $100,145
- Median annual wage for civil engineers (actual): $117,570
- Median annual wage for all architecture & engineering jobs (actual): $101,430
- Median annual wage for all jobs (actual): $61,790
- Concentration of civil engineers (compared to average): +95.0%

Photo Credit: Sean Pavone / Shutterstock
8. Jacksonville, FL
- Median annual wage for civil engineers (adjusted): $100,426
- Median annual wage for civil engineers (actual): $96,710
- Median annual wage for all architecture & engineering jobs (actual): $79,280
- Median annual wage for all jobs (actual): $38,280
- Concentration of civil engineers (compared to average): +8.0%

Photo Credit: Chones / Shutterstock
7. Los Angeles-Long Beach-Anaheim, CA
- Median annual wage for civil engineers (adjusted): $100,965
- Median annual wage for civil engineers (actual): $112,980
- Median annual wage for all architecture & engineering jobs (actual): $95,120
- Median annual wage for all jobs (actual): $45,550
- Concentration of civil engineers (compared to average): +10.0%

Photo Credit: Nick Fox / Shutterstock
6. Oklahoma City, OK
- Median annual wage for civil engineers (adjusted): $104,520
- Median annual wage for civil engineers (actual): $98,040
- Median annual wage for all architecture & engineering jobs (actual): $81,070
- Median annual wage for all jobs (actual): $39,080
- Concentration of civil engineers (compared to average): -48.0%

Photo Credit: Matt Gush / Shutterstock
5. Riverside-San Bernardino-Ontario, CA
- Median annual wage for civil engineers (adjusted): $104,706
- Median annual wage for civil engineers (actual): $108,580
- Median annual wage for all architecture & engineering jobs (actual): $84,270
- Median annual wage for all jobs (actual): $39,630
- Concentration of civil engineers (compared to average): -7.0%

Photo Credit: Sean Pavone / Shutterstock
4. Tulsa, OK
- Median annual wage for civil engineers (adjusted): $104,758
- Median annual wage for civil engineers (actual): $97,320
- Median annual wage for all architecture & engineering jobs (actual): $80,350
- Median annual wage for all jobs (actual): $38,210
- Concentration of civil engineers (compared to average): +16.0%

Photo Credit: f11photo / Shutterstock
3. New Orleans-Metairie, LA
- Median annual wage for civil engineers (adjusted): $113,488
- Median annual wage for civil engineers (actual): $109,970
- Median annual wage for all architecture & engineering jobs (actual): $86,010
- Median annual wage for all jobs (actual): $38,280
- Concentration of civil engineers (compared to average): -5.0%

Photo Credit: Andrew Zarivny / Shutterstock
2. Sacramento-Roseville-Folsom, CA
- Median annual wage for civil engineers (adjusted): $117,078
- Median annual wage for civil engineers (actual): $124,220
- Median annual wage for all architecture & engineering jobs (actual): $102,230
- Median annual wage for all jobs (actual): $48,070
- Concentration of civil engineers (compared to average): +129.0%

Photo Credit: Matt Gush / Shutterstock
1. Fresno, CA
- Median annual wage for civil engineers (adjusted): $118,246
- Median annual wage for civil engineers (actual): $118,010
- Median annual wage for all architecture & engineering jobs (actual): $90,870
- Median annual wage for all jobs (actual): $37,050
- Concentration of civil engineers (compared to average): +8.0%
Detailed Findings & Methodology
The data used in this analysis is from the U.S. Bureau of Labor Statistics Occupational Employment and Wage Statistics and the U.S. Bureau of Economic Analysis Regional Price Parities datasets. To determine the best-paying locations for civil engineers, researchers calculated the median annual wage for civil engineers, adjusted for cost-of-living differences. In the event of a tie, the location with the higher median annual wage for civil engineers, unadjusted, was ranked higher. To improve relevance, only metropolitan areas with at least 100,000 residents were included. Additionally, metros were grouped into cohorts based on population size: small (100,000-349,999), midsize (350,000-999,999), and large (1,000,000 or more). Note, only states and metropolitan areas with sufficient occupational and wage data were included.