
Best-Paying American Cities for Mechanical Engineers in 2022
Experts of all stripes agree that the fields of science, technology, engineering, and mathematics (STEM) are critical to the U.S. economy. A recent study estimated that STEM supports 67% of jobs in the U.S. and 69% of the country’s GDP. By generating innovation and technological advances, STEM fields help improve quality of life, make businesses more productive, and create new economic opportunities. And for students or professionals considering new careers, STEM fields are full of high-quality jobs: the number of STEM jobs has increased by 79% over the last three decades and is projected to grow by another 11% by 2030.
Of these fields, mechanical engineering is one of the most important in moving the U.S. economy forward. Mechanical engineers research, design, develop, and build a variety of mechanical devices. Their work touches almost every aspect of life in the U.S., from everyday consumer goods, like cars or home appliances, to tools that power the economy, like manufacturing equipment. And increasingly, mechanical engineers are working with innovative new technologies like robotics or nanotechnology that could open new economic frontiers.
With such a vital role in the U.S. economy, the job outlook for mechanical engineers is promising. The Bureau of Labor Statistics projects a 7% growth rate in jobs in the field between now and 2030. As manufacturing technologies become more complex, mechanical engineers’ skill set will continue to be in demand.
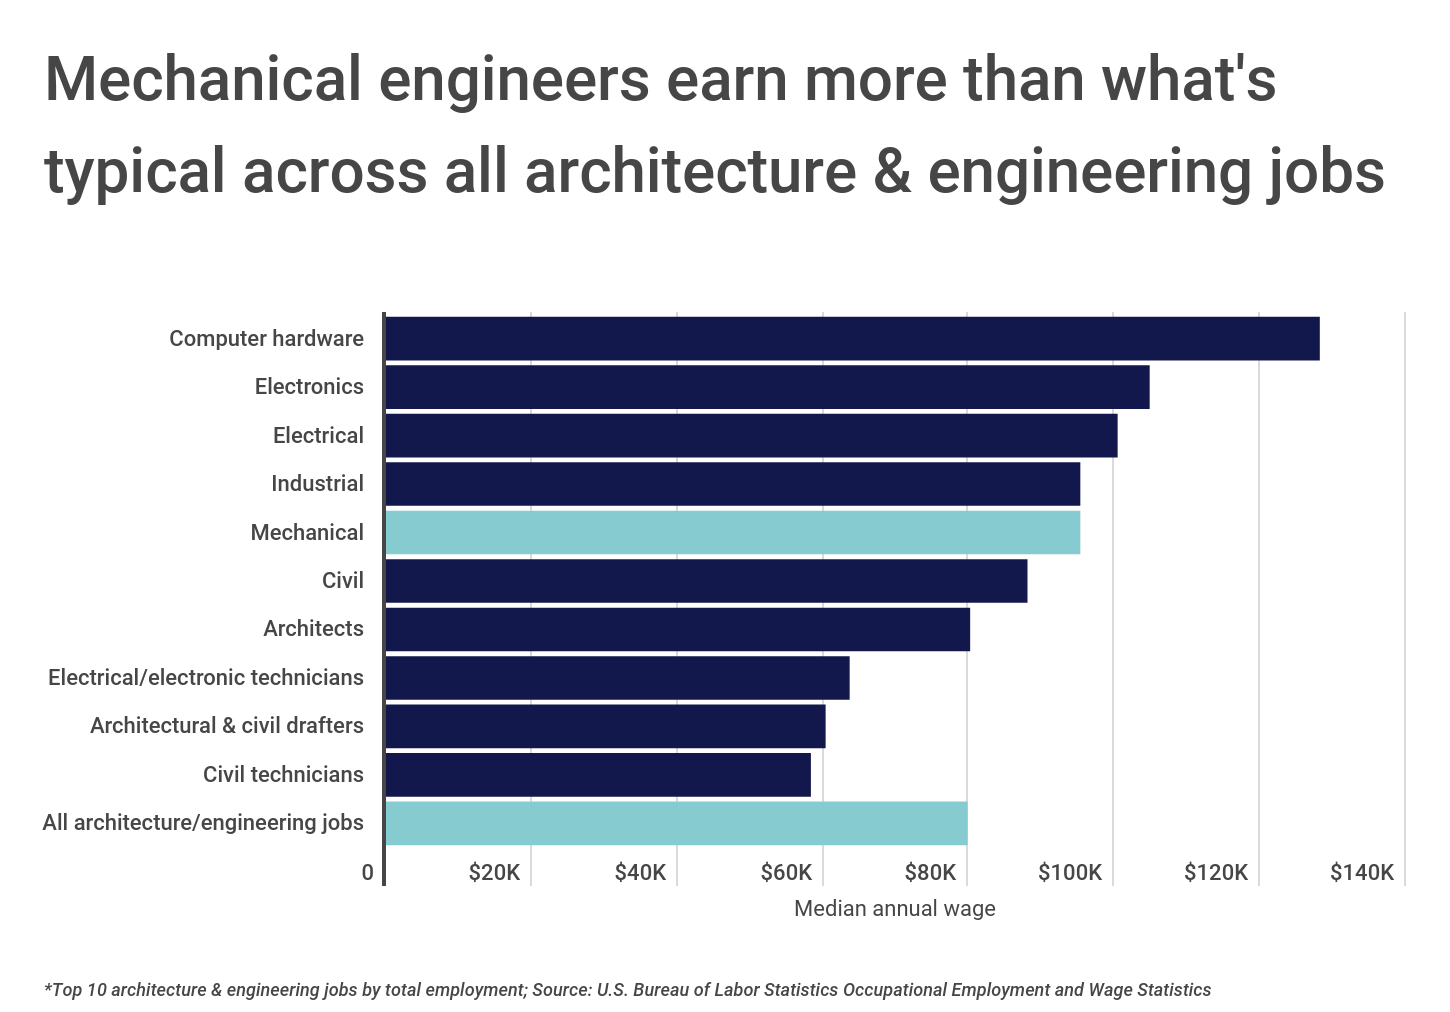
Another factor that makes mechanical engineering a strong choice of profession, like many other STEM jobs, is compensation. The median wage for a mechanical engineer in the U.S. is $95,300 per year, more than double the nation’s overall median wage for all occupations of $45,760.
RELATED
Travelers Insurance offers one of the best errors and omissions policies for engineers and architects.
Mechanical engineers even compare favorably for compensation relative to other architecture and engineering jobs. The median wage for mechanical engineers is nearly 20% higher than the median wage for all architecture and engineering jobs, $79,840. And only three other engineering disciplines have median wages that exceed the typical rate of pay for mechanical engineers.
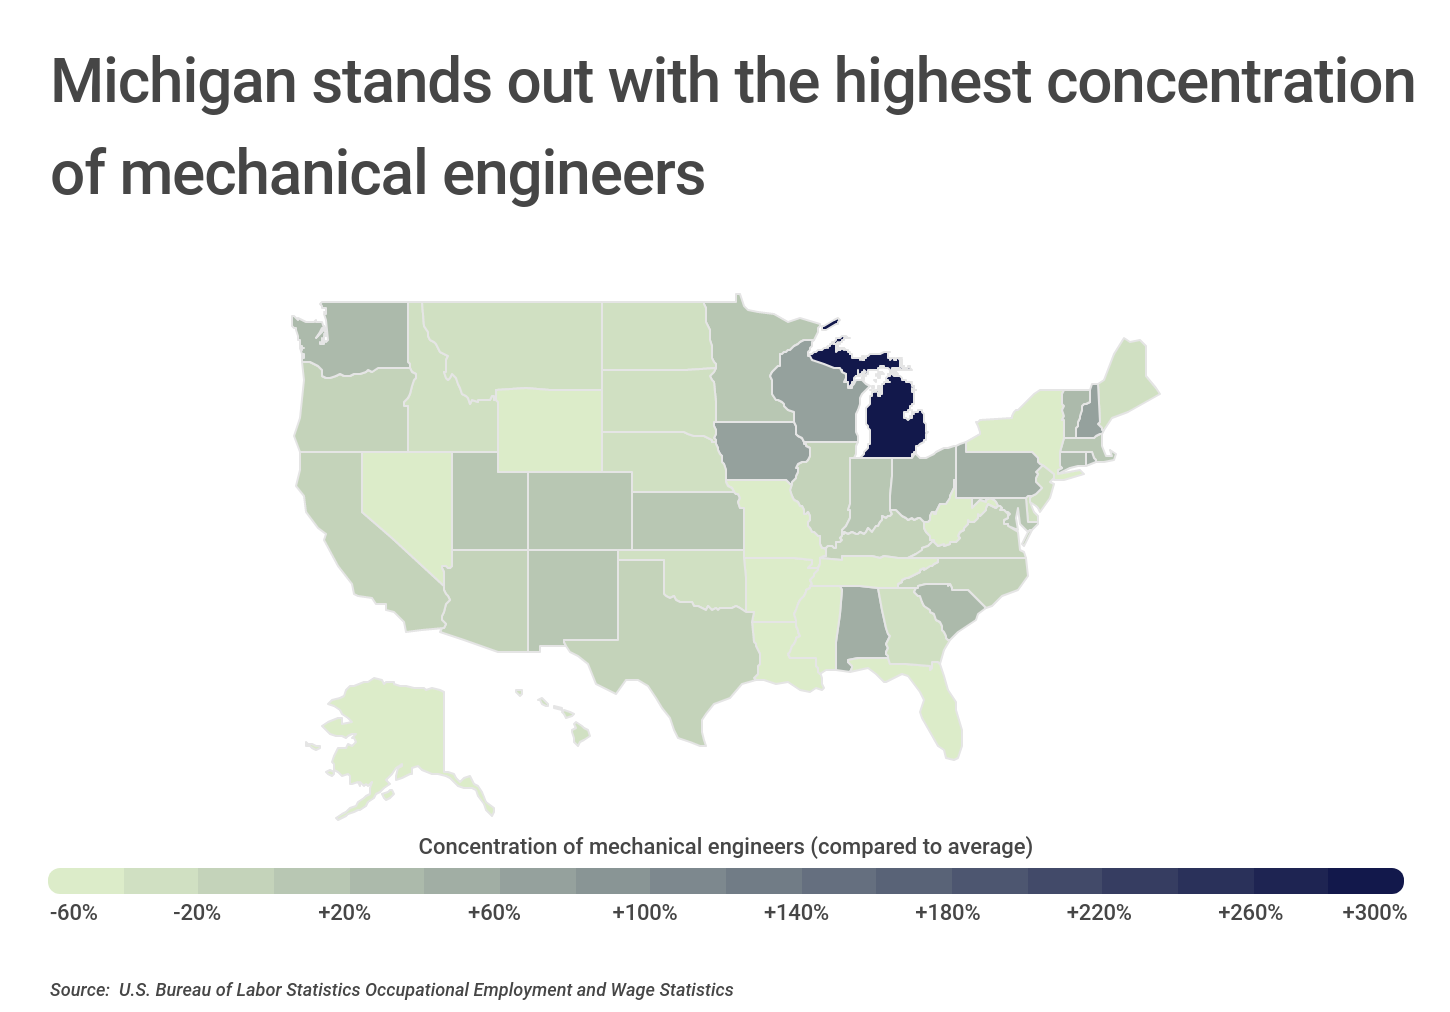
Jobs in mechanical engineering can be found throughout the U.S., but states with economies that are reliant on manufacturing tend to have the most mechanical engineers employed. In particular, Michigan is by far the nation’s leader in the concentration of mechanical engineers, with 306% more than the national average. One of the primary reasons is Michigan’s auto manufacturing industry, which draws heavily on mechanical engineers for the design and production of cars and auto parts.
DID YOU KNOW?
If your job requires you to travel to different job sites, it’s important to have a commercial auto insurance policy. Depending on your needs, there are also more specialized commercial truck policies as well.
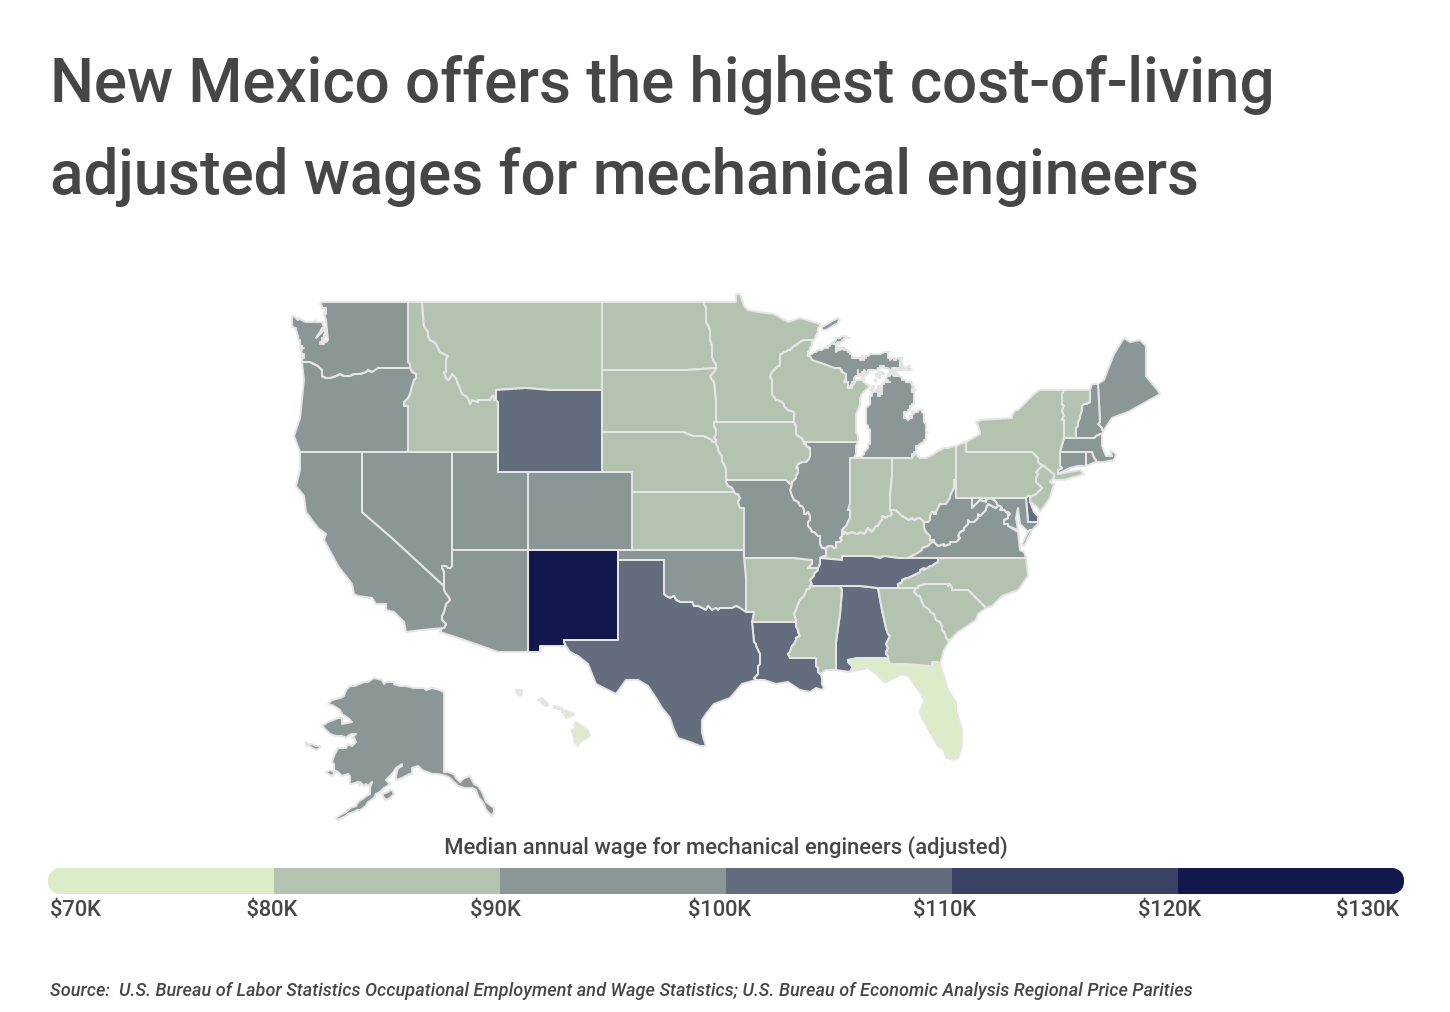
But for mechanical engineers considering where to work, locations that have a high concentration of engineers may not necessarily be the best location to maximize earning potential. Most of the states that have the highest adjusted median wage for mechanical engineers also have relatively low concentrations of mechanical engineers present. New Mexico leads all states with a $131,430 median wage, followed by Louisiana at $108,975 and Wyoming at $104,117.
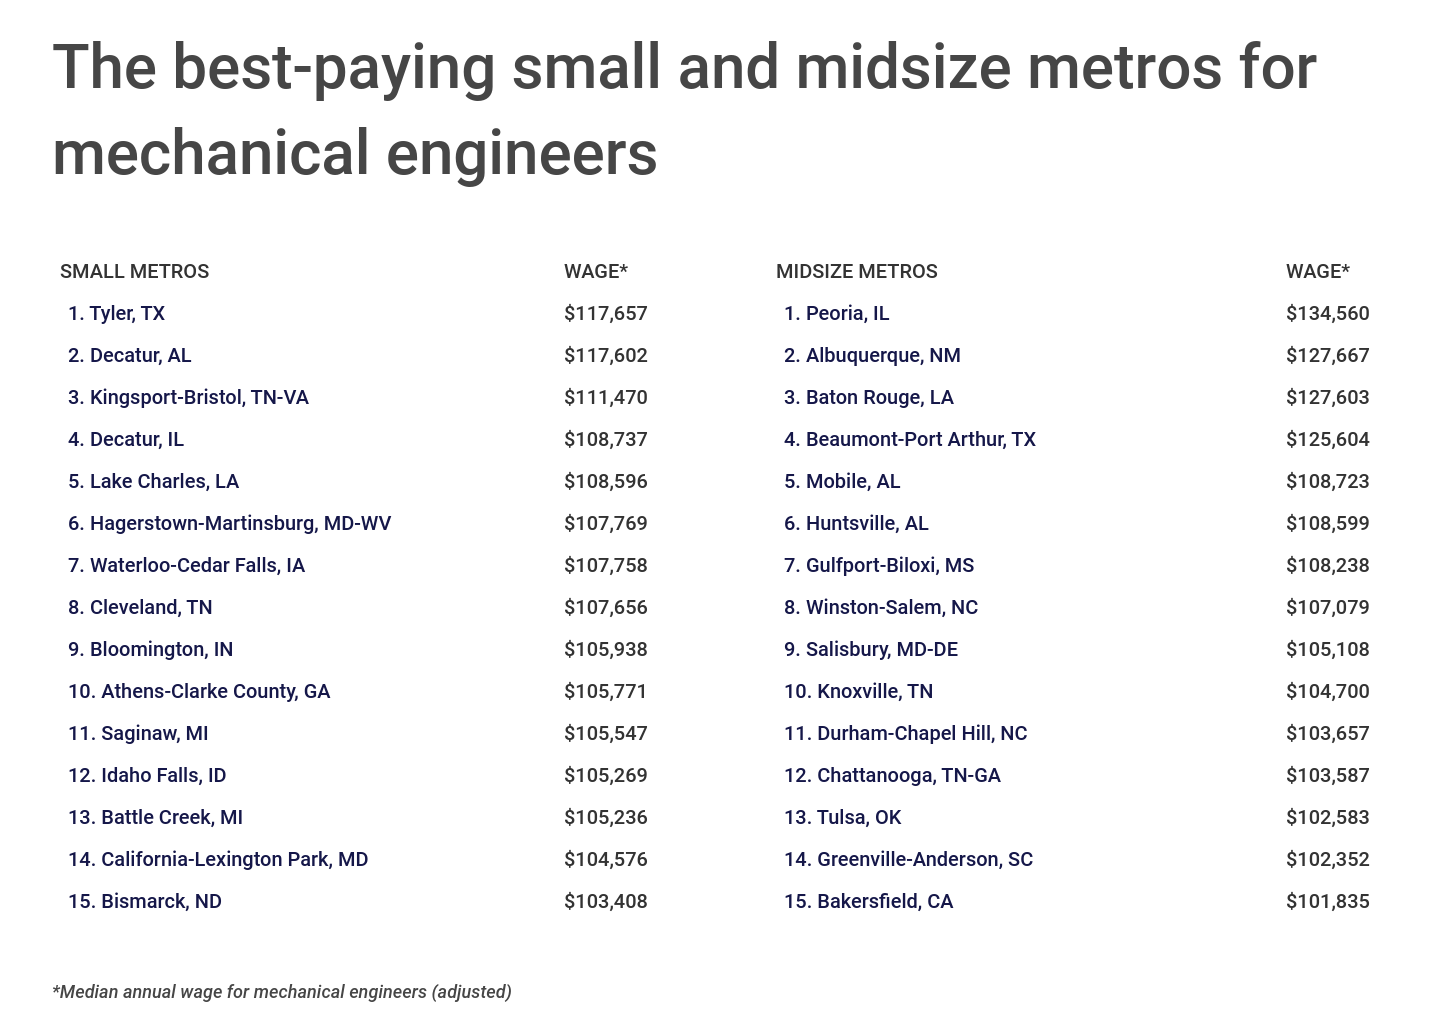
At the metro level, however, a number of cities offer a combination of plentiful mechanical engineering employment and higher-than-usual wages. Nine major cities in the U.S. have a median wage for mechanical engineers above $100,000 per year, of which six also have above-average concentrations of mechanical engineers.
The data used in this analysis is from the U.S. Bureau of Labor Statistics Occupational Employment and Wage Statistics and the U.S. Bureau of Economic Analysis Regional Price Parities datasets. To determine the best-paying locations for mechanical engineers, researchers at Construction Coverage calculated the median annual wage for mechanical engineers, adjusted for cost of living. In the event of a tie, the location with the greater median annual wage for mechanical engineers, not adjusted for cost of living, was ranked higher. To improve relevance, only metropolitan areas with at least 100,000 residents were included. Additionally, metros were grouped into cohorts based on population size: small (100,000-349,999), midsize (350,000-999,999), and large (1,000,000 or more). Note: only states and metropolitan areas with sufficient occupational and wage data were included.
Here are the best-paying metros for mechanical engineers.
Best-Paying Large Metros for Mechanical Engineers

Photo Credit: Sean Pavone / Shutterstock
15. Philadelphia-Camden-Wilmington, PA-NJ-DE-MD
- Median annual wage for mechanical engineers (adjusted): $97,107
- Median annual wage for mechanical engineers (actual): $99,340
- Median annual wage for all architecture & engineering jobs (actual): $87,550
- Median annual wage for all occupations (actual): $47,530
- Concentration of mechanical engineers (compared to average): +24.0%

Photo Credit: f11photo / Shutterstock
14. San Antonio-New Braunfels, TX
- Median annual wage for mechanical engineers (adjusted): $97,181
- Median annual wage for mechanical engineers (actual): $95,140
- Median annual wage for all architecture & engineering jobs (actual): $76,110
- Median annual wage for all occupations (actual): $37,960
- Concentration of mechanical engineers (compared to average): -54.0%

Photo Credit: Roschetzky Photography / Shutterstock
13. Austin-Round Rock-Georgetown, TX
- Median annual wage for mechanical engineers (adjusted): $97,986
- Median annual wage for mechanical engineers (actual): $99,750
- Median annual wage for all architecture & engineering jobs (actual): $80,120
- Median annual wage for all occupations (actual): $46,910
- Concentration of mechanical engineers (compared to average): -12.0%

Photo Credit: Andrey Bayda / Shutterstock
12. Las Vegas-Henderson-Paradise, NV
- Median annual wage for mechanical engineers (adjusted): $98,045
- Median annual wage for mechanical engineers (actual): $95,300
- Median annual wage for all architecture & engineering jobs (actual): $78,210
- Median annual wage for all occupations (actual): $37,550
- Concentration of mechanical engineers (compared to average): -70.0%

Photo Credit: Maciej Bledowski / Shutterstock
11. Salt Lake City, UT
- Median annual wage for mechanical engineers (adjusted): $99,376
- Median annual wage for mechanical engineers (actual): $97,090
- Median annual wage for all architecture & engineering jobs (actual): $77,550
- Median annual wage for all occupations (actual): $46,900
- Concentration of mechanical engineers (compared to average): -1.0%

Photo Credit: picsbyst / Shutterstock
10. St. Louis, MO-IL
- Median annual wage for mechanical engineers (adjusted): $99,582
- Median annual wage for mechanical engineers (actual): $95,300
- Median annual wage for all architecture & engineering jobs (actual): $79,150
- Median annual wage for all occupations (actual): $44,050
- Concentration of mechanical engineers (compared to average): -36.0%

Photo Credit: jdross75 / Shutterstock
9. Nashville-Davidson–Murfreesboro–Franklin, TN
- Median annual wage for mechanical engineers (adjusted): $100,093
- Median annual wage for mechanical engineers (actual): $97,090
- Median annual wage for all architecture & engineering jobs (actual): $77,540
- Median annual wage for all occupations (actual): $39,260
- Concentration of mechanical engineers (compared to average): -41.0%

Photo Credit: Jason Sponseller / Shutterstock
8. Pittsburgh, PA
- Median annual wage for mechanical engineers (adjusted): $100,731
- Median annual wage for mechanical engineers (actual): $96,400
- Median annual wage for all architecture & engineering jobs (actual): $79,130
- Median annual wage for all occupations (actual): $46,210
- Concentration of mechanical engineers (compared to average): +101.0%

Photo Credit: Mrbrown928 / Shutterstock
7. Detroit-Warren-Dearborn, MI
- Median annual wage for mechanical engineers (adjusted): $101,710
- Median annual wage for mechanical engineers (actual): $98,760
- Median annual wage for all architecture & engineering jobs (actual): $80,250
- Median annual wage for all occupations (actual): $47,570
- Concentration of mechanical engineers (compared to average): +516.0%

Photo Credit: RCole3 / Shutterstock
6. Tucson, AZ
- Median annual wage for mechanical engineers (adjusted): $103,507
- Median annual wage for mechanical engineers (actual): $97,090
- Median annual wage for all architecture & engineering jobs (actual): $94,240
- Median annual wage for all occupations (actual): $38,050
- Concentration of mechanical engineers (compared to average): +119.0%

Photo Credit: Rudy Balasko / Shutterstock
5. Cincinnati, OH-KY-IN
- Median annual wage for mechanical engineers (adjusted): $104,096
- Median annual wage for mechanical engineers (actual): $97,330
- Median annual wage for all architecture & engineering jobs (actual): $79,140
- Median annual wage for all occupations (actual): $42,600
- Concentration of mechanical engineers (compared to average): +53.0%

Photo Credit: Pete Niesen / Shutterstock
4. San Francisco-Oakland-Berkeley, CA
- Median annual wage for mechanical engineers (adjusted): $104,693
- Median annual wage for mechanical engineers (actual): $122,910
- Median annual wage for all architecture & engineering jobs (actual): $102,730
- Median annual wage for all occupations (actual): $62,000
- Concentration of mechanical engineers (compared to average): -15.0%

Photo Credit: Chuck Wagner / Shutterstock
3. New Orleans-Metairie, LA
- Median annual wage for mechanical engineers (adjusted): $107,905
- Median annual wage for mechanical engineers (actual): $104,560
- Median annual wage for all architecture & engineering jobs (actual): $79,980
- Median annual wage for all occupations (actual): $38,060
- Concentration of mechanical engineers (compared to average): -64.0%

Photo Credit: Sundry Photography / Shutterstock
2. San Jose-Sunnyvale-Santa Clara, CA
- Median annual wage for mechanical engineers (adjusted): $114,817
- Median annual wage for mechanical engineers (actual): $128,710
- Median annual wage for all architecture & engineering jobs (actual): $128,560
- Median annual wage for all occupations (actual): $75,510
- Concentration of mechanical engineers (compared to average): +111.0%

Photo Credit: RaulCano / Shutterstock
1. Houston-The Woodlands-Sugar Land, TX
- Median annual wage for mechanical engineers (adjusted): $125,714
- Median annual wage for mechanical engineers (actual): $125,840
- Median annual wage for all architecture & engineering jobs (actual): $98,640
- Median annual wage for all occupations (actual): $44,630
- Concentration of mechanical engineers (compared to average): +48.0%
Detailed Findings & Methodology
The data used in this analysis is from the U.S. Bureau of Labor Statistics Occupational Employment and Wage Statistics and the U.S. Bureau of Economic Analysis Regional Price Parities datasets. To determine the best-paying locations for mechanical engineers, researchers calculated the median annual wage for mechanical engineers, adjusted for cost of living. In the event of a tie, the location with the greater median annual wage for mechanical engineers, not adjusted for cost of living, was ranked higher. To improve relevance, only metropolitan areas with at least 100,000 residents were included. Additionally, metros were grouped into cohorts based on population size: small (100,000-349,999), midsize (350,000-999,999), and large (1,000,000 or more). Note: only states and metropolitan areas with sufficient occupational and wage data were included.