Cities Where Housing Costs Have Risen Fastest Relative to Income
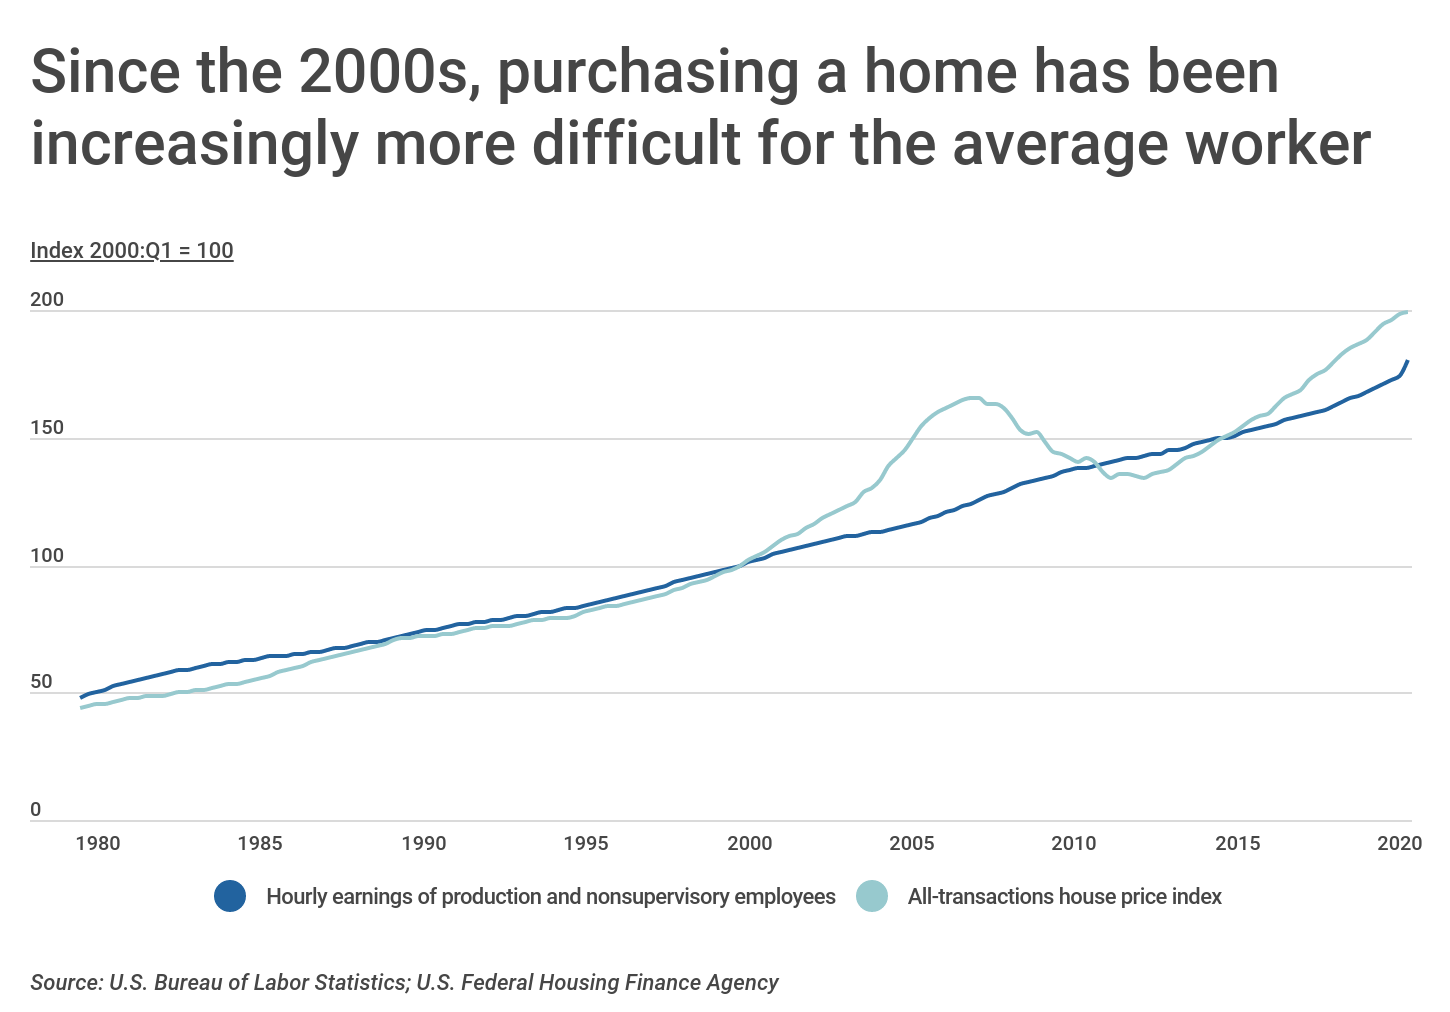
Despite decades of record-setting home sales, owning a home has become increasingly difficult for the average worker. Mortgage interest rates are historically low, yet hourly earnings have failed to keep pace with rising housing costs. Data from the federal government indicates that although earnings for production and nonsupervisory workers increased by approximately 80 percent between January 2000 and April 2020, housing costs have nearly doubled during the same period.
The rise in home prices over the past several years has occurred during a period of increased housing demand—driven by a growing economy and more millennial homebuyers—as well as a shortage of new, single-family homes available for purchase. Data from the U.S. Census Bureau indicates that new home construction has still not rebounded to pre-Great Recession levels. Recent housing supply data indicates ongoing shortages, with a 7.9 percent decrease in new single-family homes for sale between January and June 2020. The long-term increased demand for housing paired with a concurrent diminishing supply has contributed to the nation’s housing affordability crisis.
At the same time that home prices have gone up, wages for the average worker have failed to keep pace. Research from the Economic Policy Institute shows that while wages for high-income workers grew steadily since the 1980s, middle- and low-income workers have actually seen their wages stagnate or even decline after adjusting for inflation.
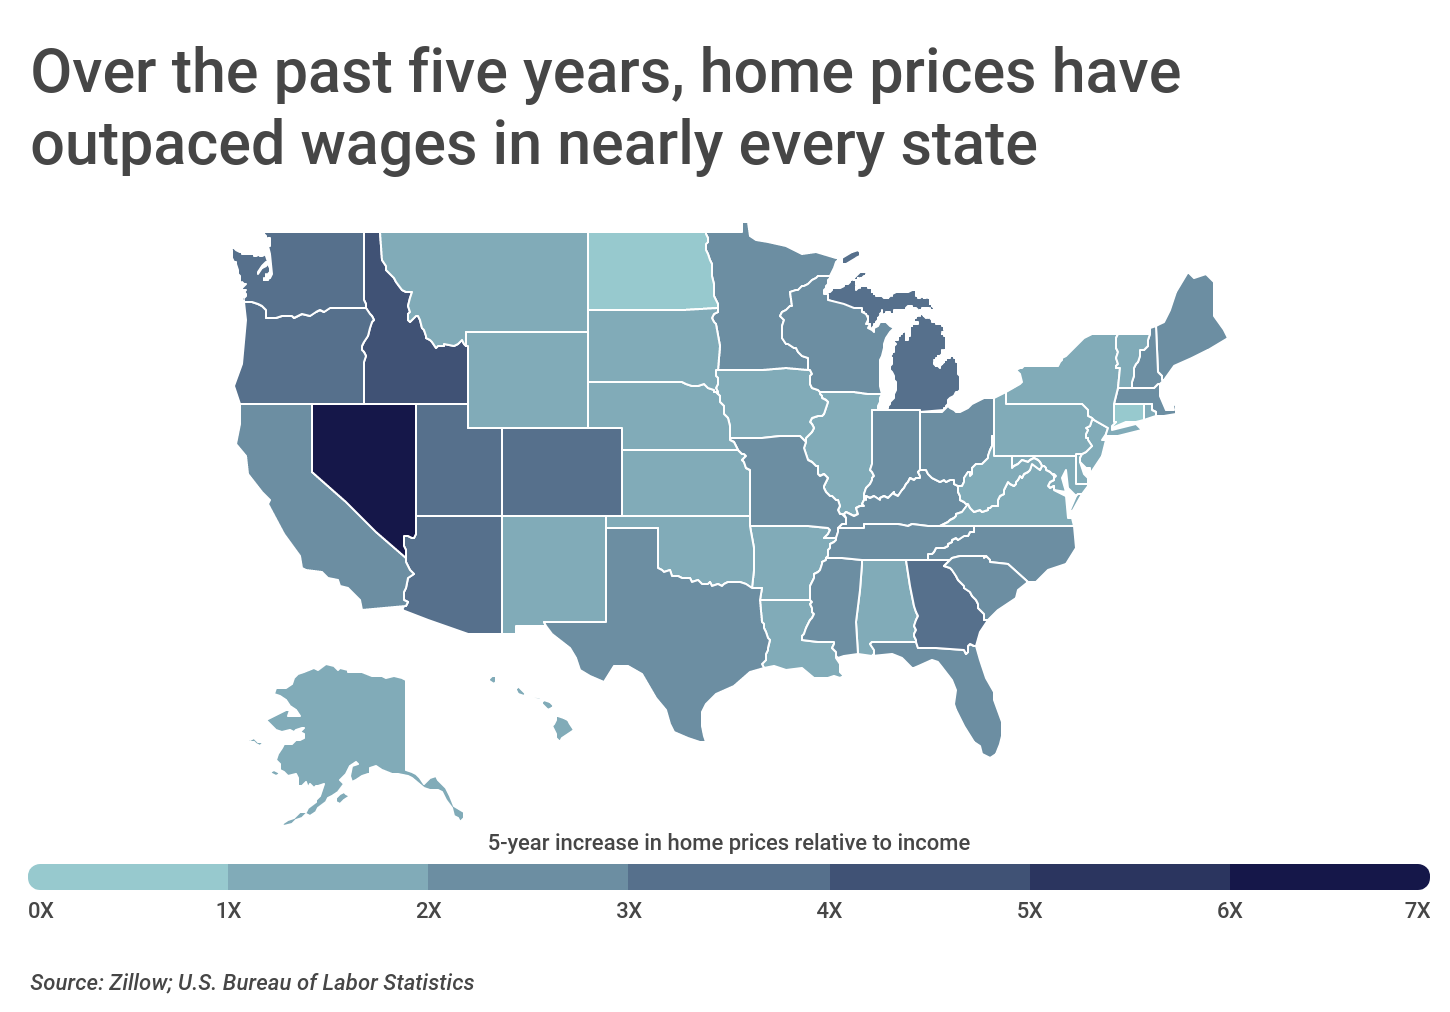
At the state level, the largest gaps between home price and income growth are found in Western states such as Nevada, Idaho, Utah, Oregon, Washington, Colorado, and Arizona. Home prices in these states outpaced wage growth by more than 3X between 2014 and 2019. In Midwest and East Coast states, home prices grew more slowly relative to income. In only three states, North Dakota, Connecticut and West Virginia, did income growth actually outpace home price growth over the past five years.
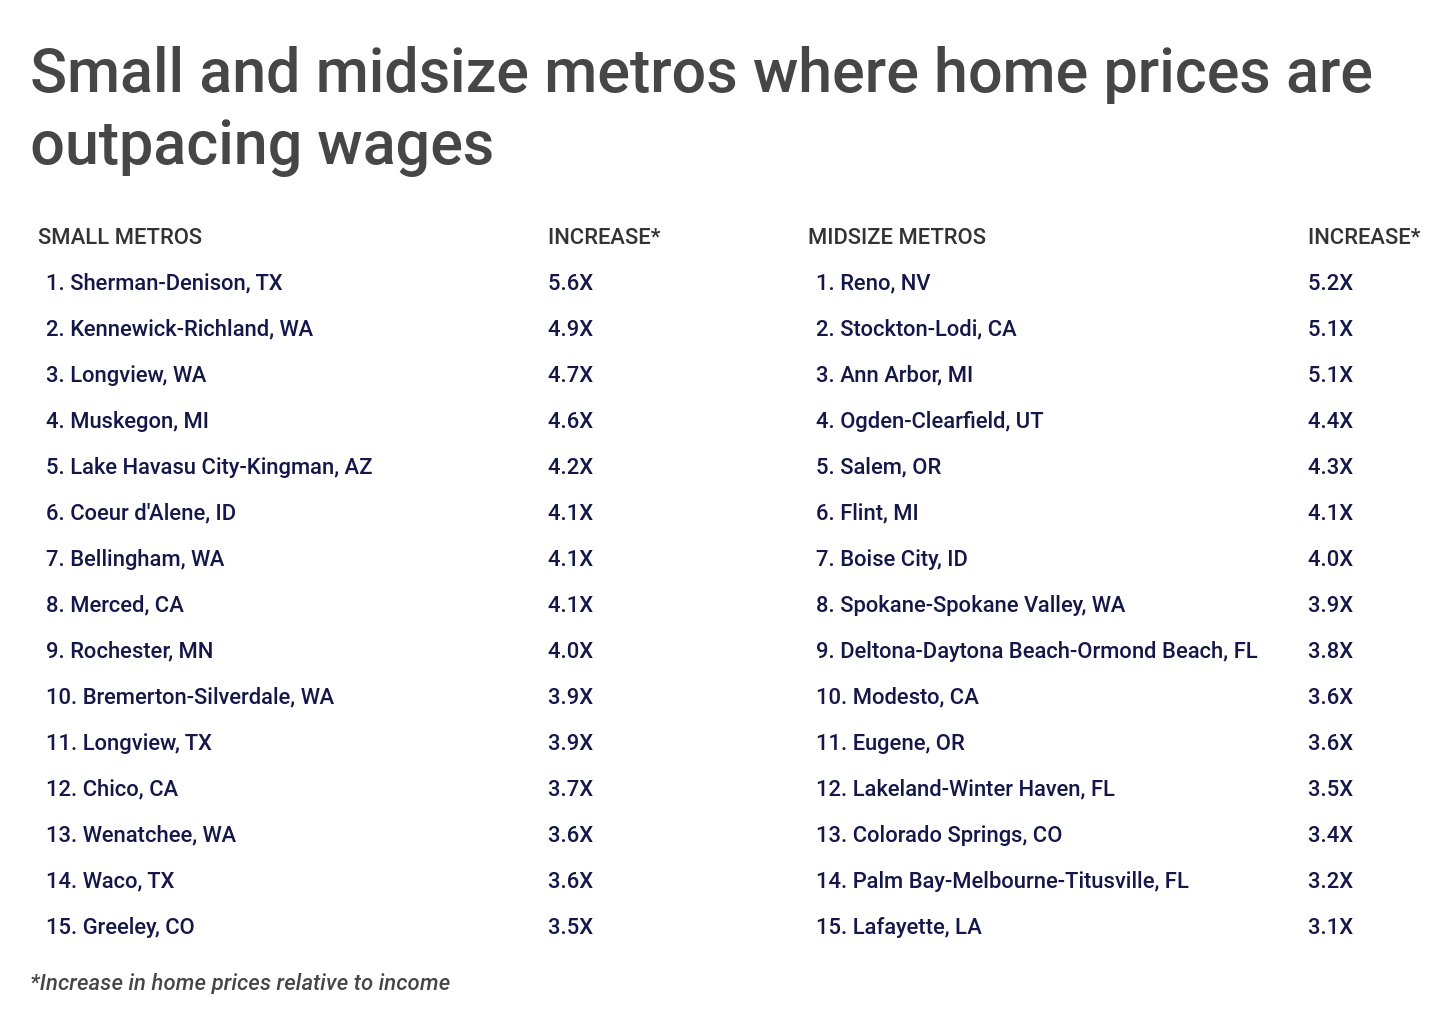
To identify metropolitan areas with the greatest rise in home prices relative to income, researchers at Construction Coverage, a review website for builders insurance and workers’ compensation insurance, analyzed data from Zillow and the U.S. Bureau of Labor Statistics. For each metro, the percentage change in home price between 2014 and 2019 was divided by the percentage change in median wage during the same time period.
Consistent with state-level trends, the metros with the largest increases in home prices relative to income are concentrated in Western states. Northeastern metropolitan areas are notably absent from the list, indicating that incomes have better kept pace with home prices in those locations. Astonishingly, home prices have outpaced income in nearly 90 percent of U.S. metropolitan areas with at least 100,000 residents.
Here are the metros with the largest increases in home prices relative to income.
Large metros where home prices are outpacing wages

Photo Credit: Alamy Stock Photo
15. Jacksonville, FL
- Increase in home prices relative to income: 3.1X
- 5-year percentage change in home prices: 36.4%
- 5-year percentage change in wages: 11.6%
- Median home price (2019): $228,585
- Median annual wage (2019): $36,770

Photo Credit: Alamy Stock Photo
14. Phoenix-Mesa-Scottsdale, AZ
- Increase in home prices relative to income: 3.1X
- 5-year percentage change in home prices: 37.5%
- 5-year percentage change in wages: 12.1%
- Median home price (2019): $279,459
- Median annual wage (2019): $39,420

Photo Credit: Alamy Stock Photo
13. Columbus, OH
- Increase in home prices relative to income: 3.1X
- 5-year percentage change in home prices: 38.4%
- 5-year percentage change in wages: 12.2%
- Median home price (2019): $206,561
- Median annual wage (2019): $40,380

Photo Credit: Alamy Stock Photo
12. Kansas City, MO-KS
- Increase in home prices relative to income: 3.2X
- 5-year percentage change in home prices: 36.4%
- 5-year percentage change in wages: 11.3%
- Median home price (2019): $201,466
- Median annual wage (2019): $40,640

Photo Credit: Alamy Stock Photo
11. Grand Rapids-Wyoming, MI
- Increase in home prices relative to income: 3.3X
- 5-year percentage change in home prices: 47.1%
- 5-year percentage change in wages: 14.3%
- Median home price (2019): $214,581
- Median annual wage (2019): $37,410

Photo Credit: Alamy Stock Photo
10. Tampa-St. Petersburg-Clearwater, FL
- Increase in home prices relative to income: 3.5X
- 5-year percentage change in home prices: 48.9%
- 5-year percentage change in wages: 13.8%
- Median home price (2019): $224,850
- Median annual wage (2019): $37,170

Photo Credit: Alamy Stock Photo
9. Detroit-Warren-Dearborn, MI
- Increase in home prices relative to income: 3.6X
- 5-year percentage change in home prices: 41.8%
- 5-year percentage change in wages: 11.7%
- Median home price (2019): $179,796
- Median annual wage (2019): $41,620

Photo Credit: Alamy Stock Photo
8. Atlanta-Sandy Springs-Roswell, GA
- Increase in home prices relative to income: 3.6X
- 5-year percentage change in home prices: 42.4%
- 5-year percentage change in wages: 11.7%
- Median home price (2019): $236,369
- Median annual wage (2019): $40,000

Photo Credit: Alamy Stock Photo
7. Nashville-Davidson–Murfreesboro–Franklin, TN
- Increase in home prices relative to income: 3.6X
- 5-year percentage change in home prices: 48.8%
- 5-year percentage change in wages: 13.6%
- Median home price (2019): $273,539
- Median annual wage (2019): $38,900

Photo Credit: Alamy Stock Photo
6. Dallas-Fort Worth-Arlington, TX
- Increase in home prices relative to income: 3.7X
- 5-year percentage change in home prices: 50.4%
- 5-year percentage change in wages: 13.5%
- Median home price (2019): $250,511
- Median annual wage (2019): $40,430

Photo Credit: Alamy Stock Photo
5. Sacramento–Roseville–Arden-Arcade, CA
- Increase in home prices relative to income: 3.8X
- 5-year percentage change in home prices: 35.2%
- 5-year percentage change in wages: 9.4%
- Median home price (2019): $419,012
- Median annual wage (2019): $44,590

Photo Credit: Alamy Stock Photo
4. Salt Lake City, UT
- Increase in home prices relative to income: 3.9X
- 5-year percentage change in home prices: 46.9%
- 5-year percentage change in wages: 12.1%
- Median home price (2019): $372,843
- Median annual wage (2019): $40,120

Photo Credit: Alamy Stock Photo
3. San Jose-Sunnyvale-Santa Clara, CA
- Increase in home prices relative to income: 4.6X
- 5-year percentage change in home prices: 36.3%
- 5-year percentage change in wages: 7.9%
- Median home price (2019): $1,149,093
- Median annual wage (2019): $61,980

Photo Credit: Alamy Stock Photo
2. Charlotte-Concord-Gastonia, NC-SC
- Increase in home prices relative to income: 4.6X
- 5-year percentage change in home prices: 40.3%
- 5-year percentage change in wages: 8.7%
- Median home price (2019): $230,443
- Median annual wage (2019): $39,230

Photo Credit: Alamy Stock Photo
1. Las Vegas-Henderson-Paradise, NV
- Increase in home prices relative to income: 6.8X
- 5-year percentage change in home prices: 51.0%
- 5-year percentage change in wages: 7.5%
- Median home price (2019): $289,885
- Median annual wage (2019): $35,660
Methodology & detailed findings
Home price statistics are from the Zillow Home Value Index, which includes all single-family residences, condos, and co-ops. Wage statistics are from the U.S. Bureau of Labor Statistics Occupational Employment Survey, which includes all full-time and part-time wage and salary workers in nonfarm establishments. The data do not include self-employed workers, owners and partners in unincorporated firms, household workers, or unpaid family workers.
To identify metros with the largest increase in home prices relative to income over the past five years, researchers calculated the percentage change in home prices and the percentage change in median annual wages between 2014 and 2019. The percentage change in home price was then divided by the percentage change in wages. Locations were ordered by the resulting statistic. In the event of a tie, locations with the larger percentage increase in home price were ranked higher.
Only metro areas with at least 100,000 residents and data available from both data sources were included in the analysis. Additionally, metro areas were grouped into cohorts based on population size:
- Small (100,000-349,999)
- Midsize (350,000-999,999)
- Large (1,000,000 or more)