
U.S. Cities Where Manufacturing Is Thriving [2022 Edition]
The health of the manufacturing sector in the U.S. has been a major focus of public attention in recent years. With populist political figures like Donald Trump on the right and Bernie Sanders on the left offering critiques of U.S. trade policy and debating how best to assist American manufacturers and workers, policymakers and economic leaders of all stripes have put new focus on support for manufacturing. From former President Trump’s focus on trade policy and President Biden’s $1.2 trillion bipartisan infrastructure bill to companies “reshoring” plants and consumers expressing preferences for American-made goods, combatting the apparent decline of U.S. manufacturing has become a shared commitment.
Manufacturing is important to the U.S. economy for several reasons. Manufacturing jobs have historically been a pathway to the middle class, offering good pay without requiring high levels of education. Companies that rely on manufacturing invest heavily in research and development, which helps drive innovation. Domestic manufacturing also contributes to more secure and resilient supply chains—a point that has become clear during the COVID-19 pandemic.
But in recent decades, the role of manufacturing in the U.S. economy has been diminished. Many companies began moving factories abroad in search of lower costs and better profit margins. Trade deals like NAFTA reduced the cost of foreign imports, giving U.S. producers more competitors. Technological advances made manufacturing processes more efficient, which reduced the need for many manufacturing jobs.
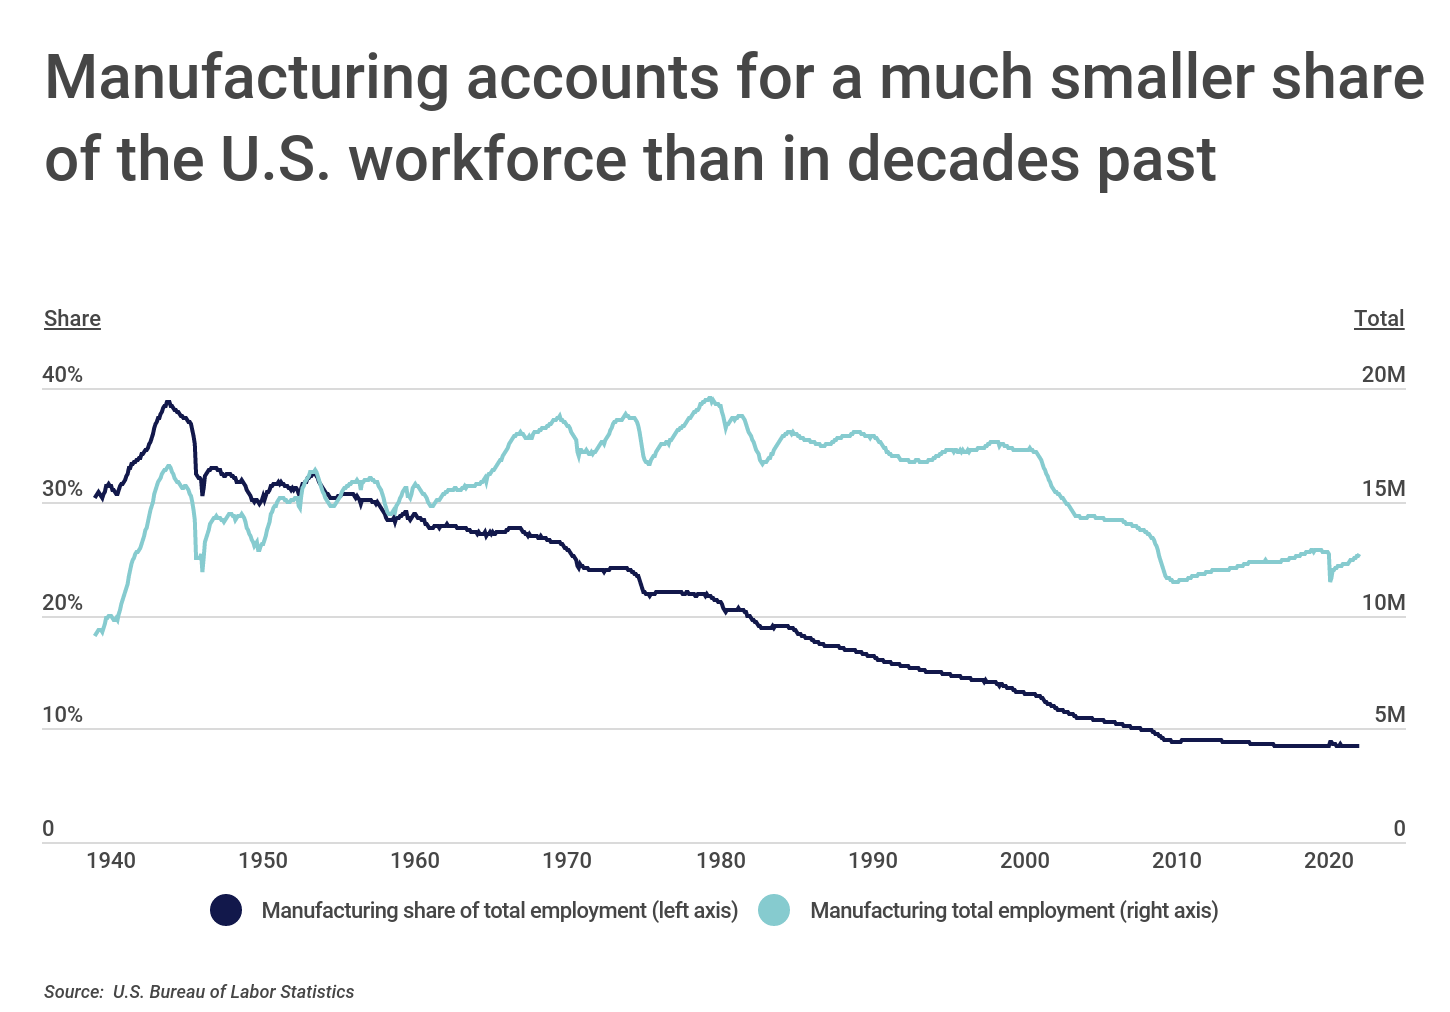
The effects of these shifts in manufacturing are most apparent in employment, which has decreased over the years as a share of overall employment and in total numbers. After manufacturing peaked near 40% of U.S. jobs at the height of World War II, the sector has seen a steady decline over time, to around 8.4% of employment today. In total employment, manufacturing jobs peaked at 19.5 million in the late 1970s and fell off sharply after 2000 to just 12.6 million today.
RELATED
The manufacturing sector has one of the highest rates of work-related injuries. Workers’ compensation insurance will provide coverage should a worker get hurt on the job.
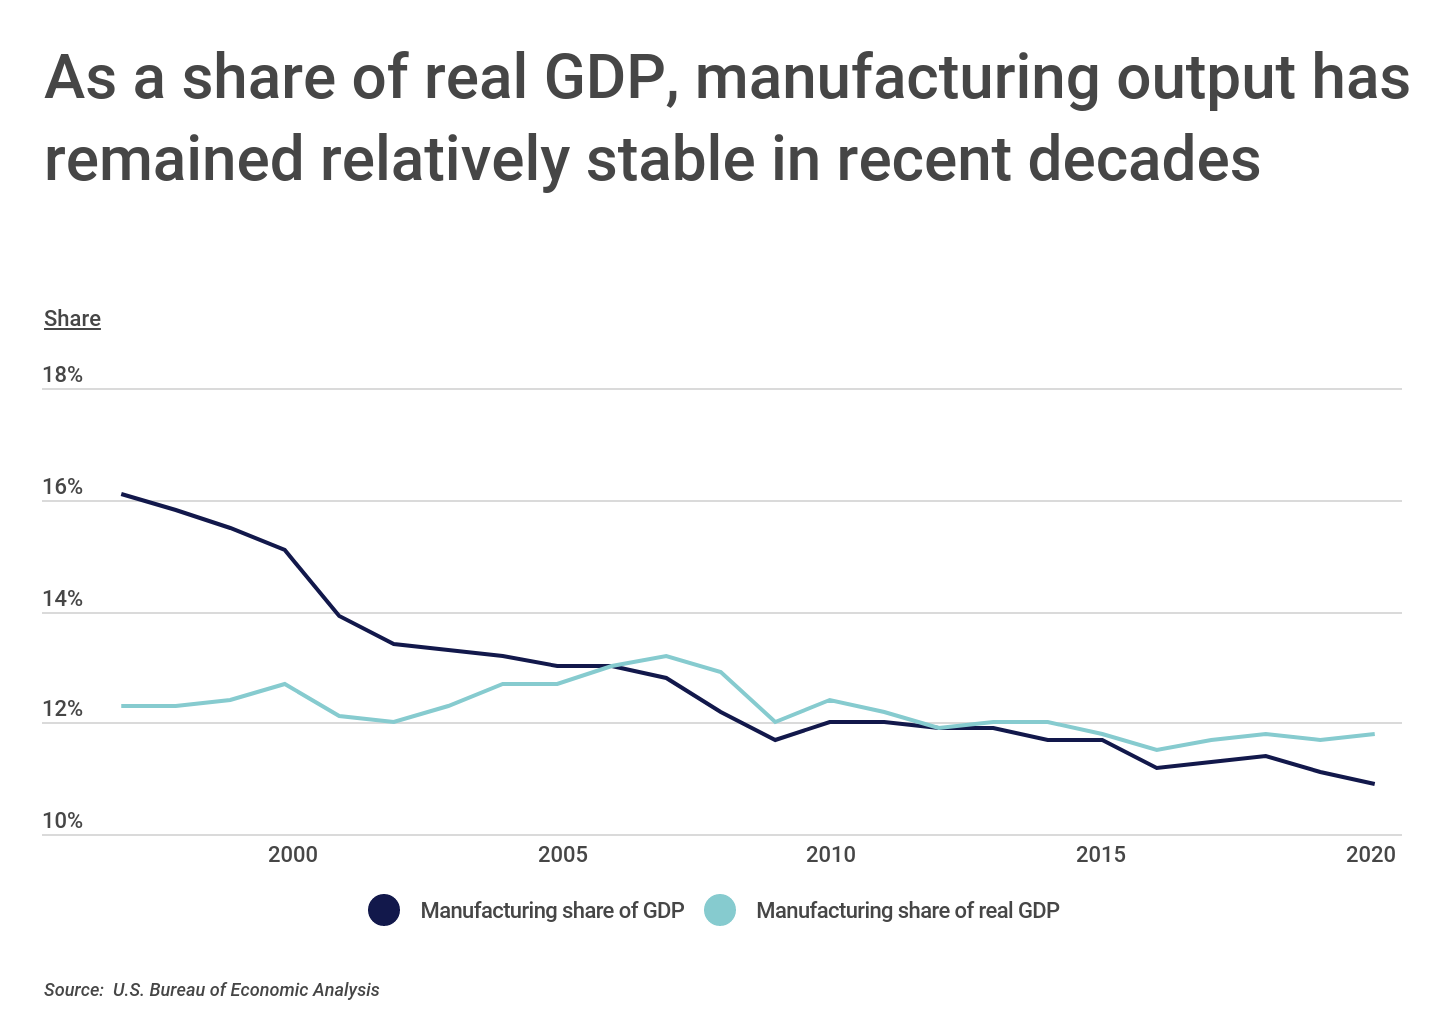
But despite the decrease in manufacturing employment over the past several decades, manufacturing output as a share of real GDP has stayed relatively stable. Since 1997, manufacturing has fluctuated between 11.5% and 13.2% of GDP, after adjusting for inflation. While manufacturing output as a share of nominal GDP has declined over that span (from 16.2% to 10.9%), the change in the nominal figures reflects both growth in other sectors as well as slower price increases for manufactured goods more so than a decline in manufacturing productivity.
RELATED
Manufacturing facilities house millions of dollars in equipment and materials. Having a comprehensive commercial property insurance policy is critical for companies operating manufacturing plants.
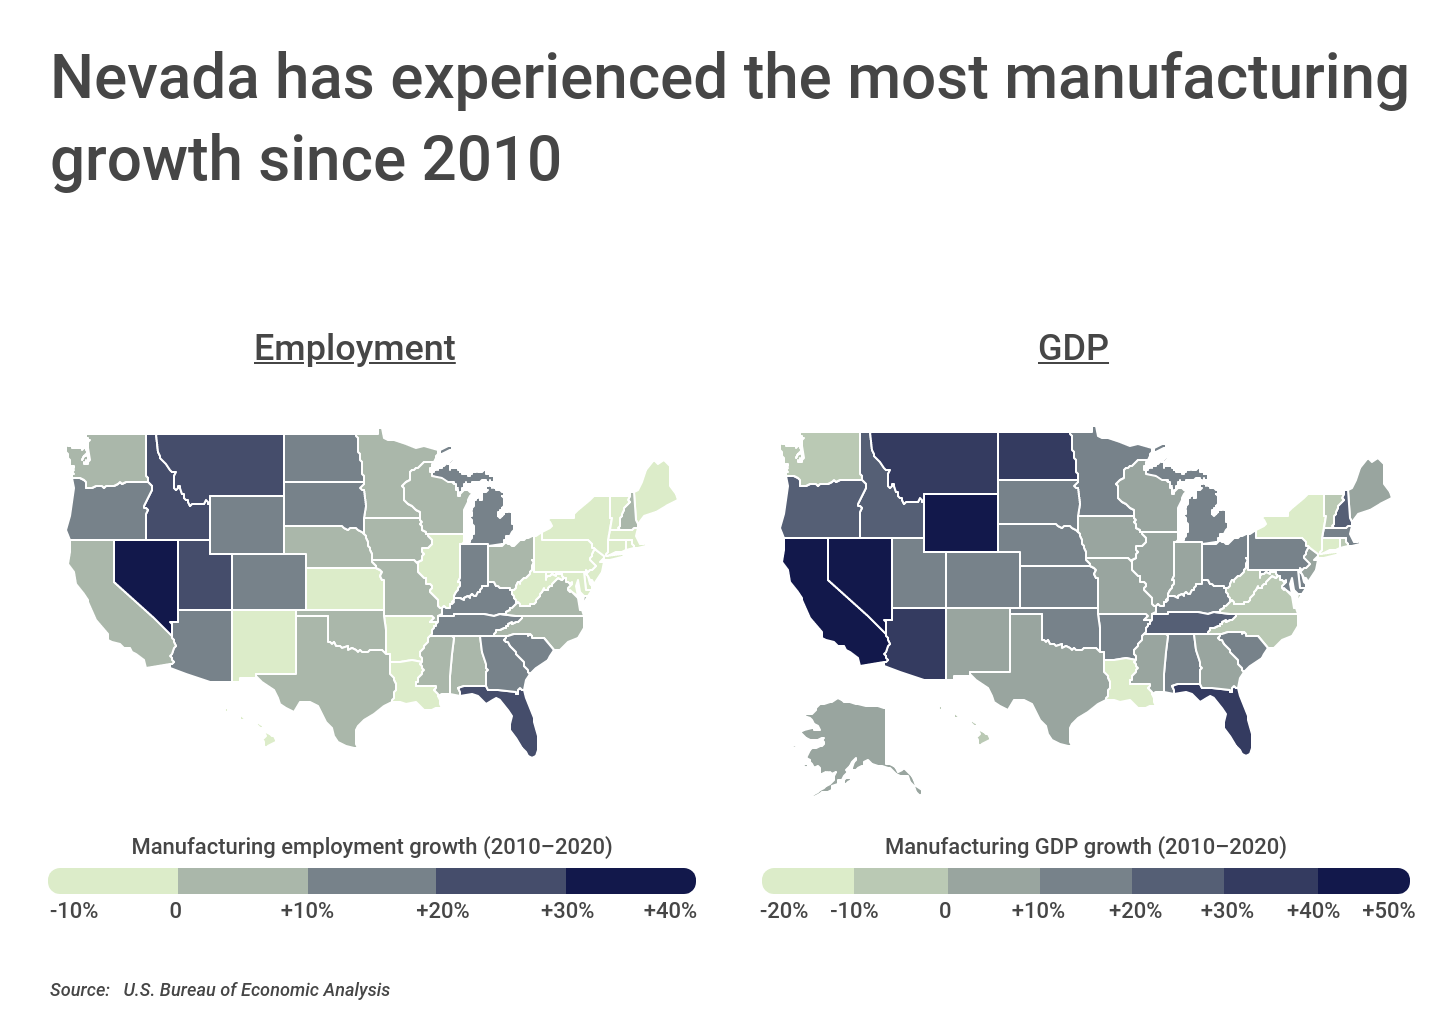
But one important piece of the conversation around manufacturing in the U.S. is where manufacturing is thriving. Many Northern states that were major U.S. manufacturing centers historically, including New York and Pennsylvania, have seen lower rates of growth in employment and output from manufacturing in recent years. Instead, many of the states with the highest recent growth in manufacturing—both for employment and GDP—are found in the southern and western U.S.
Nevada has seen nearly 50% growth in both manufacturing employment and GDP from 2010 to 2020, while California has had a 45.6% increase in GDP and Florida saw a manufacturing GDP increase of 35.5%. At the metro level, many of the top locations for manufacturing currently are also found in these states, though a few Rust Belt metros have also enjoyed a resurgence in manufacturing.
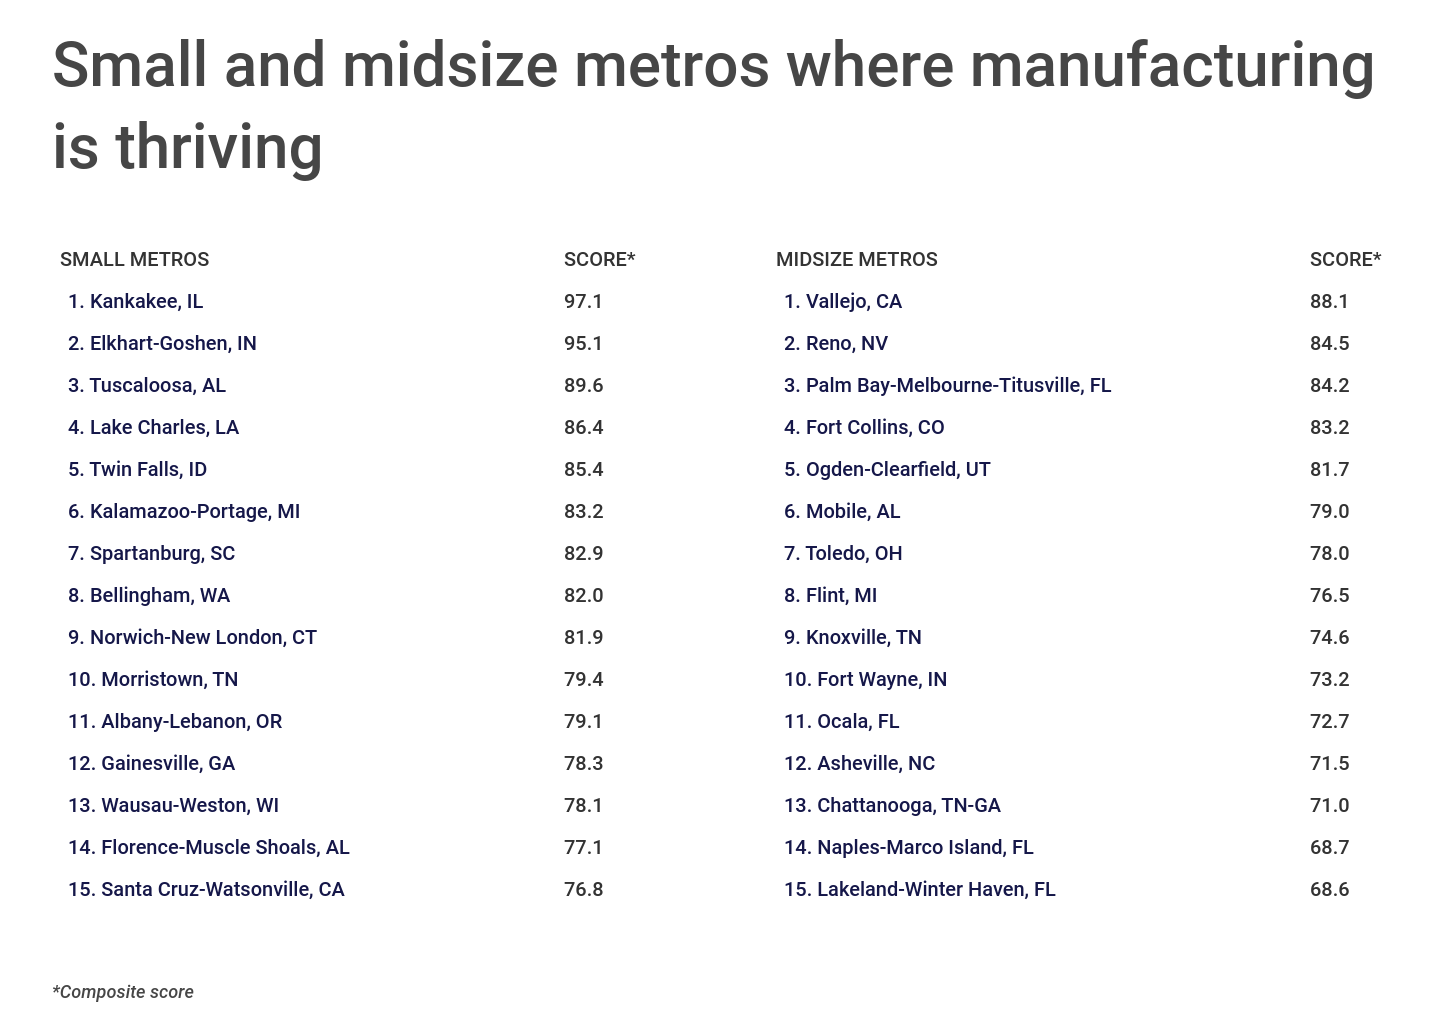
The data used in this analysis is from the U.S. Bureau of Economic Analysis. To determine the locations where manufacturing is thriving, researchers at Construction Coverage calculated a composite score based on the following factors and weights:
- Manufacturing employment growth from 2010 to 2020 (2X)
- Manufacturing GDP growth from 2010 to 2020 (2X)
- Manufacturing share of total employment in 2020 (1X)
- Manufacturing share of total GDP in 2020 (1X)
In the event of a tie, the location with the greater manufacturing employment growth from 2010 to 2020 was ranked higher. To improve relevance, only metropolitan areas with at least 100,000 residents were included. Additionally, metros were grouped into cohorts based on population size.
Here are the U.S. metropolitan areas where manufacturing is thriving.
Large Metros Where Manufacturing Is Thriving

Photo Credit: Kevin J King / Shutterstock
15. Tampa-St. Petersburg-Clearwater, FL
- Composite score: 59.2
- Manufacturing employment growth (2010-2020): +16.5%
- Manufacturing GDP growth (2010-2020): +48.1%
- Manufacturing share of total employment (2020): 4.0%
- Manufacturing share of total GDP (2020): 7.7%
RELATED
Commercial trucking insurance will provide coverage for goods being transported from manufacturing facilities to distribution centers.
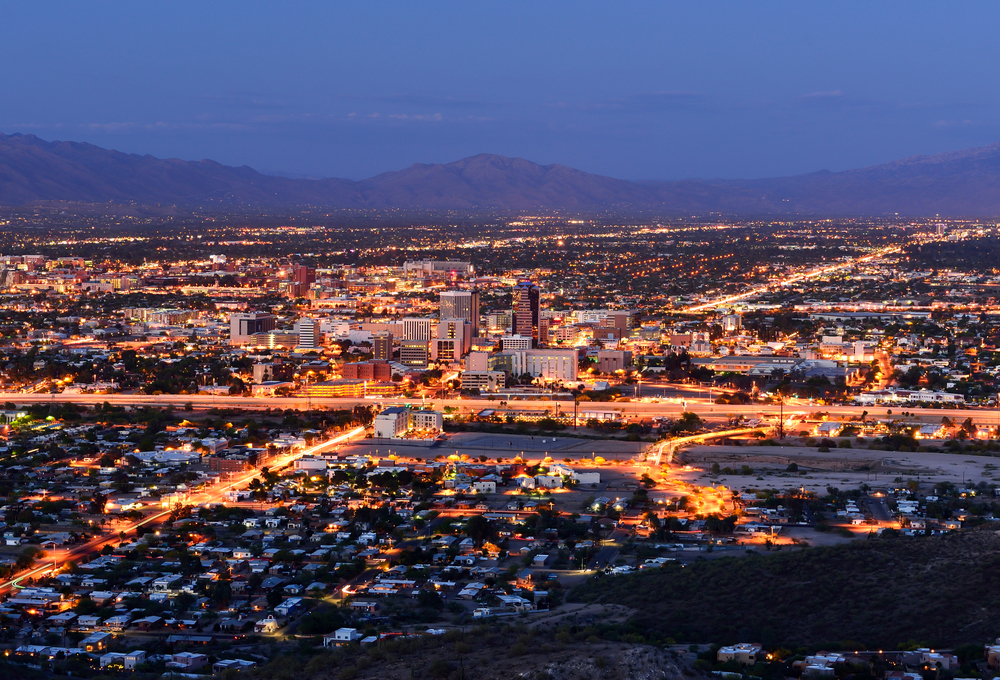
Photo Credit: RCole3 / Shutterstock
14. Tucson, AZ
- Composite score: 59.4
- Manufacturing employment growth (2010-2020): +13.9%
- Manufacturing GDP growth (2010-2020): +28.4%
- Manufacturing share of total employment (2020): 5.7%
- Manufacturing share of total GDP (2020): 12.6%

Photo Credit: Songquan Deng / Shutterstock
13. Orlando-Kissimmee-Sanford, FL
- Composite score: 60.9
- Manufacturing employment growth (2010-2020): +33.5%
- Manufacturing GDP growth (2010-2020): +36.1%
- Manufacturing share of total employment (2020): 3.3%
- Manufacturing share of total GDP (2020): 4.9%

Photo Credit: f11photo / Shutterstock
12. San Antonio-New Braunfels, TX
- Composite score: 62.4
- Manufacturing employment growth (2010-2020): +13.7%
- Manufacturing GDP growth (2010-2020): +128.4%
- Manufacturing share of total employment (2020): 3.8%
- Manufacturing share of total GDP (2020): 9.5%

Photo Credit: ShengYing Lin / Shutterstock
11. Austin-Round Rock-Georgetown, TX
- Composite score: 62.6
- Manufacturing employment growth (2010-2020): +30.9%
- Manufacturing GDP growth (2010-2020): +21.9%
- Manufacturing share of total employment (2020): 4.5%
- Manufacturing share of total GDP (2020): 11.2%

Photo Credit: Sean Pavone / Shutterstock
10. Tulsa, OK
- Composite score: 63.7
- Manufacturing employment growth (2010-2020): +16.8%
- Manufacturing GDP growth (2010-2020): +20.5%
- Manufacturing share of total employment (2020): 9.1%
- Manufacturing share of total GDP (2020): 13.3%

Photo Credit: Sean Pavone / Shutterstock
9. Phoenix-Mesa-Chandler, AZ
- Composite score: 64.2
- Manufacturing employment growth (2010-2020): +22.2%
- Manufacturing GDP growth (2010-2020): +37.2%
- Manufacturing share of total employment (2020): 5.1%
- Manufacturing share of total GDP (2020): 9.6%

Photo Credit: Sean Pavone / Shutterstock
8. Raleigh-Cary, NC
- Composite score: 64.2
- Manufacturing employment growth (2010-2020): +14.4%
- Manufacturing GDP growth (2010-2020): +56.8%
- Manufacturing share of total employment (2020): 3.8%
- Manufacturing share of total GDP (2020): 15.1%

Photo Credit: Bob Pool / Shutterstock
7. Portland-Vancouver-Hillsboro, OR-WA
- Composite score: 67.2
- Manufacturing employment growth (2010-2020): +14.1%
- Manufacturing GDP growth (2010-2020): +28.8%
- Manufacturing share of total employment (2020): 8.5%
- Manufacturing share of total GDP (2020): 17.8%

Photo Credit: Mihai_Andritoiu / Shutterstock
6. Nashville-Davidson–Murfreesboro–Franklin, TN
- Composite score: 68.7
- Manufacturing employment growth (2010-2020): +22.6%
- Manufacturing GDP growth (2010-2020): +44.8%
- Manufacturing share of total employment (2020): 6.1%
- Manufacturing share of total GDP (2020): 10.3%

Photo Credit: Radoslaw Lecyk / Shutterstock
5. San Francisco-Oakland-Berkeley, CA
- Composite score: 70.0
- Manufacturing employment growth (2010-2020): +19.0%
- Manufacturing GDP growth (2010-2020): +65.2%
- Manufacturing share of total employment (2020): 4.8%
- Manufacturing share of total GDP (2020): 15.5%
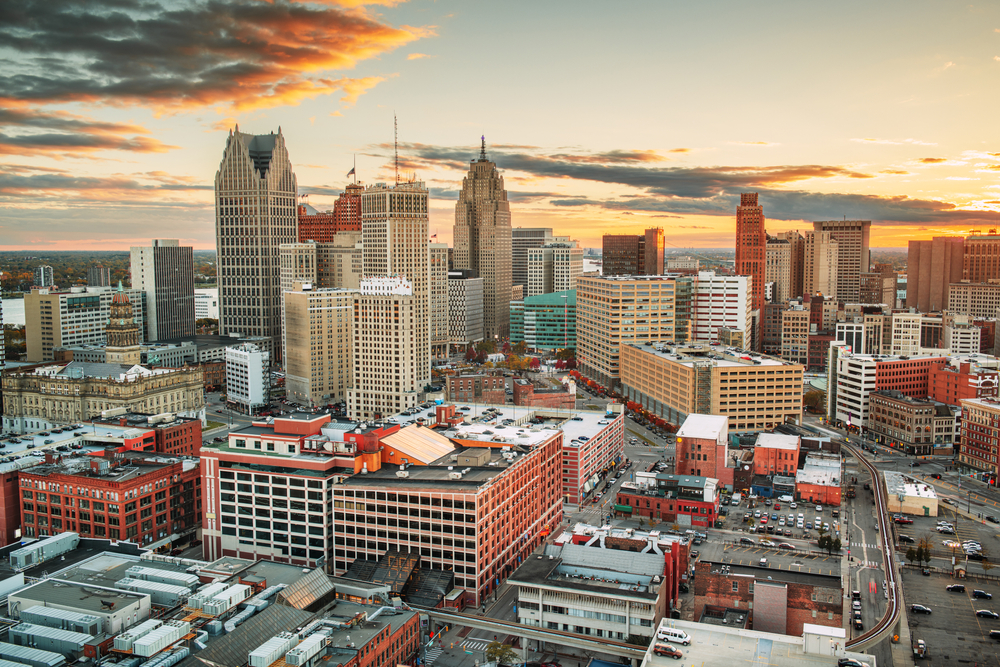
Photo Credit: Sean Pavone / Shutterstock
4. Detroit-Warren-Dearborn, MI
- Composite score: 70.7
- Manufacturing employment growth (2010-2020): +22.9%
- Manufacturing GDP growth (2010-2020): +20.3%
- Manufacturing share of total employment (2020): 9.7%
- Manufacturing share of total GDP (2020): 17.0%

Photo Credit: Sean Pavone / Shutterstock
3. San Diego-Chula Vista-Carlsbad, CA
- Composite score: 70.9
- Manufacturing employment growth (2010-2020): +21.5%
- Manufacturing GDP growth (2010-2020): +58.6%
- Manufacturing share of total employment (2020): 6.1%
- Manufacturing share of total GDP (2020): 11.8%
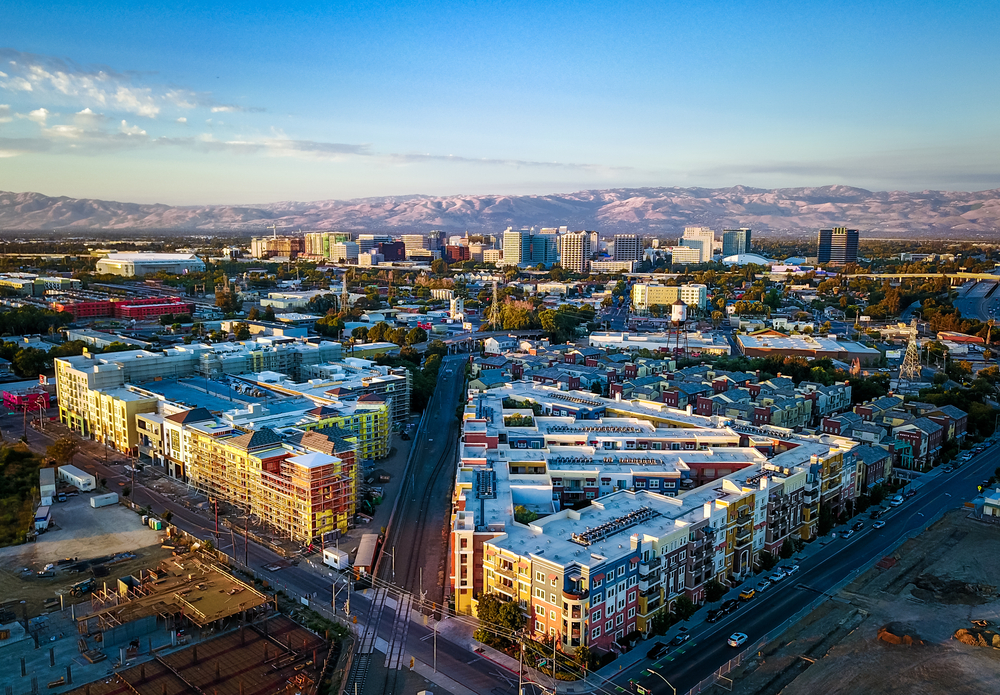
Photo Credit: Uladzik Kryhin / Shutterstock
2. San Jose-Sunnyvale-Santa Clara, CA
- Composite score: 77.4
- Manufacturing employment growth (2010-2020): +9.8%
- Manufacturing GDP growth (2010-2020): +94.6%
- Manufacturing share of total employment (2020): 12.6%
- Manufacturing share of total GDP (2020): 24.2%
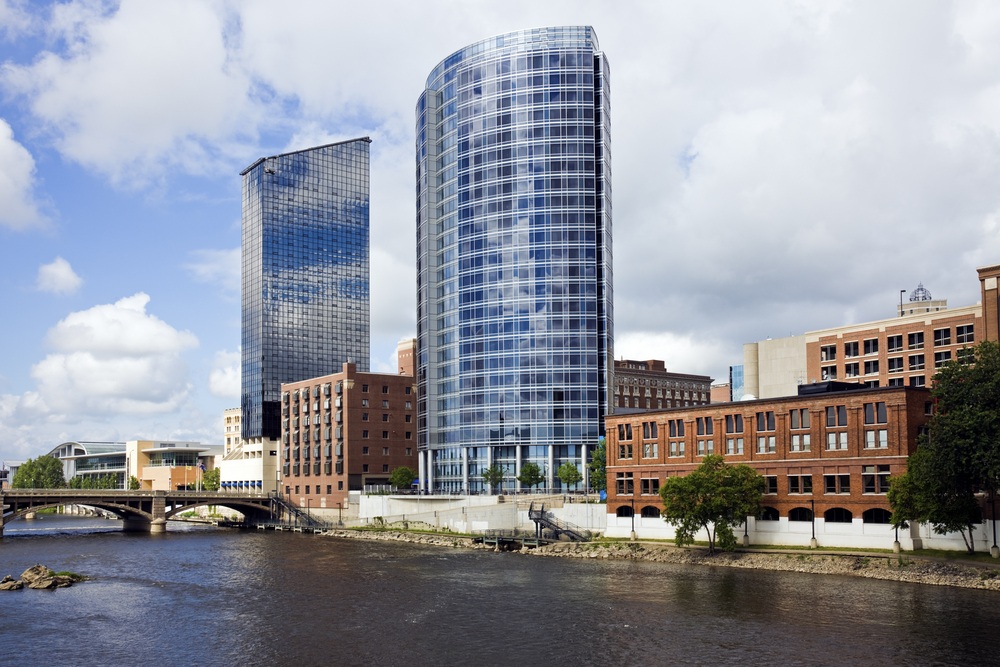
Photo Credit: Henryk Sadura / Shutterstock
1. Grand Rapids-Kentwood, MI
- Composite score: 79.6
- Manufacturing employment growth (2010-2020): +28.1%
- Manufacturing GDP growth (2010-2020): +20.3%
- Manufacturing share of total employment (2020): 16.5%
- Manufacturing share of total GDP (2020): 24.2%
Detailed Findings & Methodology
The data used in this analysis is from the U.S. Bureau of Economic Analysis’s GDP & Employment data. To determine the locations where manufacturing is thriving, researchers calculated a composite score based on the following factors and weights:
- Manufacturing employment growth from 2010 to 2020 (2X)
- Manufacturing GDP growth from 2010 to 2020 (2X)
- Manufacturing share of total employment in 2020 (1X)
- Manufacturing share of total GDP in 2020 (1X)
To improve relevance, only metropolitan areas with at least 100,000 residents were included. Additionally, metros were grouped into cohorts based on population size: small (100,000-349,999), midsize (350,000-999,999), and large (1,000,000 or more).