Cities With the Biggest Change in Rent Prices
Note: This is the most recent release of our Cities With the Biggest Change in Rent Prices study. To see data from previous years, please visit the Full Results section below.
In recent months, the dour outlook on the U.S. economy has begun to shift. Economic growth, consumer spending, and employment rates have remained strong despite widespread expectations of a recession in 2023. The Federal Reserve has begun to signal that interest rate cuts are on the horizon in 2024. And perhaps most importantly in consumers’ minds, the pace of inflation has been falling back to historically normal levels after reaching a peak in mid-2022.
One area where many Americans continue to struggle, however, is the cost of housing. Increased rents have been one of the persistent factors underlying the price increases of the last two years, as a major component in several common measures of inflation. With high home prices and mortgage interest rates pricing many would-be buyers out of the residential real estate market, rentals have been highly competitive.
Underlying these trends is a long-term shortage of housing stock in the United States. Many builders were hard-hit by the Great Recession, and as a result, the U.S. dramatically underbuilt its housing stock throughout the 2010s. Renters are feeling the consequences: rental vacancy rates are at their lowest level on record. In short, this means that more renters are competing for fewer available units.
Change in Rent From the Year Prior
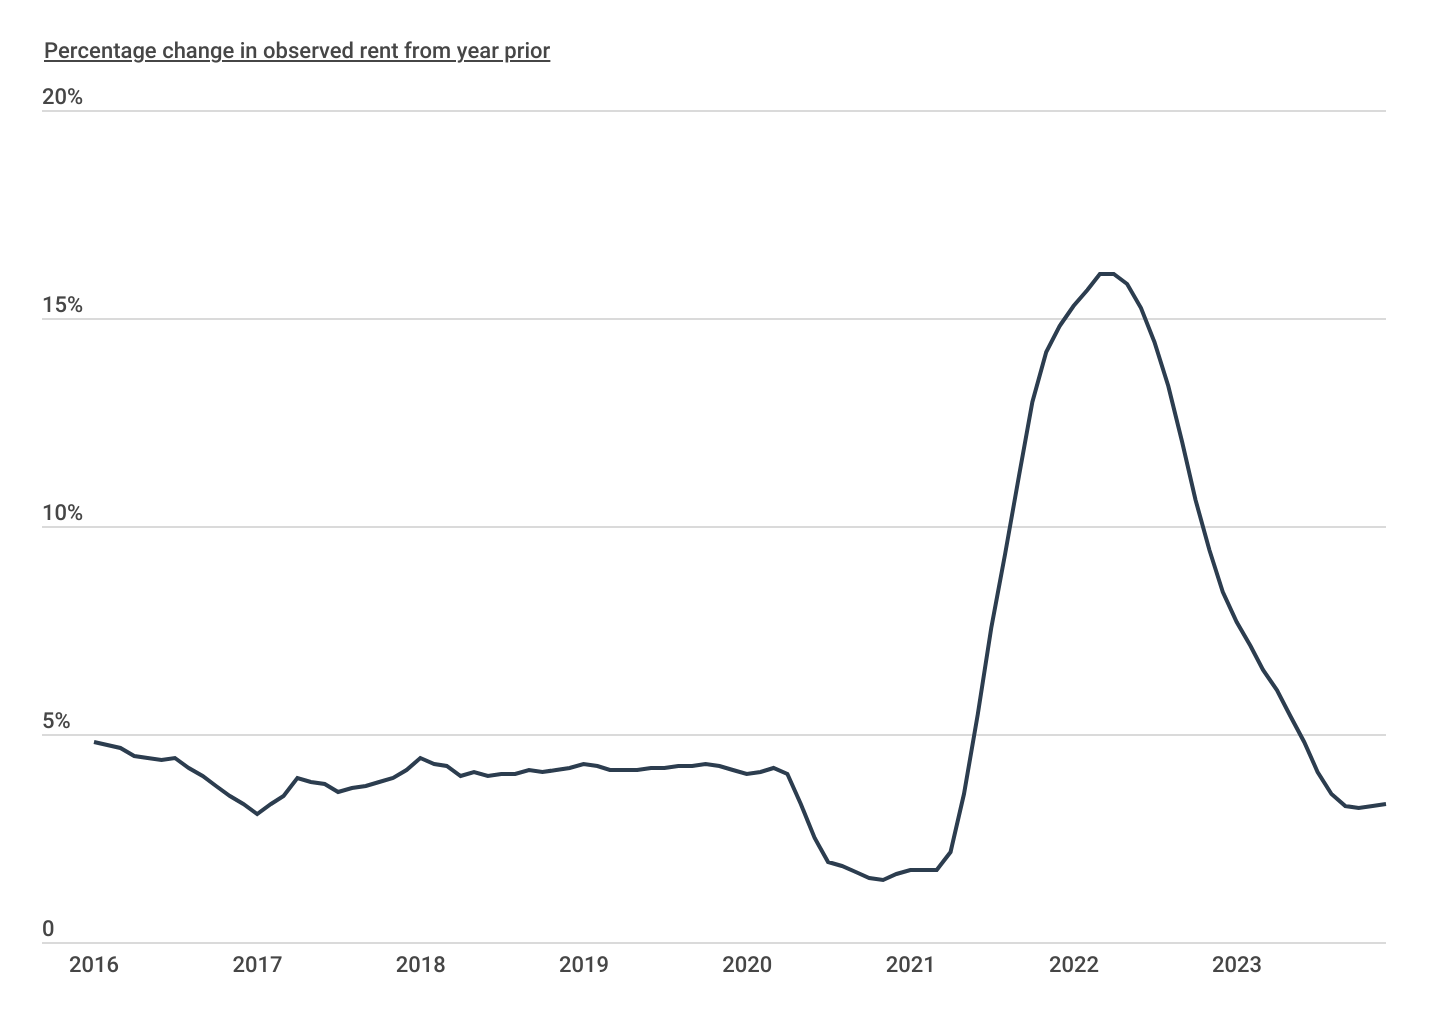
Rent price growth is showing signs of acceleration after slowing back down to pre-pandemic norms

The long-term supply challenges around housing stock came to a head during the COVID-19 pandemic. Government stimulus and renter protection programs helped keep rents low during the early months of the pandemic, but rent growth began to spike in early 2021. According to data from Zillow’s Observed Rent Index, year-over-year rent growth exploded from just under 2% in February 2021 to over 16% in February 2022. The rate of growth fell back to pre-pandemic levels earlier in 2023, but over the last few months of the year, the year-to-year change in rents began to tick up yet again. And while rates of growth have slowed, overall price growth has continued.
Rent Increase by Rental Size
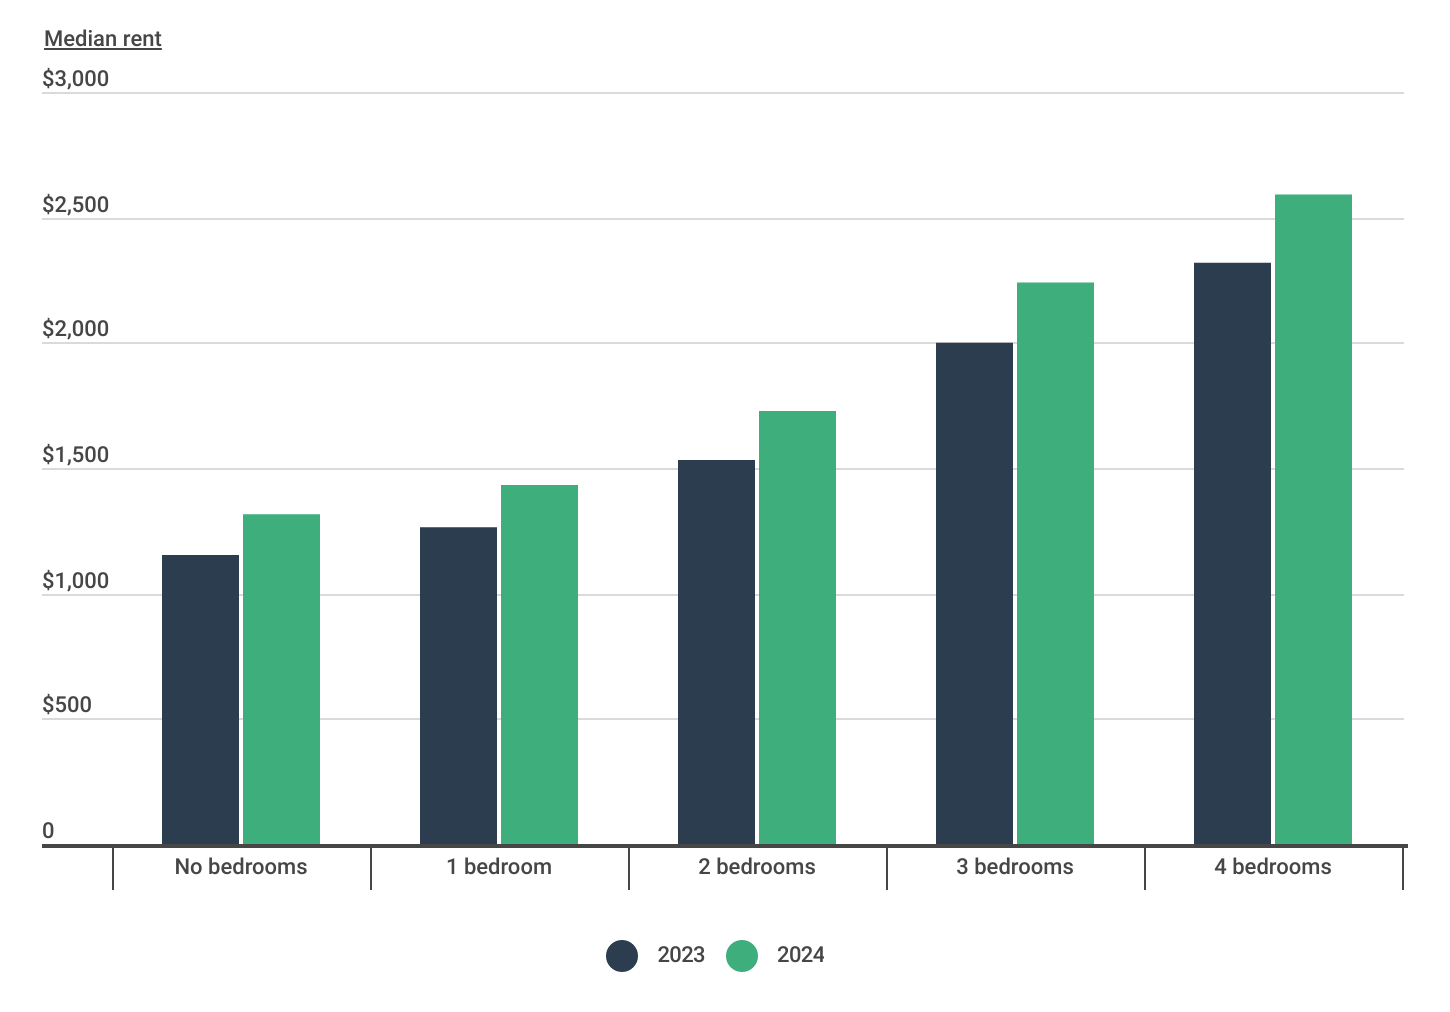
Median rent increased consistently across all rental sizes

Over the last year, no part of the rental market has been able to avoid continued price increases. From studio apartments to large homes, rental units of all sizes have seen similarly-sized increases in median rents. According to HUD data, median rents across the board have increased by double-digit percentages from 2023 to 2024.
FOR LANDLORDS
Landlord insurance is a type of commercial property insurance that helps protect landlords from financial losses related to their rental properties. Landlord insurance can cover damages to the property, loss of rental income if the property becomes uninhabitable, and liability for injuries or damages sustained by tenants.
Geographic Differences in Median Rent Increases
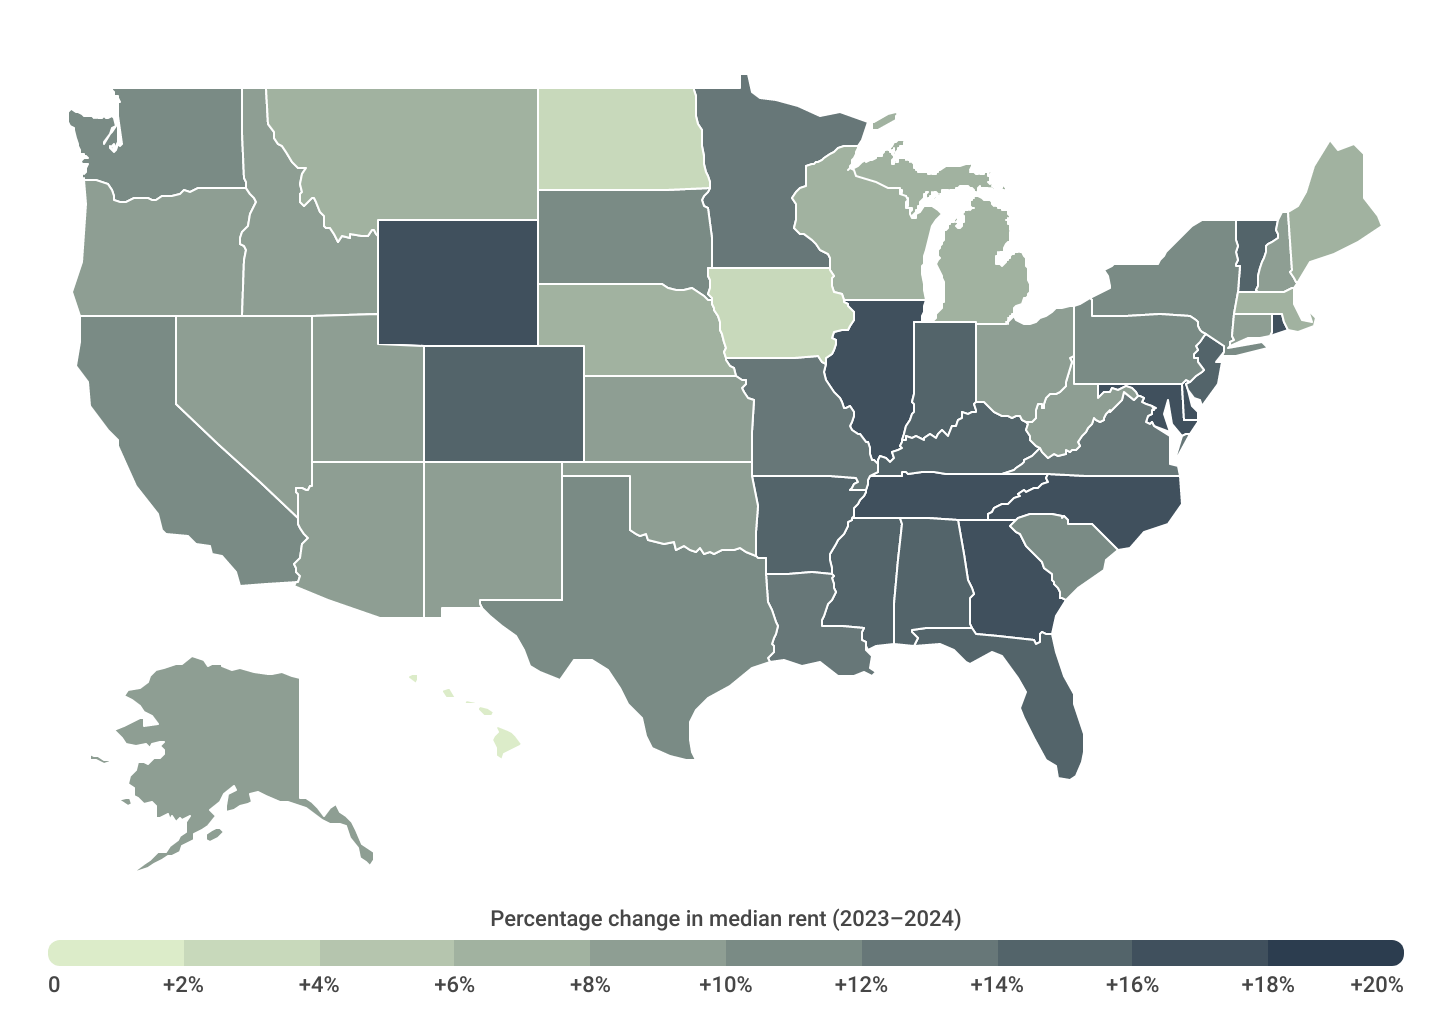
The majority of states saw double-digit rent increases over the past year

While house size has had little impact on the rates of rent increases, geographic location has. More than half of all U.S. states have seen rent grow by double-digit percentages, most of which are concentrated in the Southeast and Northeast of the country. Rhode Island (+17.9%), Maryland (+17.6%), and Delaware (+17.5%) lead the nation for percent change in median rents. In contrast, Midwestern states like North Dakota (+2.8%) and Iowa (+3.4%) have had far lower changes in rent. But the lowest rent increases have taken place in Hawaii, where median rent rose just 1.7% from 2023 to 2024—welcome news in a place that is already the nation’s most expensive for housing.
At the metro level, the pace of rent changes can be even more stark. In the fastest-increasing markets, renters have seen rents grow by more than a quarter in the last year, but in a handful of cities, rents have actually declined year-over-year.
Below is a complete breakdown of changes in rent prices across more than 350 metropolitan areas and all 50 states. The analysis was conducted by researchers at Construction Coverage using data from the Department of Housing and Urban Development’s (HUD) and the U.S. Census Bureau. For more information, refer to the methodology section.
Large Metros With the Biggest Change in Rent Prices
| Top Metros | Change* |
|---|---|
| 1. Indianapolis-Carmel-Anderson, IN | +27.1% |
| 2. Memphis, TN-MS-AR | +26.9% |
| 3. Baltimore-Columbia-Towson, MD | +25.8% |
| 4. Louisville/Jefferson County, KY-IN | +23.0% |
| 5. Jacksonville, FL | +22.0% |
| 6. St. Louis, MO-IL | +21.1% |
| 7. Chicago-Naperville-Elgin, IL-IN-WI | +19.8% |
| 8. Philadelphia-Camden-Wilmington, PA-NJ-DE-MD | +19.0% |
| 9. Austin-Round Rock-Georgetown, TX | +18.5% |
| 10. Miami-Fort Lauderdale-Pompano Beach, FL | +18.4% |
| 11. Denver-Aurora-Lakewood, CO | +18.4% |
| 12. Atlanta-Sandy Springs-Alpharetta, GA | +18.2% |
| 13. San Diego-Chula Vista-Carlsbad, CA | +17.9% |
| 14. Providence-Warwick, RI-MA | +17.4% |
| 15. Raleigh-Cary, NC | +16.9% |
| Bottom Metros | Change* |
|---|---|
| 1. Houston-The Woodlands-Sugar Land, TX | +0.6% |
| 2. Grand Rapids-Kentwood, MI | +5.2% |
| 3. Salt Lake City, UT | +6.0% |
| 4. Milwaukee-Waukesha, WI | +6.7% |
| 5. Pittsburgh, PA | +6.7% |
| 6. San Jose-Sunnyvale-Santa Clara, CA | +6.7% |
| 7. San Francisco-Oakland-Berkeley, CA | +6.8% |
| 8. Oklahoma City, OK | +7.3% |
| 9. Detroit-Warren-Dearborn, MI | +7.4% |
| 10. Phoenix-Mesa-Chandler, AZ | +7.6% |
| 11. Boston-Cambridge-Newton, MA-NH | +7.6% |
| 12. Buffalo-Cheektowaga, NY | +8.5% |
| 13. Kansas City, MO-KS | +8.7% |
| 14. Cincinnati, OH-KY-IN | +8.8% |
| 15. Seattle-Tacoma-Bellevue, WA | +9.7% |
FOR LANDLORDS
Property management software is a type of computer program that helps landlords, property managers, and real estate professionals manage rental properties. It allows users to organize and streamline various tasks related to managing a property, such as advertising available rentals, processing applications and leases, scheduling maintenance and repairs, and tracking finances.
Midsize Metros With the Biggest Change in Rent Prices
| Top Metros | Change* |
|---|---|
| 1. Hickory-Lenoir-Morganton, NC | +28.1% |
| 2. Baton Rouge, LA | +26.3% |
| 3. Durham-Chapel Hill, NC | +22.9% |
| 4. Gainesville, FL | +22.8% |
| 5. Fayetteville, NC | +22.4% |
| 6. Huntsville, AL | +21.3% |
| 7. Fayetteville-Springdale-Rogers, AR | +19.9% |
| 8. Myrtle Beach-Conway-North Myrtle Beach, SC-NC | +19.4% |
| 9. Fort Wayne, IN | +19.2% |
| 10. Gulfport-Biloxi, MS | +18.8% |
| 11. Killeen-Temple, TX | +18.6% |
| 12. El Paso, TX | +18.4% |
| 13. Little Rock-North Little Rock-Conway, AR | +17.4% |
| 14. Visalia, CA | +16.5% |
| 15. Colorado Springs, CO | +16.4% |
| Bottom Metros | Change* |
|---|---|
| 1. Reno, NV | -0.8% |
| 2. Urban Honolulu, HI | -0.7% |
| 3. Oxnard-Thousand Oaks-Ventura, CA | -0.7% |
| 4. Madison, WI | -0.4% |
| 5. Naples-Marco Island, FL | -0.2% |
| 6. Akron, OH | +0.4% |
| 7. Des Moines-West Des Moines, IA | +0.6% |
| 8. Youngstown-Warren-Boardman, OH-PA | +1.3% |
| 9. Syracuse, NY | +2.0% |
| 10. Lansing-East Lansing, MI | +2.3% |
| 11. Allentown-Bethlehem-Easton, PA-NJ | +2.4% |
| 12. Lafayette, LA | +2.6% |
| 13. Charleston-North Charleston, SC | +3.0% |
| 14. New Haven-Milford, CT | +3.3% |
| 15. Portland-South Portland, ME | +3.3% |
Small Metros With the Biggest Change in Rent Prices
| Top Metros | Change* |
|---|---|
| 1. Jacksonville, NC | +33.4% |
| 2. Clarksville, TN-KY | +26.4% |
| 3. Kennewick-Richland, WA | +25.3% |
| 4. Olympia-Lacey-Tumwater, WA | +25.1% |
| 5. Waco, TX | +24.9% |
| 6. Odessa, TX | +24.2% |
| 7. Santa Cruz-Watsonville, CA | +23.5% |
| 8. Jackson, TN | +22.5% |
| 9. Gadsden, AL | +22.0% |
| 10. Charlottesville, VA | +21.9% |
| 11. Longview, WA | +21.8% |
| 12. Santa Fe, NM | +21.3% |
| 13. Cheyenne, WY | +21.2% |
| 14. Johnson City, TN | +21.1% |
| 15. Casper, WY | +21.0% |
| Bottom Metros | Change* |
|---|---|
| 1. South Bend-Mishawaka, IN-MI | -8.3% |
| 2. Iowa City, IA | -4.4% |
| 3. Rochester, MN | -3.6% |
| 4. Lafayette-West Lafayette, IN | -3.1% |
| 5. Bloomington, IN | -1.5% |
| 6. Kalamazoo-Portage, MI | +1.1% |
| 7. Dubuque, IA | +1.5% |
| 8. Waterloo-Cedar Falls, IA | +2.0% |
| 9. Erie, PA | +2.1% |
| 10. State College, PA | +2.3% |
| 11. Pittsfield, MA | +2.4% |
| 12. Cedar Rapids, IA | +2.8% |
| 13. Champaign-Urbana, IL | +2.9% |
| 14. Duluth, MN-WI | +3.1% |
| 15. Barnstable Town, MA | +3.3% |
States With the Biggest Change in Rent Prices
| Top States | Change* |
|---|---|
| 1. Rhode Island | +17.9% |
| 2. Maryland | +17.6% |
| 3. Delaware | +17.5% |
| 4. Illinois | +17.1% |
| 5. Tennessee | +16.2% |
| 6. Georgia | +16.1% |
| 7. North Carolina | +16.1% |
| 8. Wyoming | +16.0% |
| 9. Colorado | +15.8% |
| 10. Vermont | +15.3% |
| 11. New Jersey | +15.1% |
| 12. Indiana | +15.1% |
| 13. Kentucky | +15.1% |
| 14. Florida | +14.9% |
| 15. Mississippi | +14.7% |
| Bottom States | Change* |
|---|---|
| 1. Hawaii | +1.7% |
| 2. North Dakota | +2.8% |
| 3. Iowa | +3.4% |
| 4. Maine | +6.0% |
| 5. Wisconsin | +6.5% |
| 6. Montana | +6.5% |
| 7. Nebraska | +7.2% |
| 8. Michigan | +7.5% |
| 9. Massachusetts | +7.6% |
| 10. Ohio | +8.1% |
| 11. Utah | +8.1% |
| 12. Idaho | +8.3% |
| 13. Oregon | +8.5% |
| 14. Connecticut | +8.5% |
| 15. Alaska | +8.7% |
*Percentage change in median rent (2023–2024)
Methodology
The data used in this analysis is from the U.S. Department of Housing and Urban Development’s (HUD) 50th Percentile Rent Estimates and the U.S. Census Bureau’s American Community Survey. To determine the locations with the biggest change in rent prices, researchers at Construction Coverage ranked locations by the percentage change in median rent from 2023 to 2024. In the event of a tie, locations with the greater total change in median rent from 2023 to 2024 was ranked higher. For each location, median rent was estimated by creating a weighted average of HUD’s median rent estimates by unit size using the number of renter-occupied households by unit size as the weighting factor.
To improve relevance only metropolitan areas with complete data were included. Additionally, metros were grouped into cohorts based on population: small (under 350,000), midsize (350,000–999,999), and large (1,000,000 or more).
References
- Emily Peck. (2023, December 22). Why everyone was so wrong about the 2023 economy. Axios. https://www.axios.com/2023/12/22/2023-economy-predictions-wrong-recession. Retrieved January 2, 2024.
- U.S. Bureau of Labor Statistics. 12-month percentage change, Consumer Price Index, selected categories. https://www.bls.gov/charts/consumer-price-index/consumer-price-index-by-category-line-chart.htm. Retrieved January 2, 2024.
- U.S. Census Bureau and U.S. Department of Housing and Urban Development. (2024, January 2). Median Sales Price of Houses Sold for the United States. FRED, Federal Reserve Bank of St. Louis. https://fred.stlouisfed.org/series/MSPUS. Retrieved January 2, 2024.
- Freddie Mac. (2024, January 2). 30-Year Fixed Rate Mortgage Average in the United States. FRED, Federal Reserve Bank of St. Louis. https://fred.stlouisfed.org/series/MORTGAGE30US. Retrieved January 2, 2024.
- Lida R. Weinstock. (2023, July 10). The U.S. Housing Underbuilding Gap. Congressional Research Service. https://crsreports.congress.gov/product/pdf/IN/IN12195. Retrieved January 2, 2024.
- U.S. Census Bureau. (2024, January 2). Rental Vacancy Rate for the United States. FRED, Federal Reserve Bank of St. Louis. https://fred.stlouisfed.org/series/USRVAC. Retrieved January 2, 2024.
- Justin Tyndall et al. (2023, June 28). The Hawai‘i Housing Factbook. The Economic Research Organization at the University of Hawai’i. https://uhero.hawaii.edu/wp-content/uploads/2023/06/TheHawaiiHousingFactbook.pdf. Retrieved January 2, 2024.
- Office of Policy Development and Research. (2024, January 2024). 50th Percentile Rent Estimates. U.S. Department of Housing and Urban Development. https://www.huduser.gov/portal/datasets/50per.html. Retrieved January 2, 2024.
- U.S. Census Bureau. (2023, January 2024). American Community Survey (ACS). https://www.census.gov/programs-surveys/acs. Retrieved January 2, 2024.
Full Results
Each company featured in our guides has been independently selected and reviewed by our research team. If you select one of these companies and click on a link, we may earn a commission.
By clicking on these links, you may be taken to one of our insurance partners. The specific company listed here may or may not be included in our partner’s network at this time.
