
U.S. Cities Building the Most Homes
Note: This is the most recent release of our U.S. Cities Building the Most Homes study. To see data from prior years, please visit the Full Results section below.
Across the United States, a persistent shortage of housing has fueled an ongoing affordability crisis, particularly in high-growth metropolitan areas. Over the past several years, high housing costs have stretched budgets for both homebuyers and renters alike. From the first quarter of 2020 to the first quarter of 2025, the median home sales price rose by nearly $88,000, while rents continue to increase faster than the overall rate of inflation.
Although higher interest rates since 2022 have cooled the housing market somewhat, they have done little to address the underlying supply shortage. Most estimates place the shortfall between 2.5 and 5.5 million units, reflecting years of underbuilding relative to population growth. While existing home inventory has increased, it remains well below pre-pandemic norms. At the same time, new construction continues to face significant headwinds. As of June 2025, the National Association of Home Builders (NAHB) Housing Market Index fell to 32, reflecting weakened builder confidence in the face of elevated mortgage rates and high construction costs.
In this challenging environment, some U.S. cities have taken more aggressive steps to expand their housing stock. This analysis conducted by Construction Coverage examines the pace of new home construction nationally, how long it typically takes to complete new housing, and which states and cities are leading in building the most new homes.
Key Findings
- The U.S. authorized approximately 1.5 million new housing units in 2024, a figure that aligns with the pre-2008 average but falls short of what’s needed to address a housing shortfall estimated between 2.5 and 5.5 million units.
- Housing construction timelines have lengthened, with a growing share of single-family homes facing delays both before and during construction. In 2024, 13% of projects took more than 13 months to complete—up from 9% in 2019.
- National permitting rates have declined, with new homes being authorized at a rate of 10.1 units per 1,000 existing homes, down from 11.7 in 2022. Only 13 states increased their total number of housing permits year-over-year.
- Idaho leads the nation in new construction activity, authorizing 21.2 new units per 1,000 existing homes—more than twice the national average—followed closely by high-growth states in the South and Mountain West, including North Carolina, South Carolina, Utah, and Arizona.
How Many New Homes Are Built Each Year?
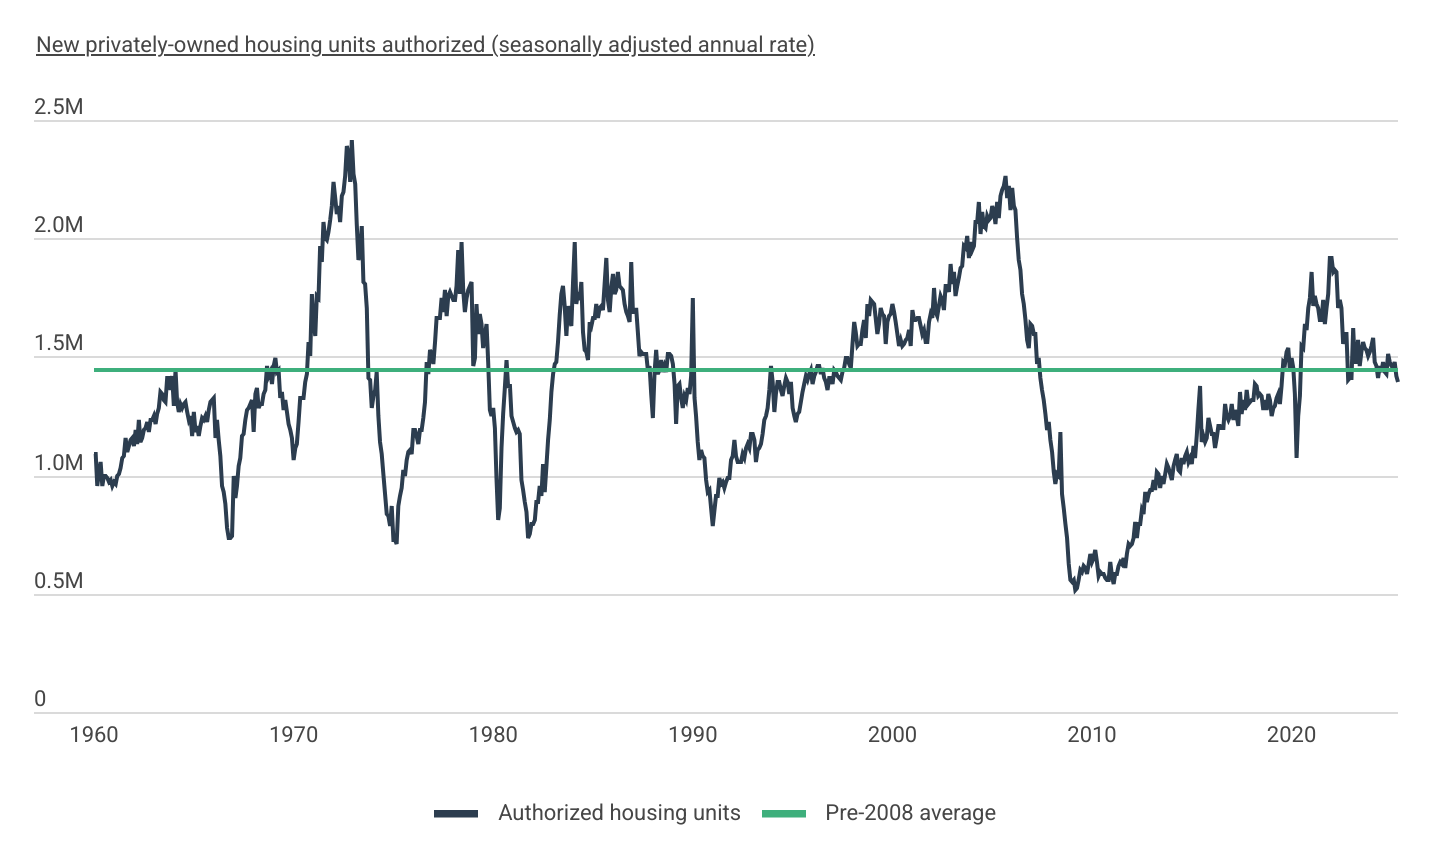
In 2024, just under 1.5 million new homes were authorized by building permits
Data: New Privately-Owned Housing Units Authorized (Seasonally Adjusted Annual Rate) Time Series
| Date | Authorized housing units | Pre-2008 average |
|---|---|---|
| 1/1/1960 | 1,092,000 | 1,446,418 |
| 2/1/1960 | 1,088,000 | 1,446,418 |
| 3/1/1960 | 955,000 | 1,446,418 |
| 4/1/1960 | 1,016,000 | 1,446,418 |
| 5/1/1960 | 1,052,000 | 1,446,418 |
| 6/1/1960 | 958,000 | 1,446,418 |
| 7/1/1960 | 999,000 | 1,446,418 |
| 8/1/1960 | 994,000 | 1,446,418 |
| 9/1/1960 | 984,000 | 1,446,418 |
| 10/1/1960 | 972,000 | 1,446,418 |
| 11/1/1960 | 979,000 | 1,446,418 |
| 12/1/1960 | 951,000 | 1,446,418 |
| 1/1/1961 | 969,000 | 1,446,418 |
| 2/1/1961 | 961,000 | 1,446,418 |
| 3/1/1961 | 1,000,000 | 1,446,418 |
| 4/1/1961 | 1,002,000 | 1,446,418 |
| 5/1/1961 | 1,027,000 | 1,446,418 |
| 6/1/1961 | 1,070,000 | 1,446,418 |
| 7/1/1961 | 1,083,000 | 1,446,418 |
| 8/1/1961 | 1,159,000 | 1,446,418 |
| 9/1/1961 | 1,098,000 | 1,446,418 |
| 10/1/1961 | 1,123,000 | 1,446,418 |
| 11/1/1961 | 1,152,000 | 1,446,418 |
| 12/1/1961 | 1,161,000 | 1,446,418 |
| 1/1/1962 | 1,122,000 | 1,446,418 |
| 2/1/1962 | 1,194,000 | 1,446,418 |
| 3/1/1962 | 1,134,000 | 1,446,418 |
| 4/1/1962 | 1,235,000 | 1,446,418 |
| 5/1/1962 | 1,142,000 | 1,446,418 |
| 6/1/1962 | 1,154,000 | 1,446,418 |
| 7/1/1962 | 1,189,000 | 1,446,418 |
| 8/1/1962 | 1,200,000 | 1,446,418 |
| 9/1/1962 | 1,223,000 | 1,446,418 |
| 10/1/1962 | 1,181,000 | 1,446,418 |
| 11/1/1962 | 1,236,000 | 1,446,418 |
| 12/1/1962 | 1,236,000 | 1,446,418 |
| 1/1/1963 | 1,248,000 | 1,446,418 |
| 2/1/1963 | 1,212,000 | 1,446,418 |
| 3/1/1963 | 1,258,000 | 1,446,418 |
| 4/1/1963 | 1,288,000 | 1,446,418 |
| 5/1/1963 | 1,350,000 | 1,446,418 |
| 6/1/1963 | 1,345,000 | 1,446,418 |
| 7/1/1963 | 1,321,000 | 1,446,418 |
| 8/1/1963 | 1,310,000 | 1,446,418 |
| 9/1/1963 | 1,413,000 | 1,446,418 |
| 10/1/1963 | 1,414,000 | 1,446,418 |
| 11/1/1963 | 1,357,000 | 1,446,418 |
| 12/1/1963 | 1,423,000 | 1,446,418 |
| 1/1/1964 | 1,296,000 | 1,446,418 |
| 2/1/1964 | 1,442,000 | 1,446,418 |
| 3/1/1964 | 1,313,000 | 1,446,418 |
| 4/1/1964 | 1,264,000 | 1,446,418 |
| 5/1/1964 | 1,299,000 | 1,446,418 |
| 6/1/1964 | 1,280,000 | 1,446,418 |
| 7/1/1964 | 1,304,000 | 1,446,418 |
| 8/1/1964 | 1,306,000 | 1,446,418 |
| 9/1/1964 | 1,265,000 | 1,446,418 |
| 10/1/1964 | 1,230,000 | 1,446,418 |
| 11/1/1964 | 1,254,000 | 1,446,418 |
| 12/1/1964 | 1,164,000 | 1,446,418 |
| 1/1/1965 | 1,264,000 | 1,446,418 |
| 2/1/1965 | 1,185,000 | 1,446,418 |
| 3/1/1965 | 1,211,000 | 1,446,418 |
| 4/1/1965 | 1,162,000 | 1,446,418 |
| 5/1/1965 | 1,207,000 | 1,446,418 |
| 6/1/1965 | 1,241,000 | 1,446,418 |
| 7/1/1965 | 1,237,000 | 1,446,418 |
| 8/1/1965 | 1,249,000 | 1,446,418 |
| 9/1/1965 | 1,227,000 | 1,446,418 |
| 10/1/1965 | 1,279,000 | 1,446,418 |
| 11/1/1965 | 1,306,000 | 1,446,418 |
| 12/1/1965 | 1,315,000 | 1,446,418 |
| 1/1/1966 | 1,325,000 | 1,446,418 |
| 2/1/1966 | 1,159,000 | 1,446,418 |
| 3/1/1966 | 1,234,000 | 1,446,418 |
| 4/1/1966 | 1,145,000 | 1,446,418 |
| 5/1/1966 | 1,078,000 | 1,446,418 |
| 6/1/1966 | 956,000 | 1,446,418 |
| 7/1/1966 | 932,000 | 1,446,418 |
| 8/1/1966 | 877,000 | 1,446,418 |
| 9/1/1966 | 774,000 | 1,446,418 |
| 10/1/1966 | 739,000 | 1,446,418 |
| 11/1/1966 | 736,000 | 1,446,418 |
| 12/1/1966 | 743,000 | 1,446,418 |
| 1/1/1967 | 995,000 | 1,446,418 |
| 2/1/1967 | 907,000 | 1,446,418 |
| 3/1/1967 | 955,000 | 1,446,418 |
| 4/1/1967 | 1,035,000 | 1,446,418 |
| 5/1/1967 | 1,076,000 | 1,446,418 |
| 6/1/1967 | 1,169,000 | 1,446,418 |
| 7/1/1967 | 1,177,000 | 1,446,418 |
| 8/1/1967 | 1,229,000 | 1,446,418 |
| 9/1/1967 | 1,279,000 | 1,446,418 |
| 10/1/1967 | 1,280,000 | 1,446,418 |
| 11/1/1967 | 1,297,000 | 1,446,418 |
| 12/1/1967 | 1,315,000 | 1,446,418 |
| 1/1/1968 | 1,179,000 | 1,446,418 |
| 2/1/1968 | 1,342,000 | 1,446,418 |
| 3/1/1968 | 1,370,000 | 1,446,418 |
| 4/1/1968 | 1,286,000 | 1,446,418 |
| 5/1/1968 | 1,297,000 | 1,446,418 |
| 6/1/1968 | 1,300,000 | 1,446,418 |
| 7/1/1968 | 1,344,000 | 1,446,418 |
| 8/1/1968 | 1,357,000 | 1,446,418 |
| 9/1/1968 | 1,464,000 | 1,446,418 |
| 10/1/1968 | 1,421,000 | 1,446,418 |
| 11/1/1968 | 1,436,000 | 1,446,418 |
| 12/1/1968 | 1,389,000 | 1,446,418 |
| 1/1/1969 | 1,459,000 | 1,446,418 |
| 2/1/1969 | 1,495,000 | 1,446,418 |
| 3/1/1969 | 1,438,000 | 1,446,418 |
| 4/1/1969 | 1,441,000 | 1,446,418 |
| 5/1/1969 | 1,328,000 | 1,446,418 |
| 6/1/1969 | 1,349,000 | 1,446,418 |
| 7/1/1969 | 1,278,000 | 1,446,418 |
| 8/1/1969 | 1,317,000 | 1,446,418 |
| 9/1/1969 | 1,263,000 | 1,446,418 |
| 10/1/1969 | 1,216,000 | 1,446,418 |
| 11/1/1969 | 1,191,000 | 1,446,418 |
| 12/1/1969 | 1,155,000 | 1,446,418 |
| 1/1/1970 | 1,062,000 | 1,446,418 |
| 2/1/1970 | 1,118,000 | 1,446,418 |
| 3/1/1970 | 1,132,000 | 1,446,418 |
| 4/1/1970 | 1,224,000 | 1,446,418 |
| 5/1/1970 | 1,328,000 | 1,446,418 |
| 6/1/1970 | 1,322,000 | 1,446,418 |
| 7/1/1970 | 1,324,000 | 1,446,418 |
| 8/1/1970 | 1,394,000 | 1,446,418 |
| 9/1/1970 | 1,426,000 | 1,446,418 |
| 10/1/1970 | 1,564,000 | 1,446,418 |
| 11/1/1970 | 1,502,000 | 1,446,418 |
| 12/1/1970 | 1,767,000 | 1,446,418 |
| 1/1/1971 | 1,643,000 | 1,446,418 |
| 2/1/1971 | 1,588,000 | 1,446,418 |
| 3/1/1971 | 1,759,000 | 1,446,418 |
| 4/1/1971 | 1,745,000 | 1,446,418 |
| 5/1/1971 | 1,972,000 | 1,446,418 |
| 6/1/1971 | 1,903,000 | 1,446,418 |
| 7/1/1971 | 2,069,000 | 1,446,418 |
| 8/1/1971 | 2,004,000 | 1,446,418 |
| 9/1/1971 | 1,996,000 | 1,446,418 |
| 10/1/1971 | 2,026,000 | 1,446,418 |
| 11/1/1971 | 2,079,000 | 1,446,418 |
| 12/1/1971 | 2,133,000 | 1,446,418 |
| 1/1/1972 | 2,238,000 | 1,446,418 |
| 2/1/1972 | 2,169,000 | 1,446,418 |
| 3/1/1972 | 2,105,000 | 1,446,418 |
| 4/1/1972 | 2,139,000 | 1,446,418 |
| 5/1/1972 | 2,067,000 | 1,446,418 |
| 6/1/1972 | 2,183,000 | 1,446,418 |
| 7/1/1972 | 2,195,000 | 1,446,418 |
| 8/1/1972 | 2,263,000 | 1,446,418 |
| 9/1/1972 | 2,393,000 | 1,446,418 |
| 10/1/1972 | 2,354,000 | 1,446,418 |
| 11/1/1972 | 2,234,000 | 1,446,418 |
| 12/1/1972 | 2,419,000 | 1,446,418 |
| 1/1/1973 | 2,271,000 | 1,446,418 |
| 2/1/1973 | 2,226,000 | 1,446,418 |
| 3/1/1973 | 2,062,000 | 1,446,418 |
| 4/1/1973 | 1,908,000 | 1,446,418 |
| 5/1/1973 | 1,931,000 | 1,446,418 |
| 6/1/1973 | 2,051,000 | 1,446,418 |
| 7/1/1973 | 1,819,000 | 1,446,418 |
| 8/1/1973 | 1,809,000 | 1,446,418 |
| 9/1/1973 | 1,704,000 | 1,446,418 |
| 10/1/1973 | 1,411,000 | 1,446,418 |
| 11/1/1973 | 1,402,000 | 1,446,418 |
| 12/1/1973 | 1,288,000 | 1,446,418 |
| 1/1/1974 | 1,331,000 | 1,446,418 |
| 2/1/1974 | 1,360,000 | 1,446,418 |
| 3/1/1974 | 1,440,000 | 1,446,418 |
| 4/1/1974 | 1,254,000 | 1,446,418 |
| 5/1/1974 | 1,138,000 | 1,446,418 |
| 6/1/1974 | 1,086,000 | 1,446,418 |
| 7/1/1974 | 1,002,000 | 1,446,418 |
| 8/1/1974 | 917,000 | 1,446,418 |
| 9/1/1974 | 840,000 | 1,446,418 |
| 10/1/1974 | 824,000 | 1,446,418 |
| 11/1/1974 | 783,000 | 1,446,418 |
| 12/1/1974 | 869,000 | 1,446,418 |
| 1/1/1975 | 726,000 | 1,446,418 |
| 2/1/1975 | 729,000 | 1,446,418 |
| 3/1/1975 | 709,000 | 1,446,418 |
| 4/1/1975 | 866,000 | 1,446,418 |
| 5/1/1975 | 914,000 | 1,446,418 |
| 6/1/1975 | 946,000 | 1,446,418 |
| 7/1/1975 | 1,020,000 | 1,446,418 |
| 8/1/1975 | 994,000 | 1,446,418 |
| 9/1/1975 | 1,064,000 | 1,446,418 |
| 10/1/1975 | 1,096,000 | 1,446,418 |
| 11/1/1975 | 1,110,000 | 1,446,418 |
| 12/1/1975 | 1,091,000 | 1,446,418 |
| 1/1/1976 | 1,195,000 | 1,446,418 |
| 2/1/1976 | 1,190,000 | 1,446,418 |
| 3/1/1976 | 1,164,000 | 1,446,418 |
| 4/1/1976 | 1,132,000 | 1,446,418 |
| 5/1/1976 | 1,194,000 | 1,446,418 |
| 6/1/1976 | 1,188,000 | 1,446,418 |
| 7/1/1976 | 1,245,000 | 1,446,418 |
| 8/1/1976 | 1,309,000 | 1,446,418 |
| 9/1/1976 | 1,481,000 | 1,446,418 |
| 10/1/1976 | 1,425,000 | 1,446,418 |
| 11/1/1976 | 1,531,000 | 1,446,418 |
| 12/1/1976 | 1,511,000 | 1,446,418 |
| 1/1/1977 | 1,466,000 | 1,446,418 |
| 2/1/1977 | 1,560,000 | 1,446,418 |
| 3/1/1977 | 1,660,000 | 1,446,418 |
| 4/1/1977 | 1,660,000 | 1,446,418 |
| 5/1/1977 | 1,668,000 | 1,446,418 |
| 6/1/1977 | 1,752,000 | 1,446,418 |
| 7/1/1977 | 1,687,000 | 1,446,418 |
| 8/1/1977 | 1,780,000 | 1,446,418 |
| 9/1/1977 | 1,674,000 | 1,446,418 |
| 10/1/1977 | 1,758,000 | 1,446,418 |
| 11/1/1977 | 1,771,000 | 1,446,418 |
| 12/1/1977 | 1,754,000 | 1,446,418 |
| 1/1/1978 | 1,740,000 | 1,446,418 |
| 2/1/1978 | 1,736,000 | 1,446,418 |
| 3/1/1978 | 1,799,000 | 1,446,418 |
| 4/1/1978 | 1,948,000 | 1,446,418 |
| 5/1/1978 | 1,766,000 | 1,446,418 |
| 6/1/1978 | 1,983,000 | 1,446,418 |
| 7/1/1978 | 1,786,000 | 1,446,418 |
| 8/1/1978 | 1,691,000 | 1,446,418 |
| 9/1/1978 | 1,751,000 | 1,446,418 |
| 10/1/1978 | 1,781,000 | 1,446,418 |
| 11/1/1978 | 1,795,000 | 1,446,418 |
| 12/1/1978 | 1,818,000 | 1,446,418 |
| 1/1/1979 | 1,461,000 | 1,446,418 |
| 2/1/1979 | 1,492,000 | 1,446,418 |
| 3/1/1979 | 1,720,000 | 1,446,418 |
| 4/1/1979 | 1,597,000 | 1,446,418 |
| 5/1/1979 | 1,684,000 | 1,446,418 |
| 6/1/1979 | 1,640,000 | 1,446,418 |
| 7/1/1979 | 1,534,000 | 1,446,418 |
| 8/1/1979 | 1,591,000 | 1,446,418 |
| 9/1/1979 | 1,638,000 | 1,446,418 |
| 10/1/1979 | 1,481,000 | 1,446,418 |
| 11/1/1979 | 1,276,000 | 1,446,418 |
| 12/1/1979 | 1,254,000 | 1,446,418 |
| 1/1/1980 | 1,280,000 | 1,446,418 |
| 2/1/1980 | 1,199,000 | 1,446,418 |
| 3/1/1980 | 988,000 | 1,446,418 |
| 4/1/1980 | 808,000 | 1,446,418 |
| 5/1/1980 | 861,000 | 1,446,418 |
| 6/1/1980 | 1,118,000 | 1,446,418 |
| 7/1/1980 | 1,259,000 | 1,446,418 |
| 8/1/1980 | 1,367,000 | 1,446,418 |
| 9/1/1980 | 1,484,000 | 1,446,418 |
| 10/1/1980 | 1,366,000 | 1,446,418 |
| 11/1/1980 | 1,383,000 | 1,446,418 |
| 12/1/1980 | 1,249,000 | 1,446,418 |
| 1/1/1981 | 1,221,000 | 1,446,418 |
| 2/1/1981 | 1,199,000 | 1,446,418 |
| 3/1/1981 | 1,183,000 | 1,446,418 |
| 4/1/1981 | 1,190,000 | 1,446,418 |
| 5/1/1981 | 1,173,000 | 1,446,418 |
| 6/1/1981 | 976,000 | 1,446,418 |
| 7/1/1981 | 935,000 | 1,446,418 |
| 8/1/1981 | 889,000 | 1,446,418 |
| 9/1/1981 | 847,000 | 1,446,418 |
| 10/1/1981 | 731,000 | 1,446,418 |
| 11/1/1981 | 748,000 | 1,446,418 |
| 12/1/1981 | 796,000 | 1,446,418 |
| 1/1/1982 | 794,000 | 1,446,418 |
| 2/1/1982 | 808,000 | 1,446,418 |
| 3/1/1982 | 891,000 | 1,446,418 |
| 4/1/1982 | 888,000 | 1,446,418 |
| 5/1/1982 | 953,000 | 1,446,418 |
| 6/1/1982 | 913,000 | 1,446,418 |
| 7/1/1982 | 1,044,000 | 1,446,418 |
| 8/1/1982 | 926,000 | 1,446,418 |
| 9/1/1982 | 1,042,000 | 1,446,418 |
| 10/1/1982 | 1,149,000 | 1,446,418 |
| 11/1/1982 | 1,229,000 | 1,446,418 |
| 12/1/1982 | 1,351,000 | 1,446,418 |
| 1/1/1983 | 1,426,000 | 1,446,418 |
| 2/1/1983 | 1,471,000 | 1,446,418 |
| 3/1/1983 | 1,475,000 | 1,446,418 |
| 4/1/1983 | 1,566,000 | 1,446,418 |
| 5/1/1983 | 1,669,000 | 1,446,418 |
| 6/1/1983 | 1,769,000 | 1,446,418 |
| 7/1/1983 | 1,795,000 | 1,446,418 |
| 8/1/1983 | 1,713,000 | 1,446,418 |
| 9/1/1983 | 1,585,000 | 1,446,418 |
| 10/1/1983 | 1,716,000 | 1,446,418 |
| 11/1/1983 | 1,668,000 | 1,446,418 |
| 12/1/1983 | 1,627,000 | 1,446,418 |
| 1/1/1984 | 1,816,000 | 1,446,418 |
| 2/1/1984 | 1,987,000 | 1,446,418 |
| 3/1/1984 | 1,725,000 | 1,446,418 |
| 4/1/1984 | 1,776,000 | 1,446,418 |
| 5/1/1984 | 1,741,000 | 1,446,418 |
| 6/1/1984 | 1,814,000 | 1,446,418 |
| 7/1/1984 | 1,605,000 | 1,446,418 |
| 8/1/1984 | 1,530,000 | 1,446,418 |
| 9/1/1984 | 1,523,000 | 1,446,418 |
| 10/1/1984 | 1,490,000 | 1,446,418 |
| 11/1/1984 | 1,643,000 | 1,446,418 |
| 12/1/1984 | 1,626,000 | 1,446,418 |
| 1/1/1985 | 1,660,000 | 1,446,418 |
| 2/1/1985 | 1,662,000 | 1,446,418 |
| 3/1/1985 | 1,727,000 | 1,446,418 |
| 4/1/1985 | 1,664,000 | 1,446,418 |
| 5/1/1985 | 1,709,000 | 1,446,418 |
| 6/1/1985 | 1,716,000 | 1,446,418 |
| 7/1/1985 | 1,697,000 | 1,446,418 |
| 8/1/1985 | 1,808,000 | 1,446,418 |
| 9/1/1985 | 1,916,000 | 1,446,418 |
| 10/1/1985 | 1,743,000 | 1,446,418 |
| 11/1/1985 | 1,692,000 | 1,446,418 |
| 12/1/1985 | 1,794,000 | 1,446,418 |
| 1/1/1986 | 1,847,000 | 1,446,418 |
| 2/1/1986 | 1,767,000 | 1,446,418 |
| 3/1/1986 | 1,780,000 | 1,446,418 |
| 4/1/1986 | 1,858,000 | 1,446,418 |
| 5/1/1986 | 1,797,000 | 1,446,418 |
| 6/1/1986 | 1,790,000 | 1,446,418 |
| 7/1/1986 | 1,780,000 | 1,446,418 |
| 8/1/1986 | 1,726,000 | 1,446,418 |
| 9/1/1986 | 1,686,000 | 1,446,418 |
| 10/1/1986 | 1,675,000 | 1,446,418 |
| 11/1/1986 | 1,644,000 | 1,446,418 |
| 12/1/1986 | 1,903,000 | 1,446,418 |
| 1/1/1987 | 1,690,000 | 1,446,418 |
| 2/1/1987 | 1,689,000 | 1,446,418 |
| 3/1/1987 | 1,704,000 | 1,446,418 |
| 4/1/1987 | 1,601,000 | 1,446,418 |
| 5/1/1987 | 1,500,000 | 1,446,418 |
| 6/1/1987 | 1,522,000 | 1,446,418 |
| 7/1/1987 | 1,516,000 | 1,446,418 |
| 8/1/1987 | 1,511,000 | 1,446,418 |
| 9/1/1987 | 1,514,000 | 1,446,418 |
| 10/1/1987 | 1,447,000 | 1,446,418 |
| 11/1/1987 | 1,457,000 | 1,446,418 |
| 12/1/1987 | 1,345,000 | 1,446,418 |
| 1/1/1988 | 1,244,000 | 1,446,418 |
| 2/1/1988 | 1,438,000 | 1,446,418 |
| 3/1/1988 | 1,525,000 | 1,446,418 |
| 4/1/1988 | 1,429,000 | 1,446,418 |
| 5/1/1988 | 1,444,000 | 1,446,418 |
| 6/1/1988 | 1,485,000 | 1,446,418 |
| 7/1/1988 | 1,439,000 | 1,446,418 |
| 8/1/1988 | 1,460,000 | 1,446,418 |
| 9/1/1988 | 1,436,000 | 1,446,418 |
| 10/1/1988 | 1,516,000 | 1,446,418 |
| 11/1/1988 | 1,508,000 | 1,446,418 |
| 12/1/1988 | 1,501,000 | 1,446,418 |
| 1/1/1989 | 1,466,000 | 1,446,418 |
| 2/1/1989 | 1,383,000 | 1,446,418 |
| 3/1/1989 | 1,214,000 | 1,446,418 |
| 4/1/1989 | 1,376,000 | 1,446,418 |
| 5/1/1989 | 1,381,000 | 1,446,418 |
| 6/1/1989 | 1,322,000 | 1,446,418 |
| 7/1/1989 | 1,283,000 | 1,446,418 |
| 8/1/1989 | 1,334,000 | 1,446,418 |
| 9/1/1989 | 1,314,000 | 1,446,418 |
| 10/1/1989 | 1,365,000 | 1,446,418 |
| 11/1/1989 | 1,344,000 | 1,446,418 |
| 12/1/1989 | 1,422,000 | 1,446,418 |
| 1/1/1990 | 1,748,000 | 1,446,418 |
| 2/1/1990 | 1,329,000 | 1,446,418 |
| 3/1/1990 | 1,246,000 | 1,446,418 |
| 4/1/1990 | 1,136,000 | 1,446,418 |
| 5/1/1990 | 1,067,000 | 1,446,418 |
| 6/1/1990 | 1,108,000 | 1,446,418 |
| 7/1/1990 | 1,078,000 | 1,446,418 |
| 8/1/1990 | 1,069,000 | 1,446,418 |
| 9/1/1990 | 976,000 | 1,446,418 |
| 10/1/1990 | 925,000 | 1,446,418 |
| 11/1/1990 | 941,000 | 1,446,418 |
| 12/1/1990 | 861,000 | 1,446,418 |
| 1/1/1991 | 786,000 | 1,446,418 |
| 2/1/1991 | 853,000 | 1,446,418 |
| 3/1/1991 | 911,000 | 1,446,418 |
| 4/1/1991 | 916,000 | 1,446,418 |
| 5/1/1991 | 991,000 | 1,446,418 |
| 6/1/1991 | 964,000 | 1,446,418 |
| 7/1/1991 | 973,000 | 1,446,418 |
| 8/1/1991 | 944,000 | 1,446,418 |
| 9/1/1991 | 974,000 | 1,446,418 |
| 10/1/1991 | 991,000 | 1,446,418 |
| 11/1/1991 | 984,000 | 1,446,418 |
| 12/1/1991 | 1,061,000 | 1,446,418 |
| 1/1/1992 | 1,077,000 | 1,446,418 |
| 2/1/1992 | 1,146,000 | 1,446,418 |
| 3/1/1992 | 1,082,000 | 1,446,418 |
| 4/1/1992 | 1,054,000 | 1,446,418 |
| 5/1/1992 | 1,056,000 | 1,446,418 |
| 6/1/1992 | 1,057,000 | 1,446,418 |
| 7/1/1992 | 1,089,000 | 1,446,418 |
| 8/1/1992 | 1,075,000 | 1,446,418 |
| 9/1/1992 | 1,114,000 | 1,446,418 |
| 10/1/1992 | 1,132,000 | 1,446,418 |
| 11/1/1992 | 1,118,000 | 1,446,418 |
| 12/1/1992 | 1,176,000 | 1,446,418 |
| 1/1/1993 | 1,177,000 | 1,446,418 |
| 2/1/1993 | 1,148,000 | 1,446,418 |
| 3/1/1993 | 1,056,000 | 1,446,418 |
| 4/1/1993 | 1,104,000 | 1,446,418 |
| 5/1/1993 | 1,112,000 | 1,446,418 |
| 6/1/1993 | 1,130,000 | 1,446,418 |
| 7/1/1993 | 1,174,000 | 1,446,418 |
| 8/1/1993 | 1,230,000 | 1,446,418 |
| 9/1/1993 | 1,251,000 | 1,446,418 |
| 10/1/1993 | 1,287,000 | 1,446,418 |
| 11/1/1993 | 1,357,000 | 1,446,418 |
| 12/1/1993 | 1,461,000 | 1,446,418 |
| 1/1/1994 | 1,390,000 | 1,446,418 |
| 2/1/1994 | 1,269,000 | 1,446,418 |
| 3/1/1994 | 1,342,000 | 1,446,418 |
| 4/1/1994 | 1,392,000 | 1,446,418 |
| 5/1/1994 | 1,396,000 | 1,446,418 |
| 6/1/1994 | 1,357,000 | 1,446,418 |
| 7/1/1994 | 1,335,000 | 1,446,418 |
| 8/1/1994 | 1,377,000 | 1,446,418 |
| 9/1/1994 | 1,412,000 | 1,446,418 |
| 10/1/1994 | 1,397,000 | 1,446,418 |
| 11/1/1994 | 1,340,000 | 1,446,418 |
| 12/1/1994 | 1,396,000 | 1,446,418 |
| 1/1/1995 | 1,282,000 | 1,446,418 |
| 2/1/1995 | 1,254,000 | 1,446,418 |
| 3/1/1995 | 1,226,000 | 1,446,418 |
| 4/1/1995 | 1,259,000 | 1,446,418 |
| 5/1/1995 | 1,271,000 | 1,446,418 |
| 6/1/1995 | 1,305,000 | 1,446,418 |
| 7/1/1995 | 1,354,000 | 1,446,418 |
| 8/1/1995 | 1,386,000 | 1,446,418 |
| 9/1/1995 | 1,421,000 | 1,446,418 |
| 10/1/1995 | 1,400,000 | 1,446,418 |
| 11/1/1995 | 1,430,000 | 1,446,418 |
| 12/1/1995 | 1,442,000 | 1,446,418 |
| 1/1/1996 | 1,387,000 | 1,446,418 |
| 2/1/1996 | 1,420,000 | 1,446,418 |
| 3/1/1996 | 1,437,000 | 1,446,418 |
| 4/1/1996 | 1,463,000 | 1,446,418 |
| 5/1/1996 | 1,457,000 | 1,446,418 |
| 6/1/1996 | 1,429,000 | 1,446,418 |
| 7/1/1996 | 1,450,000 | 1,446,418 |
| 8/1/1996 | 1,413,000 | 1,446,418 |
| 9/1/1996 | 1,392,000 | 1,446,418 |
| 10/1/1996 | 1,358,000 | 1,446,418 |
| 11/1/1996 | 1,412,000 | 1,446,418 |
| 12/1/1996 | 1,411,000 | 1,446,418 |
| 1/1/1997 | 1,382,000 | 1,446,418 |
| 2/1/1997 | 1,445,000 | 1,446,418 |
| 3/1/1997 | 1,436,000 | 1,446,418 |
| 4/1/1997 | 1,421,000 | 1,446,418 |
| 5/1/1997 | 1,414,000 | 1,446,418 |
| 6/1/1997 | 1,402,000 | 1,446,418 |
| 7/1/1997 | 1,440,000 | 1,446,418 |
| 8/1/1997 | 1,449,000 | 1,446,418 |
| 9/1/1997 | 1,494,000 | 1,446,418 |
| 10/1/1997 | 1,499,000 | 1,446,418 |
| 11/1/1997 | 1,469,000 | 1,446,418 |
| 12/1/1997 | 1,456,000 | 1,446,418 |
| 1/1/1998 | 1,555,000 | 1,446,418 |
| 2/1/1998 | 1,647,000 | 1,446,418 |
| 3/1/1998 | 1,605,000 | 1,446,418 |
| 4/1/1998 | 1,547,000 | 1,446,418 |
| 5/1/1998 | 1,554,000 | 1,446,418 |
| 6/1/1998 | 1,551,000 | 1,446,418 |
| 7/1/1998 | 1,610,000 | 1,446,418 |
| 8/1/1998 | 1,654,000 | 1,446,418 |
| 9/1/1998 | 1,577,000 | 1,446,418 |
| 10/1/1998 | 1,719,000 | 1,446,418 |
| 11/1/1998 | 1,672,000 | 1,446,418 |
| 12/1/1998 | 1,742,000 | 1,446,418 |
| 1/1/1999 | 1,732,000 | 1,446,418 |
| 2/1/1999 | 1,720,000 | 1,446,418 |
| 3/1/1999 | 1,665,000 | 1,446,418 |
| 4/1/1999 | 1,600,000 | 1,446,418 |
| 5/1/1999 | 1,640,000 | 1,446,418 |
| 6/1/1999 | 1,702,000 | 1,446,418 |
| 7/1/1999 | 1,682,000 | 1,446,418 |
| 8/1/1999 | 1,671,000 | 1,446,418 |
| 9/1/1999 | 1,551,000 | 1,446,418 |
| 10/1/1999 | 1,649,000 | 1,446,418 |
| 11/1/1999 | 1,672,000 | 1,446,418 |
| 12/1/1999 | 1,683,000 | 1,446,418 |
| 1/1/2000 | 1,727,000 | 1,446,418 |
| 2/1/2000 | 1,692,000 | 1,446,418 |
| 3/1/2000 | 1,651,000 | 1,446,418 |
| 4/1/2000 | 1,597,000 | 1,446,418 |
| 5/1/2000 | 1,543,000 | 1,446,418 |
| 6/1/2000 | 1,572,000 | 1,446,418 |
| 7/1/2000 | 1,542,000 | 1,446,418 |
| 8/1/2000 | 1,552,000 | 1,446,418 |
| 9/1/2000 | 1,570,000 | 1,446,418 |
| 10/1/2000 | 1,577,000 | 1,446,418 |
| 11/1/2000 | 1,614,000 | 1,446,418 |
| 12/1/2000 | 1,543,000 | 1,446,418 |
| 1/1/2001 | 1,699,000 | 1,446,418 |
| 2/1/2001 | 1,656,000 | 1,446,418 |
| 3/1/2001 | 1,659,000 | 1,446,418 |
| 4/1/2001 | 1,666,000 | 1,446,418 |
| 5/1/2001 | 1,665,000 | 1,446,418 |
| 6/1/2001 | 1,626,000 | 1,446,418 |
| 7/1/2001 | 1,598,000 | 1,446,418 |
| 8/1/2001 | 1,615,000 | 1,446,418 |
| 9/1/2001 | 1,565,000 | 1,446,418 |
| 10/1/2001 | 1,566,000 | 1,446,418 |
| 11/1/2001 | 1,651,000 | 1,446,418 |
| 12/1/2001 | 1,680,000 | 1,446,418 |
| 1/1/2002 | 1,665,000 | 1,446,418 |
| 2/1/2002 | 1,787,000 | 1,446,418 |
| 3/1/2002 | 1,691,000 | 1,446,418 |
| 4/1/2002 | 1,669,000 | 1,446,418 |
| 5/1/2002 | 1,716,000 | 1,446,418 |
| 6/1/2002 | 1,758,000 | 1,446,418 |
| 7/1/2002 | 1,738,000 | 1,446,418 |
| 8/1/2002 | 1,695,000 | 1,446,418 |
| 9/1/2002 | 1,803,000 | 1,446,418 |
| 10/1/2002 | 1,799,000 | 1,446,418 |
| 11/1/2002 | 1,771,000 | 1,446,418 |
| 12/1/2002 | 1,896,000 | 1,446,418 |
| 1/1/2003 | 1,808,000 | 1,446,418 |
| 2/1/2003 | 1,854,000 | 1,446,418 |
| 3/1/2003 | 1,757,000 | 1,446,418 |
| 4/1/2003 | 1,803,000 | 1,446,418 |
| 5/1/2003 | 1,835,000 | 1,446,418 |
| 6/1/2003 | 1,875,000 | 1,446,418 |
| 7/1/2003 | 1,885,000 | 1,446,418 |
| 8/1/2003 | 1,966,000 | 1,446,418 |
| 9/1/2003 | 1,961,000 | 1,446,418 |
| 10/1/2003 | 2,012,000 | 1,446,418 |
| 11/1/2003 | 1,918,000 | 1,446,418 |
| 12/1/2003 | 1,987,000 | 1,446,418 |
| 1/1/2004 | 1,952,000 | 1,446,418 |
| 2/1/2004 | 1,966,000 | 1,446,418 |
| 3/1/2004 | 2,066,000 | 1,446,418 |
| 4/1/2004 | 2,070,000 | 1,446,418 |
| 5/1/2004 | 2,150,000 | 1,446,418 |
| 6/1/2004 | 2,020,000 | 1,446,418 |
| 7/1/2004 | 2,112,000 | 1,446,418 |
| 8/1/2004 | 2,056,000 | 1,446,418 |
| 9/1/2004 | 2,041,000 | 1,446,418 |
| 10/1/2004 | 2,097,000 | 1,446,418 |
| 11/1/2004 | 2,079,000 | 1,446,418 |
| 12/1/2004 | 2,082,000 | 1,446,418 |
| 1/1/2005 | 2,139,000 | 1,446,418 |
| 2/1/2005 | 2,114,000 | 1,446,418 |
| 3/1/2005 | 2,062,000 | 1,446,418 |
| 4/1/2005 | 2,150,000 | 1,446,418 |
| 5/1/2005 | 2,085,000 | 1,446,418 |
| 6/1/2005 | 2,178,000 | 1,446,418 |
| 7/1/2005 | 2,203,000 | 1,446,418 |
| 8/1/2005 | 2,219,000 | 1,446,418 |
| 9/1/2005 | 2,263,000 | 1,446,418 |
| 10/1/2005 | 2,170,000 | 1,446,418 |
| 11/1/2005 | 2,218,000 | 1,446,418 |
| 12/1/2005 | 2,120,000 | 1,446,418 |
| 1/1/2006 | 2,212,000 | 1,446,418 |
| 2/1/2006 | 2,141,000 | 1,446,418 |
| 3/1/2006 | 2,118,000 | 1,446,418 |
| 4/1/2006 | 1,998,000 | 1,446,418 |
| 5/1/2006 | 1,905,000 | 1,446,418 |
| 6/1/2006 | 1,867,000 | 1,446,418 |
| 7/1/2006 | 1,763,000 | 1,446,418 |
| 8/1/2006 | 1,722,000 | 1,446,418 |
| 9/1/2006 | 1,655,000 | 1,446,418 |
| 10/1/2006 | 1,570,000 | 1,446,418 |
| 11/1/2006 | 1,535,000 | 1,446,418 |
| 12/1/2006 | 1,638,000 | 1,446,418 |
| 1/1/2007 | 1,626,000 | 1,446,418 |
| 2/1/2007 | 1,598,000 | 1,446,418 |
| 3/1/2007 | 1,596,000 | 1,446,418 |
| 4/1/2007 | 1,470,000 | 1,446,418 |
| 5/1/2007 | 1,493,000 | 1,446,418 |
| 6/1/2007 | 1,407,000 | 1,446,418 |
| 7/1/2007 | 1,361,000 | 1,446,418 |
| 8/1/2007 | 1,321,000 | 1,446,418 |
| 9/1/2007 | 1,261,000 | 1,446,418 |
| 10/1/2007 | 1,192,000 | 1,446,418 |
| 11/1/2007 | 1,224,000 | 1,446,418 |
| 12/1/2007 | 1,149,000 | 1,446,418 |
| 1/1/2008 | 1,094,000 | 1,446,418 |
| 2/1/2008 | 1,014,000 | 1,446,418 |
| 3/1/2008 | 967,000 | 1,446,418 |
| 4/1/2008 | 1,008,000 | 1,446,418 |
| 5/1/2008 | 995,000 | 1,446,418 |
| 6/1/2008 | 1,180,000 | 1,446,418 |
| 7/1/2008 | 921,000 | 1,446,418 |
| 8/1/2008 | 858,000 | 1,446,418 |
| 9/1/2008 | 797,000 | 1,446,418 |
| 10/1/2008 | 736,000 | 1,446,418 |
| 11/1/2008 | 626,000 | 1,446,418 |
| 12/1/2008 | 554,000 | 1,446,418 |
| 1/1/2009 | 545,000 | 1,446,418 |
| 2/1/2009 | 558,000 | 1,446,418 |
| 3/1/2009 | 513,000 | 1,446,418 |
| 4/1/2009 | 521,000 | 1,446,418 |
| 5/1/2009 | 556,000 | 1,446,418 |
| 6/1/2009 | 601,000 | 1,446,418 |
| 7/1/2009 | 595,000 | 1,446,418 |
| 8/1/2009 | 616,000 | 1,446,418 |
| 9/1/2009 | 609,000 | 1,446,418 |
| 10/1/2009 | 583,000 | 1,446,418 |
| 11/1/2009 | 623,000 | 1,446,418 |
| 12/1/2009 | 664,000 | 1,446,418 |
| 1/1/2010 | 636,000 | 1,446,418 |
| 2/1/2010 | 650,000 | 1,446,418 |
| 3/1/2010 | 687,000 | 1,446,418 |
| 4/1/2010 | 637,000 | 1,446,418 |
| 5/1/2010 | 575,000 | 1,446,418 |
| 6/1/2010 | 587,000 | 1,446,418 |
| 7/1/2010 | 579,000 | 1,446,418 |
| 8/1/2010 | 580,000 | 1,446,418 |
| 9/1/2010 | 563,000 | 1,446,418 |
| 10/1/2010 | 558,000 | 1,446,418 |
| 11/1/2010 | 560,000 | 1,446,418 |
| 12/1/2010 | 632,000 | 1,446,418 |
| 1/1/2011 | 576,000 | 1,446,418 |
| 2/1/2011 | 542,000 | 1,446,418 |
| 3/1/2011 | 583,000 | 1,446,418 |
| 4/1/2011 | 581,000 | 1,446,418 |
| 5/1/2011 | 618,000 | 1,446,418 |
| 6/1/2011 | 636,000 | 1,446,418 |
| 7/1/2011 | 621,000 | 1,446,418 |
| 8/1/2011 | 647,000 | 1,446,418 |
| 9/1/2011 | 610,000 | 1,446,418 |
| 10/1/2011 | 671,000 | 1,446,418 |
| 11/1/2011 | 706,000 | 1,446,418 |
| 12/1/2011 | 697,000 | 1,446,418 |
| 1/1/2012 | 712,000 | 1,446,418 |
| 2/1/2012 | 738,000 | 1,446,418 |
| 3/1/2012 | 806,000 | 1,446,418 |
| 4/1/2012 | 732,000 | 1,446,418 |
| 5/1/2012 | 796,000 | 1,446,418 |
| 6/1/2012 | 794,000 | 1,446,418 |
| 7/1/2012 | 849,000 | 1,446,418 |
| 8/1/2012 | 840,000 | 1,446,418 |
| 9/1/2012 | 930,000 | 1,446,418 |
| 10/1/2012 | 887,000 | 1,446,418 |
| 11/1/2012 | 917,000 | 1,446,418 |
| 12/1/2012 | 941,000 | 1,446,418 |
| 1/1/2013 | 940,000 | 1,446,418 |
| 2/1/2013 | 980,000 | 1,446,418 |
| 3/1/2013 | 936,000 | 1,446,418 |
| 4/1/2013 | 1,012,000 | 1,446,418 |
| 5/1/2013 | 1,003,000 | 1,446,418 |
| 6/1/2013 | 942,000 | 1,446,418 |
| 7/1/2013 | 997,000 | 1,446,418 |
| 8/1/2013 | 964,000 | 1,446,418 |
| 9/1/2013 | 1,004,000 | 1,446,418 |
| 10/1/2013 | 1,044,000 | 1,446,418 |
| 11/1/2013 | 1,029,000 | 1,446,418 |
| 12/1/2013 | 1,005,000 | 1,446,418 |
| 1/1/2014 | 976,000 | 1,446,418 |
| 2/1/2014 | 1,039,000 | 1,446,418 |
| 3/1/2014 | 1,067,000 | 1,446,418 |
| 4/1/2014 | 1,090,000 | 1,446,418 |
| 5/1/2014 | 1,018,000 | 1,446,418 |
| 6/1/2014 | 1,010,000 | 1,446,418 |
| 7/1/2014 | 1,076,000 | 1,446,418 |
| 8/1/2014 | 1,047,000 | 1,446,418 |
| 9/1/2014 | 1,077,000 | 1,446,418 |
| 10/1/2014 | 1,094,000 | 1,446,418 |
| 11/1/2014 | 1,059,000 | 1,446,418 |
| 12/1/2014 | 1,072,000 | 1,446,418 |
| 1/1/2015 | 1,049,000 | 1,446,418 |
| 2/1/2015 | 1,127,000 | 1,446,418 |
| 3/1/2015 | 1,072,000 | 1,446,418 |
| 4/1/2015 | 1,166,000 | 1,446,418 |
| 5/1/2015 | 1,272,000 | 1,446,418 |
| 6/1/2015 | 1,379,000 | 1,446,418 |
| 7/1/2015 | 1,140,000 | 1,446,418 |
| 8/1/2015 | 1,165,000 | 1,446,418 |
| 9/1/2015 | 1,144,000 | 1,446,418 |
| 10/1/2015 | 1,160,000 | 1,446,418 |
| 11/1/2015 | 1,244,000 | 1,446,418 |
| 12/1/2015 | 1,211,000 | 1,446,418 |
| 1/1/2016 | 1,171,000 | 1,446,418 |
| 2/1/2016 | 1,172,000 | 1,446,418 |
| 3/1/2016 | 1,118,000 | 1,446,418 |
| 4/1/2016 | 1,160,000 | 1,446,418 |
| 5/1/2016 | 1,205,000 | 1,446,418 |
| 6/1/2016 | 1,208,000 | 1,446,418 |
| 7/1/2016 | 1,198,000 | 1,446,418 |
| 8/1/2016 | 1,201,000 | 1,446,418 |
| 9/1/2016 | 1,303,000 | 1,446,418 |
| 10/1/2016 | 1,254,000 | 1,446,418 |
| 11/1/2016 | 1,230,000 | 1,446,418 |
| 12/1/2016 | 1,248,000 | 1,446,418 |
| 1/1/2017 | 1,303,000 | 1,446,418 |
| 2/1/2017 | 1,234,000 | 1,446,418 |
| 3/1/2017 | 1,272,000 | 1,446,418 |
| 4/1/2017 | 1,251,000 | 1,446,418 |
| 5/1/2017 | 1,208,000 | 1,446,418 |
| 6/1/2017 | 1,353,000 | 1,446,418 |
| 7/1/2017 | 1,256,000 | 1,446,418 |
| 8/1/2017 | 1,319,000 | 1,446,418 |
| 9/1/2017 | 1,273,000 | 1,446,418 |
| 10/1/2017 | 1,356,000 | 1,446,418 |
| 11/1/2017 | 1,299,000 | 1,446,418 |
| 12/1/2017 | 1,311,000 | 1,446,418 |
| 1/1/2018 | 1,317,000 | 1,446,418 |
| 2/1/2018 | 1,321,000 | 1,446,418 |
| 3/1/2018 | 1,385,000 | 1,446,418 |
| 4/1/2018 | 1,378,000 | 1,446,418 |
| 5/1/2018 | 1,338,000 | 1,446,418 |
| 6/1/2018 | 1,345,000 | 1,446,418 |
| 7/1/2018 | 1,334,000 | 1,446,418 |
| 8/1/2018 | 1,273,000 | 1,446,418 |
| 9/1/2018 | 1,314,000 | 1,446,418 |
| 10/1/2018 | 1,272,000 | 1,446,418 |
| 11/1/2018 | 1,340,000 | 1,446,418 |
| 12/1/2018 | 1,317,000 | 1,446,418 |
| 1/1/2019 | 1,254,000 | 1,446,418 |
| 2/1/2019 | 1,286,000 | 1,446,418 |
| 3/1/2019 | 1,295,000 | 1,446,418 |
| 4/1/2019 | 1,322,000 | 1,446,418 |
| 5/1/2019 | 1,347,000 | 1,446,418 |
| 6/1/2019 | 1,299,000 | 1,446,418 |
| 7/1/2019 | 1,379,000 | 1,446,418 |
| 8/1/2019 | 1,482,000 | 1,446,418 |
| 9/1/2019 | 1,469,000 | 1,446,418 |
| 10/1/2019 | 1,523,000 | 1,446,418 |
| 11/1/2019 | 1,535,000 | 1,446,418 |
| 12/1/2019 | 1,443,000 | 1,446,418 |
| 1/1/2020 | 1,495,000 | 1,446,418 |
| 2/1/2020 | 1,455,000 | 1,446,418 |
| 3/1/2020 | 1,346,000 | 1,446,418 |
| 4/1/2020 | 1,076,000 | 1,446,418 |
| 5/1/2020 | 1,250,000 | 1,446,418 |
| 6/1/2020 | 1,334,000 | 1,446,418 |
| 7/1/2020 | 1,546,000 | 1,446,418 |
| 8/1/2020 | 1,533,000 | 1,446,418 |
| 9/1/2020 | 1,636,000 | 1,446,418 |
| 10/1/2020 | 1,613,000 | 1,446,418 |
| 11/1/2020 | 1,703,000 | 1,446,418 |
| 12/1/2020 | 1,752,000 | 1,446,418 |
| 1/1/2021 | 1,855,000 | 1,446,418 |
| 2/1/2021 | 1,711,000 | 1,446,418 |
| 3/1/2021 | 1,756,000 | 1,446,418 |
| 4/1/2021 | 1,721,000 | 1,446,418 |
| 5/1/2021 | 1,703,000 | 1,446,418 |
| 6/1/2021 | 1,654,000 | 1,446,418 |
| 7/1/2021 | 1,658,000 | 1,446,418 |
| 8/1/2021 | 1,736,000 | 1,446,418 |
| 9/1/2021 | 1,640,000 | 1,446,418 |
| 10/1/2021 | 1,707,000 | 1,446,418 |
| 11/1/2021 | 1,765,000 | 1,446,418 |
| 12/1/2021 | 1,919,000 | 1,446,418 |
| 1/1/2022 | 1,920,000 | 1,446,418 |
| 2/1/2022 | 1,857,000 | 1,446,418 |
| 3/1/2022 | 1,868,000 | 1,446,418 |
| 4/1/2022 | 1,859,000 | 1,446,418 |
| 5/1/2022 | 1,704,000 | 1,446,418 |
| 6/1/2022 | 1,737,000 | 1,446,418 |
| 7/1/2022 | 1,703,000 | 1,446,418 |
| 8/1/2022 | 1,557,000 | 1,446,418 |
| 9/1/2022 | 1,600,000 | 1,446,418 |
| 10/1/2022 | 1,594,000 | 1,446,418 |
| 11/1/2022 | 1,401,000 | 1,446,418 |
| 12/1/2022 | 1,410,000 | 1,446,418 |
| 1/1/2023 | 1,410,000 | 1,446,418 |
| 2/1/2023 | 1,618,000 | 1,446,418 |
| 3/1/2023 | 1,480,000 | 1,446,418 |
| 4/1/2023 | 1,474,000 | 1,446,418 |
| 5/1/2023 | 1,575,000 | 1,446,418 |
| 6/1/2023 | 1,464,000 | 1,446,418 |
| 7/1/2023 | 1,522,000 | 1,446,418 |
| 8/1/2023 | 1,561,000 | 1,446,418 |
| 9/1/2023 | 1,537,000 | 1,446,418 |
| 10/1/2023 | 1,528,000 | 1,446,418 |
| 11/1/2023 | 1,503,000 | 1,446,418 |
| 12/1/2023 | 1,519,000 | 1,446,418 |
| 1/1/2024 | 1,545,000 | 1,446,418 |
| 2/1/2024 | 1,577,000 | 1,446,418 |
| 3/1/2024 | 1,476,000 | 1,446,418 |
| 4/1/2024 | 1,459,000 | 1,446,418 |
| 5/1/2024 | 1,407,000 | 1,446,418 |
| 6/1/2024 | 1,461,000 | 1,446,418 |
| 7/1/2024 | 1,436,000 | 1,446,418 |
| 8/1/2024 | 1,476,000 | 1,446,418 |
| 9/1/2024 | 1,434,000 | 1,446,418 |
| 10/1/2024 | 1,428,000 | 1,446,418 |
| 11/1/2024 | 1,508,000 | 1,446,418 |
| 12/1/2024 | 1,480,000 | 1,446,418 |
| 1/1/2025 | 1,460,000 | 1,446,418 |
| 2/1/2025 | 1,454,000 | 1,446,418 |
| 3/1/2025 | 1,481,000 | 1,446,418 |
| 4/1/2025 | 1,422,000 | 1,446,418 |
| 5/1/2025 | 1,393,000 | 1,446,418 |
In 2024, approximately 1.48 million new homes were authorized by building permits—just slightly above the pre-2008 historical average of 1.45 million units per year. While this figure suggests recent construction activity has returned to long-term norms, it overlooks the impact of more than a decade of underbuilding that followed the 2008 housing market collapse.
During the Great Recession and its aftermath, new home construction plummeted from a peak of 2.26 million units per year in mid-2005 to a low of just over half a million units at the beginning of 2009. From 2009 through most of the 2010s, investment in new housing remained well below historical averages, leaving a significant gap between housing supply and population growth. This period of underinvestment has had lasting effects. Although residential building permits have returned to historical norms, activity has declined notably since 2022 and remains insufficient to close the nation’s housing deficit.
Pricing out new residential builds?
Get faster, more reliable numbers with estimating software built for residential contractors.
How Long Do New Homes Take to Build?
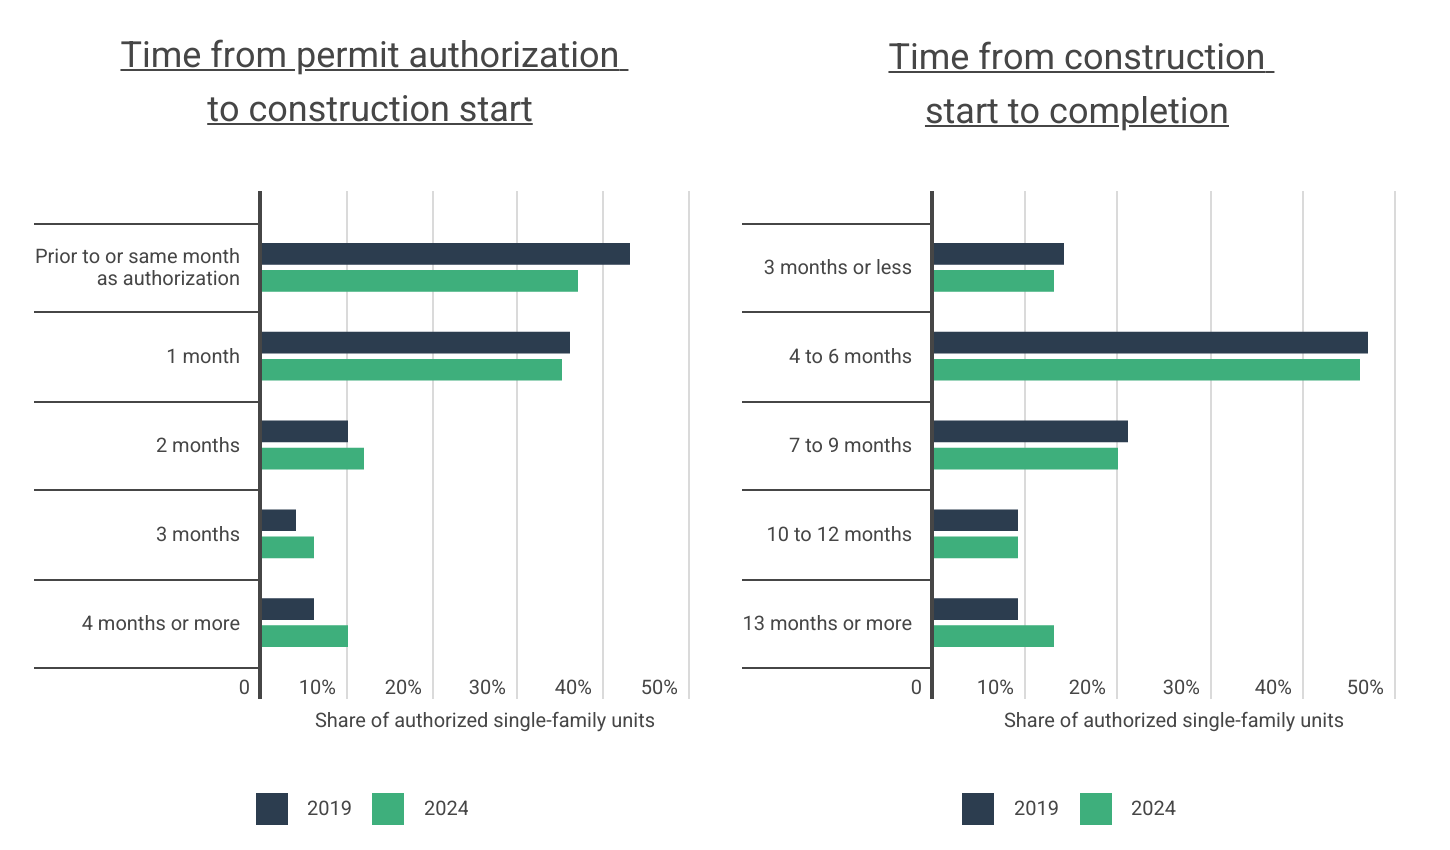
After obtaining necessary permits, the typical new home takes 4–6 months to complete
Data: New Home Construction Timeline Breakdown
| Time from permit authorization to construction start | 2019 | 2024 |
|---|---|---|
| Prior to or same month as authorization | 43% | 37% |
| 1 month | 36% | 35% |
| 2 months | 10% | 12% |
| 3 months | 4% | 6% |
| 4 months or more | 6% | 10% |
| Time from construction start to completion | 2019 | 2024 |
|---|---|---|
| 3 months or less | 14% | 13% |
| 4 to 6 months | 47% | 46% |
| 7 to 9 months | 21% | 20% |
| 10 to 12 months | 9% | 9% |
| 13 months or more | 9% | 13% |
After permits are issued, new homes in the U.S. usually take between four and six months to complete. However, even this typical timeline has been increasingly difficult to maintain. Despite a clear need for more housing, the construction industry continues to face challenges that hinder its ability to deliver new units efficiently. Labor shortages, supply chain issues, and elevated material costs have all contributed to slower project timelines and longer delays.
Working with thousands of dollars in equipment?
Tools & equipment insurance helps contractors protect their investment from theft, loss, and damage.
Census Bureau data shows that the time it takes to begin construction after a permit is issued has grown since before the pandemic. In 2019, 43% of single-family homes began construction prior to or in the same month as authorization. By 2024, that share had declined to 37%, while the share of projects taking four months or more to start rose from 6% to 10%. Similar delays are evident in the time it takes to finish construction once it begins. While nearly half (46%) of new single-family homes in 2024 were completed within the typical four- to six-month window, a growing share—13%—took more than 13 months to finish, up from 9% in 2019.
These cumulative delays reduce the pace at which new homes can be delivered to market. Even when permitting numbers are strong, production bottlenecks can constrain the actual number of units available to buy or rent.
Where Are the Most New Homes Being Built?
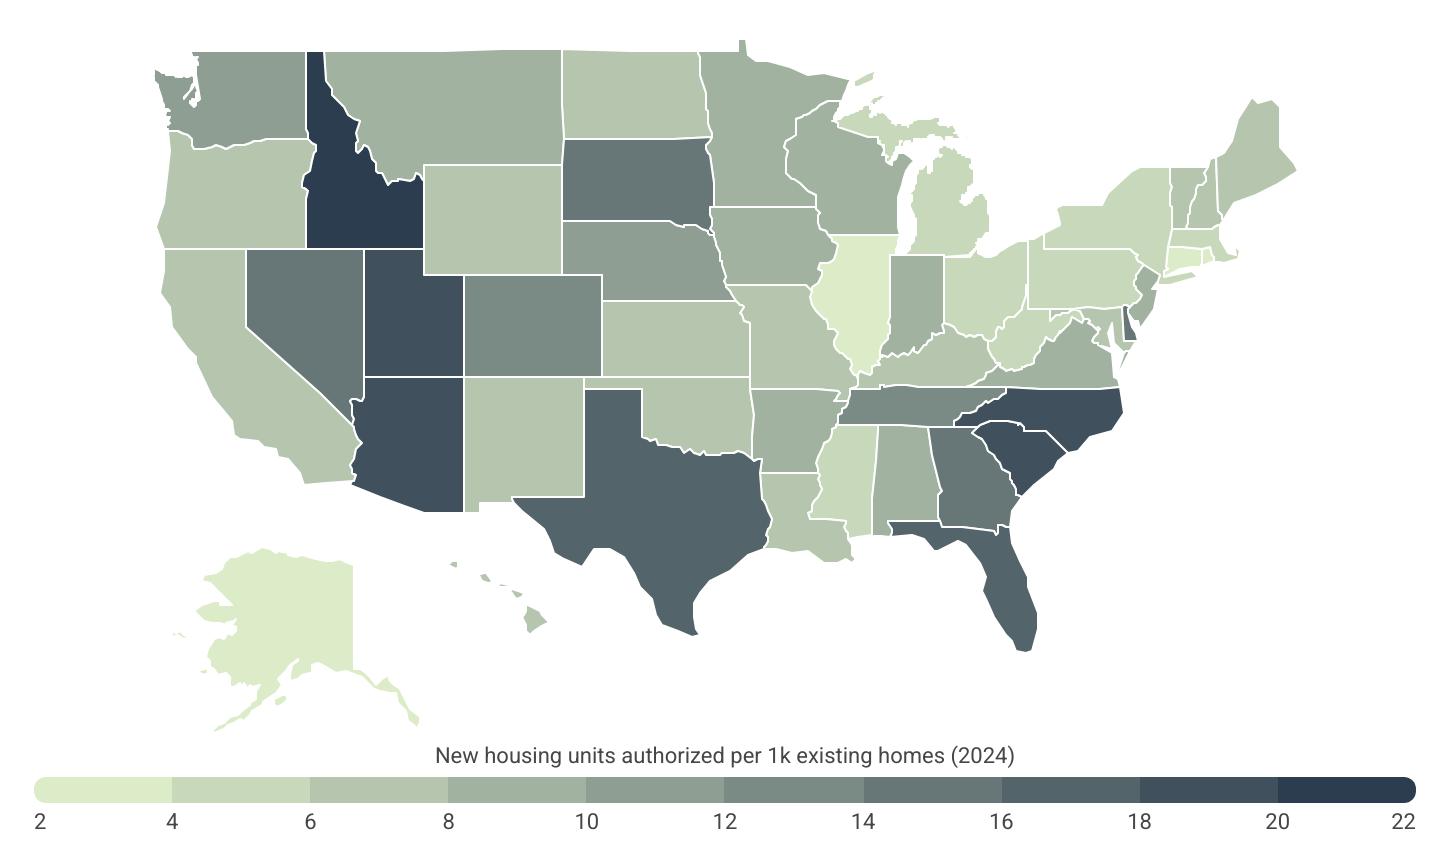
Idaho leads the nation in new home construction, building at a rate 2X faster than the U.S. average
Data: New Housing Units Authorized per 1K Existing Homes by State
| State | New housing units authorized per 1k existing homes (2024) |
|---|---|
| Idaho | 21.2 |
| North Carolina | 18.8 |
| South Carolina | 18.6 |
| Utah | 18.6 |
| Arizona | 18.1 |
| Texas | 17.9 |
| Florida | 16.3 |
| Delaware | 15.0 |
| Georgia | 14.6 |
| Nevada | 14.6 |
| South Dakota | 14.2 |
| Tennessee | 13.8 |
| Colorado | 12.0 |
| Nebraska | 11.9 |
| Washington | 11.1 |
| Montana | 9.9 |
| Arkansas | 9.6 |
| New Jersey | 9.1 |
| Virginia | 9.1 |
| Indiana | 8.8 |
| Alabama | 8.7 |
| Iowa | 8.6 |
| Wisconsin | 8.4 |
| Minnesota | 8.1 |
| Kentucky | 7.9 |
| Maine | 7.9 |
| New Mexico | 7.8 |
| Oregon | 7.7 |
| Vermont | 7.7 |
| Oklahoma | 7.6 |
| New Hampshire | 7.6 |
| Wyoming | 7.6 |
| Kansas | 6.9 |
| California | 6.8 |
| Hawaii | 6.8 |
| Louisiana | 6.7 |
| Missouri | 6.5 |
| Maryland | 6.5 |
| North Dakota | 6.1 |
| Ohio | 5.9 |
| Mississippi | 5.8 |
| New York | 5.4 |
| West Virginia | 4.8 |
| Michigan | 4.7 |
| Massachusetts | 4.7 |
| Pennsylvania | 4.2 |
| Connecticut | 3.8 |
| Illinois | 3.7 |
| Rhode Island | 3.6 |
| Alaska | 3.1 |
While housing construction has slowed in much of the country, some states and metropolitan areas continue to permit new homes at a significantly faster pace than others. In 2024, the national rate of new housing authorization stood at 10.1 units per 1,000 existing homes—down from 11.7 in 2022. Only 13 states saw an increase in the number of new housing units authorized compared to two years prior.
Leading the nation is Idaho, which authorized new housing at a rate of 21.2 units per 1,000 existing homes—more than twice the national average. Other fast-growing states in the Southeast and Mountain West also reported high construction rates. North Carolina and South Carolina, for example, each authorized nearly 19 new homes per 1,000 existing units in 2024. Utah and Arizona followed closely behind, despite year-over-year declines in total permits.
Among the nation’s largest metros, the Raleigh-Cary area in North Carolina ranked first with 28.8 new units per 1,000 existing homes, followed by Austin (28.6) and Dallas-Fort Worth (22.2). Despite recent slowdowns, many of these regions remain among the nation’s top markets for new housing development, reflecting ongoing demand and more favorable building conditions.
Bidding on large-scale housing developments?
Most public and large-scale residential projects require surety bonds to guarantee job completion and payment. Learn what’s required before you bid.
Below is a complete breakdown of the pace of new home construction for over 370 metropolitan areas and all 50 states. The analysis was conducted by Construction Coverage, using data from the U.S. Census Bureau and Zillow. For more information, see the methodology section.
Cities Building the Most Homes
| Top Large Metros | Units* |
|---|---|
| 1. Raleigh-Cary, NC | 28.8 |
| 2. Austin-Round Rock-San Marcos, TX | 28.6 |
| 3. Dallas-Fort Worth-Arlington, TX | 22.2 |
| 4. Houston-Pasadena-The Woodlands, TX | 21.6 |
| 5. Phoenix-Mesa-Chandler, AZ | 21.4 |
| 6. Charlotte-Concord-Gastonia, NC-SC | 21.3 |
| 7. Nashville-Davidson–Murfreesboro–Franklin, TN | 21.1 |
| 8. Orlando-Kissimmee-Sanford, FL | 20.2 |
| 9. Jacksonville, FL | 19.4 |
| 10. Atlanta-Sandy Springs-Roswell, GA | 15.8 |
| 11. Las Vegas-Henderson-North Las Vegas, NV | 15.1 |
| 12. Columbus, OH | 14.7 |
| 13. Richmond, VA | 14.7 |
| 14. San Antonio-New Braunfels, TX | 13.6 |
| 15. Tampa-St. Petersburg-Clearwater, FL | 13.4 |
| Bottom Large Metros | Units* |
|---|---|
| 1. Buffalo-Cheektowaga, NY | 2.5 |
| 2. San Francisco-Oakland-Fremont, CA | 3.1 |
| 3. Providence-Warwick, RI-MA | 3.6 |
| 4. Rochester, NY | 3.7 |
| 5. Hartford-West Hartford-East Hartford, CT | 3.7 |
| 6. Detroit-Warren-Dearborn, MI | 4.0 |
| 7. Urban Honolulu, HI | 4.3 |
| 8. Pittsburgh, PA | 4.6 |
| 9. Chicago-Naperville-Elgin, IL-IN | 4.6 |
| 10. Baltimore-Columbia-Towson, MD | 5.2 |
| 11. Boston-Cambridge-Newton, MA-NH | 5.4 |
| 12. Philadelphia-Camden-Wilmington, PA-NJ-DE-MD | 5.4 |
| 13. St. Louis, MO-IL | 5.5 |
| 14. Los Angeles-Long Beach-Anaheim, CA | 5.5 |
| 15. San Jose-Sunnyvale-Santa Clara, CA | 5.6 |
| Top Midsize Metros | Units* |
|---|---|
| 1. Wilmington, NC | 35.6 |
| 2. Ocala, FL | 33.7 |
| 3. Cape Coral-Fort Myers, FL | 33.1 |
| 4. Fayetteville-Springdale-Rogers, AR | 32.0 |
| 5. Myrtle Beach-Conway-North Myrtle Beach, SC | 31.8 |
| 6. North Port-Bradenton-Sarasota, FL | 28.9 |
| 7. Lakeland-Winter Haven, FL | 28.5 |
| 8. Provo-Orem-Lehi, UT | 27.9 |
| 9. Boise City, ID | 26.7 |
| 10. Asheville, NC | 25.5 |
| 11. McAllen-Edinburg-Mission, TX | 22.7 |
| 12. Huntsville, AL | 22.3 |
| 13. Charleston-North Charleston, SC | 21.6 |
| 14. Port St. Lucie, FL | 21.5 |
| 15. Savannah, GA | 21.5 |
| Bottom Midsize Metros | Units* |
|---|---|
| 1. Peoria, IL | 1.4 |
| 2. Youngstown-Warren, OH | 1.4 |
| 3. Springfield, MA | 2.2 |
| 4. Scranton–Wilkes-Barre, PA | 2.2 |
| 5. Reading, PA | 2.3 |
| 6. Flint, MI | 2.3 |
| 7. Anchorage, AK | 2.5 |
| 8. Canton-Massillon, OH | 2.9 |
| 9. Lansing-East Lansing, MI | 3.1 |
| 10. Syracuse, NY | 3.1 |
| 11. Toledo, OH | 3.3 |
| 12. New Orleans-Metairie, LA | 3.4 |
| 13. Huntington-Ashland, WV-KY-OH | 3.5 |
| 14. Akron, OH | 4.0 |
| 15. New Haven, CT | 4.1 |
| Top Small Metros | Units* |
|---|---|
| 1. Idaho Falls, ID | 40.7 |
| 2. Punta Gorda, FL | 35.9 |
| 3. St. George, UT | 35.6 |
| 4. Sherman-Denison, TX | 32.2 |
| 5. Burlington, NC | 30.5 |
| 6. Daphne-Fairhope-Foley, AL | 27.7 |
| 7. Gainesville, GA | 27.7 |
| 8. Homosassa Springs, FL | 27.6 |
| 9. Bowling Green, KY | 27.4 |
| 10. Greeley, CO | 25.1 |
| 11. Hilton Head Island-Bluffton-Port Royal, SC | 24.5 |
| 12. Crestview-Fort Walton Beach-Destin, FL | 23.9 |
| 13. Panama City-Panama City Beach, FL | 21.6 |
| 14. Hinesville, GA | 21.3 |
| 15. Rapid City, SD | 21.1 |
| Bottom Small Metros | Units* |
|---|---|
| 1. Wheeling, WV-OH | 0.1 |
| 2. Morgantown, WV | 0.2 |
| 3. Weirton-Steubenville, WV-OH | 0.3 |
| 4. Fairbanks-College, AK | 0.4 |
| 5. Enid, OK | 0.7 |
| 6. Bay City, MI | 0.7 |
| 7. Victoria, TX | 1.0 |
| 8. Johnstown, PA | 1.0 |
| 9. Charleston, WV | 1.0 |
| 10. Decatur, IL | 1.2 |
| 11. Williamsport, PA | 1.2 |
| 12. Beckley, WV | 1.3 |
| 13. St. Joseph, MO-KS | 1.5 |
| 14. Battle Creek, MI | 1.5 |
| 15. Farmington, NM | 1.6 |
States Building the Most Homes
| Top States | Units* |
|---|---|
| 1. Idaho | 21.2 |
| 2. North Carolina | 18.8 |
| 3. South Carolina | 18.6 |
| 4. Utah | 18.6 |
| 5. Arizona | 18.1 |
| 6. Texas | 17.9 |
| 7. Florida | 16.3 |
| 8. Delaware | 15.0 |
| 9. Georgia | 14.6 |
| 10. Nevada | 14.6 |
| 11. South Dakota | 14.2 |
| 12. Tennessee | 13.8 |
| 13. Colorado | 12.0 |
| 14. Nebraska | 11.9 |
| 15. Washington | 11.1 |
| Bottom States | Units* |
|---|---|
| 1. Alaska | 3.1 |
| 2. Rhode Island | 3.6 |
| 3. Illinois | 3.7 |
| 4. Connecticut | 3.8 |
| 5. Pennsylvania | 4.2 |
| 6. Massachusetts | 4.7 |
| 7. Michigan | 4.7 |
| 8. West Virginia | 4.8 |
| 9. New York | 5.4 |
| 10. Mississippi | 5.8 |
| 11. Ohio | 5.9 |
| 12. North Dakota | 6.1 |
| 13. Maryland | 6.5 |
| 14. Missouri | 6.5 |
| 15. Louisiana | 6.7 |
*New housing units authorized per 1k existing homes (2024)
Full Results
Methodology
To determine the locations building the most homes, researchers at Construction Coverage analyzed data from the U.S. Census Bureau’s 2024 Building Permit Survey, U.S. Census Bureau’s 2024 Population and Housing Unit Estimates, and Zillow’s Zillow Home Value Index (ZHVI). The researchers ranked locations according to the number of new housing units authorized per 1,000 existing homes in 2024. In the event of a tie, the location with the higher total new housing units authorized in 2024 was ranked higher. Researchers also calculated the number of new housing units authorized per 1,000 existing homes in 2022, the total new housing units authorized in 2022, the percentage change in housing units authorized from 2022 to 2024, and the median home price in May 2024.
For relevance, only metropolitan areas with available data were included in the analysis. Additionally, metro areas were grouped into the following cohorts based on population size:
- Small metros: less than 350,000
- Midsize metros: 350,000–999,999
- Large metros: 1,000,000 or more
Reference
- U.S. Census Bureau and U.S. Department of Housing and Urban Development (April 23, 2025). Median Sales Price of Houses Sold for the United States. https://fred.stlouisfed.org/series/MSPUS.
- Patel, E.; Rajan, A.; Tomeh, N. (November 26, 2024). Make it count: Measuring our housing supply shortage. The Brookings Institution. https://www.brookings.edu/articles/make-it-count-measuring-our-housing-supply-shortage/.
- Realtor.com (June 5, 2025). Housing Inventory: Active Listing Count in the United States. https://fred.stlouisfed.org/series/ACTLISCOUUS.
- National Association of Home Builders (2025). NAHB/Wells Fargo Housing Market Index (HMI). https://www.nahb.org/news-and-economics/housing-economics/indices/housing-market-index.
- U.S. Census Bureau (2024). Building Permits Survey. https://www.census.gov/construction/bps/index.html.
- U.S. Census Bureau (2024). Population and Housing Unit Estimates. https://www.census.gov/programs-surveys/popest.html.
- Zillow (2025). Zillow Home Value Index. https://www.zillow.com/research/data/.