
Cities With the Highest Home Price-to-Income Ratios
Note: This is the most recent release of our Cities With the Highest Home Price-to-Income Ratios study. To see data from prior years, please visit the Full Results section below.
One of the major economic stories in recent years has been the lasting impact of inflation. While year-over-year wage growth in the U.S. remains above pre-pandemic levels, the benefit of rising wages for most households has been limited by increasing prices in many consumer categories. The U.S. Bureau of Labor Statistics is still reporting price increases of nearly 3%—notably above the 2% target inflation rate. Recent increases in the CPI primarily came from increases in the cost of dining out, utilities, and shelter.
The latter category tends to be a major pressure on household incomes. Housing is the largest regular expenditure for most households, so the failure of wages to keep up with housing prices can be especially burdensome. And since the onset of the pandemic, housing prices have skyrocketed, with the cost of homes sold in the U.S. increasing by approximately 45%.
Changes in Home Prices and Household Incomes
Household incomes have failed to keep up with increasing home prices
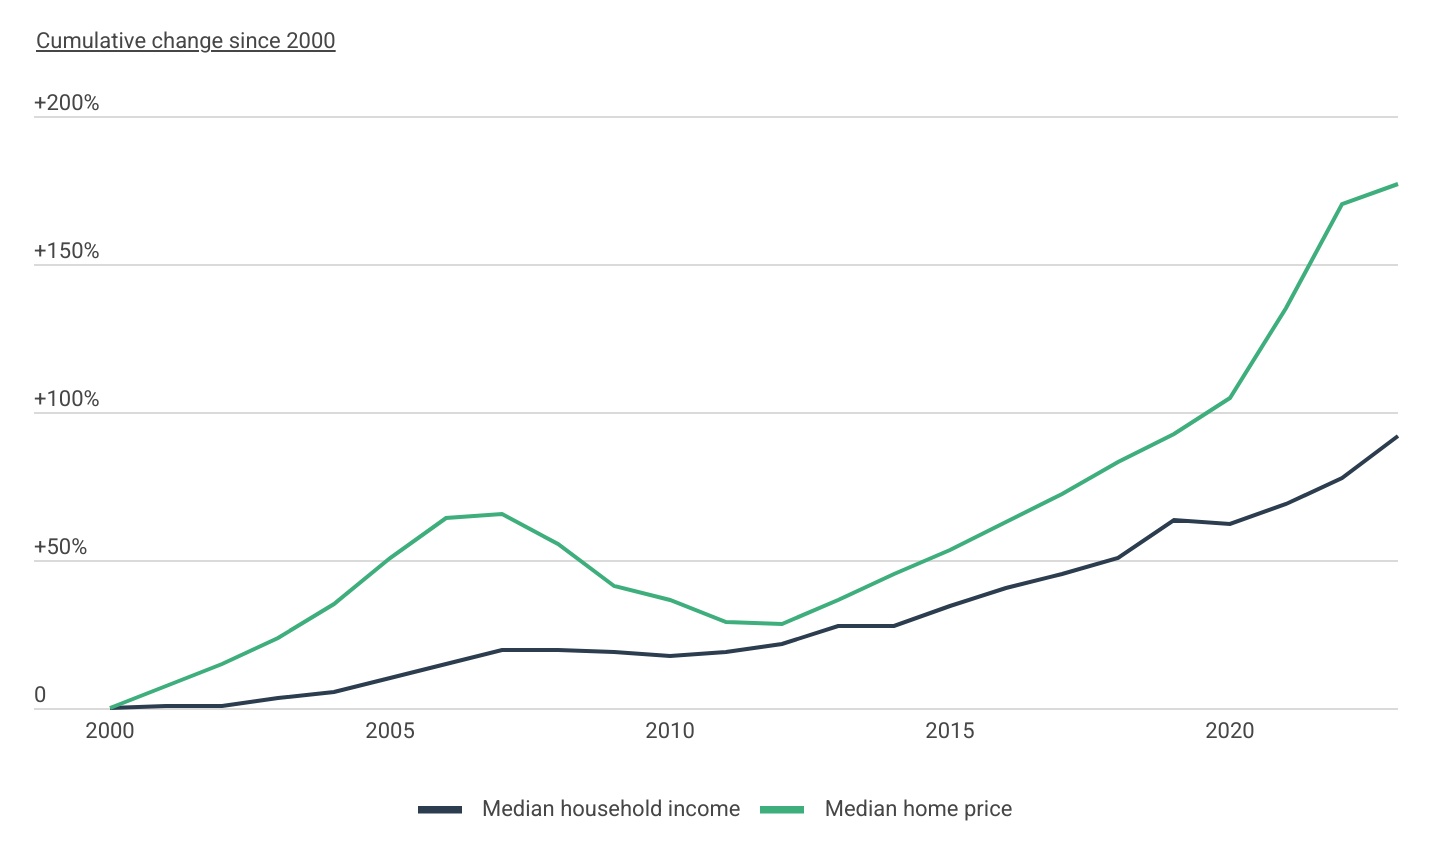
Data: Change in Home Prices vs. Household Income Since 2000
| Date | Change in median household income | Change in median home price |
|---|---|---|
| 2000 | 0.0% | 0.0% |
| 2001 | +0.6% | +7.3% |
| 2002 | +1.0% | +14.7% |
| 2003 | +3.2% | +23.5% |
| 2004 | +5.6% | +35.1% |
| 2005 | +10.3% | +50.9% |
| 2006 | +14.8% | +64.2% |
| 2007 | +19.6% | +65.8% |
| 2008 | +19.8% | +55.5% |
| 2009 | +18.6% | +41.2% |
| 2010 | +17.4% | +36.4% |
| 2011 | +19.2% | +29.2% |
| 2012 | +21.5% | +28.1% |
| 2013 | +27.6% | +36.3% |
| 2014 | +27.8% | +45.5% |
| 2015 | +34.6% | +53.3% |
| 2016 | +40.6% | +62.6% |
| 2017 | +45.6% | +72.4% |
| 2018 | +50.5% | +83.3% |
| 2019 | +63.6% | +92.5% |
| 2020 | +62.0% | +104.5% |
| 2021 | +68.6% | +135.4% |
| 2022 | +77.6% | +170.4% |
| 2023 | +92.0% | +176.9% |
The gap between income growth and rising housing costs isn’t new—it’s been widening for decades. Since 2000, median household income in the U.S. has grown by 92%, climbing from $41,990 to $80,610. But during that same period, median home prices have nearly tripled, jumping 177% from $122,775 to $339,937, according to data from the U.S. Census Bureau and Zillow. On an inflation-adjusted basis, household incomes increased by just 8.5% since 2000, while home prices increased by more than 56%.
Geographical Differences in Home Price Growth
Home prices in the Mountain West, New England, and South Atlantic are growing the fastest
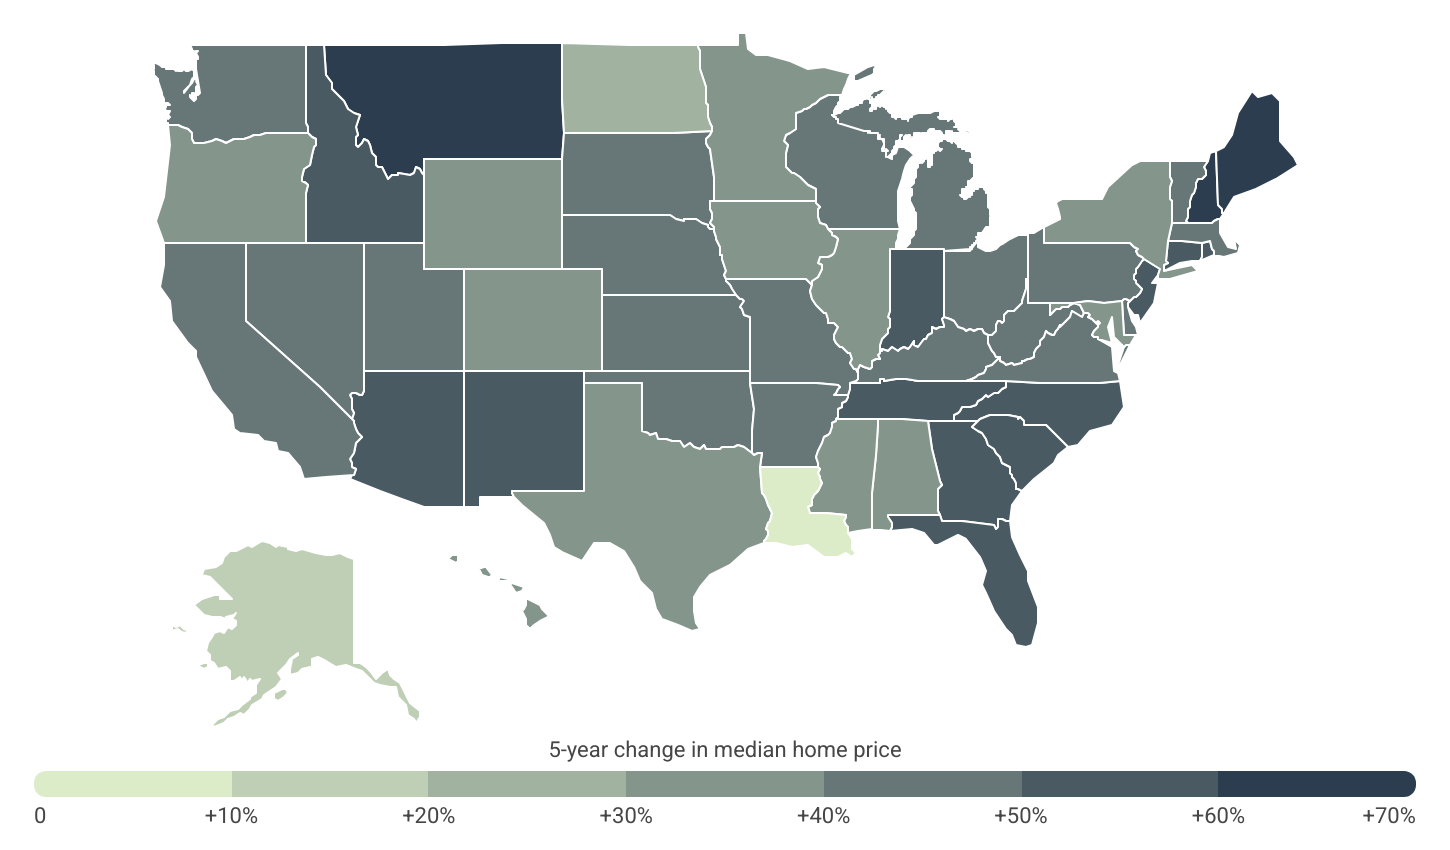
Data: Home Price Growth by U.S. State
| State | 5-year change in median home price |
|---|---|
| New Hampshire | +67.3% |
| Montana | +66.5% |
| Maine | +66.4% |
| Connecticut | +58.8% |
| Rhode Island | +57.8% |
| Idaho | +56.5% |
| North Carolina | +56.5% |
| Georgia | +56.3% |
| Florida | +55.4% |
| Tennessee | +54.6% |
| New Jersey | +53.5% |
| New Mexico | +52.3% |
| South Carolina | +52.2% |
| Arizona | +51.9% |
| Indiana | +51.5% |
| Utah | +49.6% |
| Ohio | +49.5% |
| Kansas | +49.2% |
| Kentucky | +48.4% |
| Missouri | +48.2% |
| Wisconsin | +47.6% |
| Massachusetts | +47.5% |
| Oklahoma | +46.3% |
| Nevada | +46.1% |
| South Dakota | +45.4% |
| Washington | +45.1% |
| Vermont | +44.4% |
| Nebraska | +44.1% |
| Michigan | +43.9% |
| West Virginia | +43.4% |
| Delaware | +42.8% |
| Virginia | +42.0% |
| California | +41.0% |
| Pennsylvania | +40.7% |
| Arkansas | +40.4% |
| Alabama | +39.9% |
| Wyoming | +39.1% |
| Texas | +38.6% |
| New York | +38.4% |
| Illinois | +38.4% |
| Iowa | +37.2% |
| Hawaii | +36.6% |
| Colorado | +35.7% |
| Oregon | +35.5% |
| Maryland | +32.3% |
| Minnesota | +31.1% |
| Mississippi | +30.6% |
| North Dakota | +20.0% |
| Alaska | +17.8% |
| Louisiana | +8.3% |
In recent years, home prices have climbed rapidly across much of the U.S., but certain regions stand out for especially sharp increases. States in New England have seen some of the fastest growth, led by New Hampshire, where the median home price has jumped 67.3% over the past five years. Maine, Connecticut, and Rhode Island have also experienced significant gains, each with price increases exceeding 57%.
Meanwhile, states in the Mountain West and South Atlantic regions are not far behind. Montana and Idaho have both seen home prices rise by more than 56%, while Southern states like North Carolina, Georgia, Florida, and Tennessee have posted similarly steep gains.
FOR BUILDERS
As a result of ongoing labor shortages, increased material costs, and supply chain disruptions, it’s more important than ever to make sure your business is running efficiently. Choosing the right software can make all the difference. That’s why we’ve handpicked the best construction accounting software and construction management software based on user reviews, features, price, and more.
Price-to-Income Ratio by State
Western states & Hawaii have the most unaffordable homes
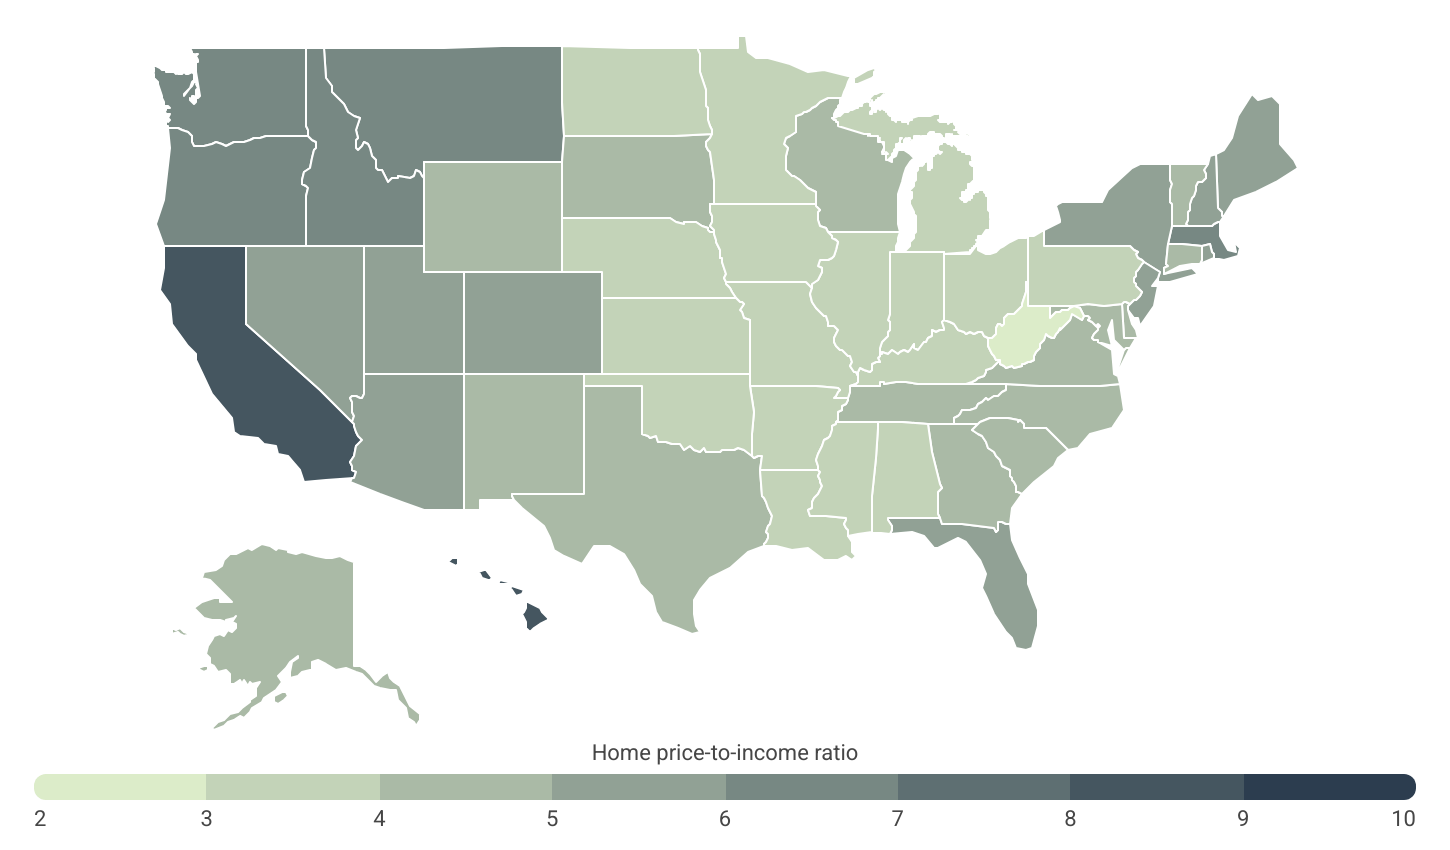
Data: Home Price-to-Income Ratios by U.S. State
| State | Home price-to-income ratio |
|---|---|
| Hawaii | 8.8 |
| California | 8.2 |
| Montana | 6.4 |
| Massachusetts | 6.3 |
| Washington | 6.3 |
| Oregon | 6.2 |
| Idaho | 6.1 |
| Colorado | 5.9 |
| New York | 5.9 |
| Nevada | 5.8 |
| Utah | 5.6 |
| Rhode Island | 5.5 |
| Arizona | 5.5 |
| New Jersey | 5.4 |
| Maine | 5.3 |
| Florida | 5.3 |
| New Hampshire | 5.0 |
| Wyoming | 4.9 |
| New Mexico | 4.9 |
| Delaware | 4.7 |
| Tennessee | 4.7 |
| Vermont | 4.6 |
| North Carolina | 4.6 |
| Connecticut | 4.4 |
| Virginia | 4.4 |
| Georgia | 4.4 |
| Maryland | 4.3 |
| Alaska | 4.3 |
| South Carolina | 4.3 |
| South Dakota | 4.2 |
| Wisconsin | 4.1 |
| Texas | 4.0 |
| Minnesota | 3.9 |
| Pennsylvania | 3.6 |
| Missouri | 3.6 |
| Alabama | 3.6 |
| North Dakota | 3.5 |
| Nebraska | 3.5 |
| Michigan | 3.5 |
| Indiana | 3.5 |
| Kentucky | 3.5 |
| Arkansas | 3.5 |
| Ohio | 3.4 |
| Louisiana | 3.4 |
| Illinois | 3.3 |
| Oklahoma | 3.3 |
| Mississippi | 3.3 |
| Kansas | 3.2 |
| Iowa | 3.0 |
| West Virginia | 2.9 |
While sharp increases in home prices over the past five years have worsened affordability in many parts of the country, the most unaffordable states overall aren’t necessarily the ones with the biggest recent price spikes. In fact, several of the states that top the list for housing unaffordability have had relatively modest home price growth in recent years compared to other states. However, their home prices were already exceptionally high to begin with.
For example, both California and Hawaii experienced below-average growth in median home prices over the last five years (41.0% and 36.6%, respectively), yet they remain the most unaffordable states in the U.S. with price-to-income ratios of 8.2 and 8.8. These high ratios indicate that even with moderate recent price increases, housing remains out of reach for many residents.
On the other hand, states like Montana and Idaho have become significantly less affordable due to rapid home price growth since 2020. Both states saw median home prices jump more than 56% over five years, pushing their price-to-income ratios above 6.0—among the highest in the nation. Overall, several Mountain West and western states now rank among the most unaffordable in the U.S. by this metric. The national price-to-income ratio is 4.6, but the top 10 states—eight of which are in the West—have ratios of 5.8 or higher.
At the city level, the situation is even more extreme. Five of the six large U.S. cities with the highest price-to-income ratios are in California—underscoring the state’s persistent affordability crisis. Los Angeles, San Jose, Long Beach, San Francisco, and San Diego all top the list, with ratios ranging from 9.6 to 12.2. Beyond California, other major cities facing similar pressures include New York City, Miami, and Boston, where home prices still far outpace local incomes.
Below is a breakdown of price-to-income ratios for over 350 cities and all 50 states. The analysis was conducted by Construction Coverage, using data from Zillow and the U.S. Census Bureau. For more detailed information, refer to the methodology section.
Cities With the Highest Price-to-Income Ratios
| Top Large Cities | Ratio* |
|---|---|
| 1. Los Angeles, CA | 12.2 |
| 2. San Jose, CA | 11.0 |
| 3. Long Beach, CA | 10.4 |
| 4. San Francisco, CA | 10.0 |
| 5. New York, NY | 10.0 |
| 6. San Diego, CA | 9.6 |
| 7. Miami, FL | 8.5 |
| 8. Boston, MA | 7.7 |
| 9. Oakland, CA | 7.7 |
| 10. Seattle, WA | 7.2 |
| 11. Portland, OR | 6.2 |
| 12. Denver, CO | 5.9 |
| 13. Tucson, AZ | 5.9 |
| 14. Las Vegas, NV | 5.8 |
| 15. Austin, TX | 5.7 |
| Bottom Large Cities | Ratio* |
|---|---|
| 1. Detroit, MI | 1.9 |
| 2. Cleveland, OH | 2.8 |
| 3. Memphis, TN | 2.8 |
| 4. Oklahoma City, OK | 3.0 |
| 5. Baltimore, MD | 3.1 |
| 6. Wichita, KS | 3.2 |
| 7. Indianapolis, IN | 3.3 |
| 8. Tulsa, OK | 3.5 |
| 9. Philadelphia, PA | 3.6 |
| 10. Kansas City, MO | 3.6 |
| 11. Milwaukee, WI | 3.8 |
| 12. El Paso, TX | 3.9 |
| 13. Columbus, OH | 3.9 |
| 14. Omaha, NE | 3.9 |
| 15. Fort Worth, TX | 3.9 |
| Top Midsize Cities | Ratio* |
|---|---|
| 1. Glendale, CA | 14.8 |
| 2. Irvine, CA | 12.4 |
| 3. Sunnyvale, CA | 11.5 |
| 4. Anaheim, CA | 11.1 |
| 5. Huntington Beach, CA | 11.0 |
| 6. Santa Ana, CA | 10.0 |
| 7. Bellevue, WA | 9.5 |
| 8. Fremont, CA | 9.4 |
| 9. Salinas, CA | 9.2 |
| 10. Urban Honolulu, HI | 9.1 |
| 11. Oceanside, CA | 8.9 |
| 12. Newark, NJ | 8.8 |
| 13. Paterson, NJ | 8.7 |
| 14. Oxnard, CA | 8.6 |
| 15. Hialeah, FL | 8.2 |
| Bottom Midsize Cities | Ratio* |
|---|---|
| 1. Montgomery, AL | 2.5 |
| 2. Toledo, OH | 2.6 |
| 3. Akron, OH | 2.6 |
| 4. Shreveport, LA | 2.7 |
| 5. Birmingham, AL | 2.8 |
| 6. Columbus, GA | 3.1 |
| 7. Macon-Bibb County, GA | 3.1 |
| 8. St. Louis, MO | 3.1 |
| 9. Augusta-Richmond County, GA | 3.3 |
| 10. Amarillo, TX | 3.3 |
| 11. Des Moines, IA | 3.3 |
| 12. Corpus Christi, TX | 3.3 |
| 13. Pittsburgh, PA | 3.4 |
| 14. Little Rock, AR | 3.5 |
| 15. Laredo, TX | 3.5 |
| Top Small Cities | Ratio* |
|---|---|
| 1. Bellingham, WA | 12.0 |
| 2. Alhambra, CA | 11.8 |
| 3. Mountain View, CA | 11.5 |
| 4. Tustin, CA | 11.1 |
| 5. San Mateo, CA | 10.9 |
| 6. Union City, CA | 10.7 |
| 7. Fullerton, CA | 10.6 |
| 8. Inglewood, CA | 10.6 |
| 9. Mission Viejo, CA | 10.1 |
| 10. San Marcos, CA | 10.1 |
| 11. San Leandro, CA | 10.0 |
| 12. South Gate, CA | 9.7 |
| 13. East Los Angeles, CA | 9.7 |
| 14. Orange, CA | 9.6 |
| 15. Vista, CA | 9.6 |
| Bottom Small Cities | Ratio* |
|---|---|
| 1. Jackson, MS | 1.7 |
| 2. Flint, MI | 1.8 |
| 3. Gary, IN | 2.4 |
| 4. Lawton, OK | 2.5 |
| 5. Davenport, IA | 2.5 |
| 6. Albany, GA | 2.7 |
| 7. Waterloo, IA | 2.7 |
| 8. Lansing, MI | 2.7 |
| 9. Wichita Falls, TX | 2.7 |
| 10. Pharr, TX | 2.8 |
| 11. Joliet, IL | 2.8 |
| 12. Cedar Rapids, IA | 2.9 |
| 13. Parma, OH | 2.9 |
| 14. Bolingbrook, IL | 3.0 |
| 15. Kansas City, KS | 3.1 |
States With the Highest Price-to-Income Ratios
| Top States | Ratio* |
|---|---|
| 1. Hawaii | 8.8 |
| 2. California | 8.2 |
| 3. Montana | 6.4 |
| 4. Massachusetts | 6.3 |
| 5. Washington | 6.3 |
| 6. Oregon | 6.2 |
| 7. Idaho | 6.1 |
| 8. Colorado | 5.9 |
| 9. New York | 5.9 |
| 10. Nevada | 5.8 |
| 11. Utah | 5.6 |
| 12. Rhode Island | 5.5 |
| 13. Arizona | 5.5 |
| 14. New Jersey | 5.4 |
| 15. Maine | 5.3 |
| Bottom States | Ratio* |
|---|---|
| 1. West Virginia | 2.9 |
| 2. Iowa | 3.0 |
| 3. Kansas | 3.2 |
| 4. Mississippi | 3.3 |
| 5. Oklahoma | 3.3 |
| 6. Illinois | 3.3 |
| 7. Louisiana | 3.4 |
| 8. Ohio | 3.4 |
| 9. Arkansas | 3.5 |
| 10. Kentucky | 3.5 |
| 11. Indiana | 3.5 |
| 12. Michigan | 3.5 |
| 13. Nebraska | 3.5 |
| 14. North Dakota | 3.5 |
| 15. Alabama | 3.6 |
*Home price-to-income ratio
Full Results
Methodology
The data used in this analysis is from Zillow’s Zillow Home Value Index (ZHVI) and the U.S. Census Bureau’s 2023 American Community Survey. To find the locations with the highest price-to-income ratios, researchers from Construction Coverage ranked locations by the median home price divided by the median annual household income. In the event of a tie, the location with the larger median home price was ranked higher. Home price data reflects the most recent Zillow Home Value Index (ZHVI) as of February 2025, with five-year price changes calculated from February 2020 to February 2025. Median household income figures are from 2023, the most recent year available. To ensure accuracy and relevance, the analysis includes only cities with an income margin of error below 10%. Cities were grouped into three population cohorts: small (fewer than 150,000 residents), midsize (150,000–349,999), and large (350,000 or more).
References
- Economic Policy Institute (2025). Nominal Wage Tracker. https://www.epi.org/nominal-wage-tracker/.
- Board of Governors of the Federal Reserve System (August 27, 2020). Why Does The Federal Reserve Aim For Inflation Of 2 Percent Over The Longer Run?. https://www.federalreserve.gov/faqs/economy_14400.htm.
- U.S. Bureau of Labor Statistics (March 12, 2025). Consumer Price Index News Release. https://www.bls.gov/news.release/archives/cpi_03122025.htm.
- Zillow (2025). Housing Data, Zillow Home Value Index (ZHVI). https://www.zillow.com/research/data/.
- U.S. Census Bureau (2025) American Community Survey (ACS). https://www.census.gov/programs-surveys/acs.