
American Cities With the Largest Drop in Home Sales in 2022
Editor’s Note: This research report was published in 2022, and the data is no longer being updated. It has been kept live for historical reference.
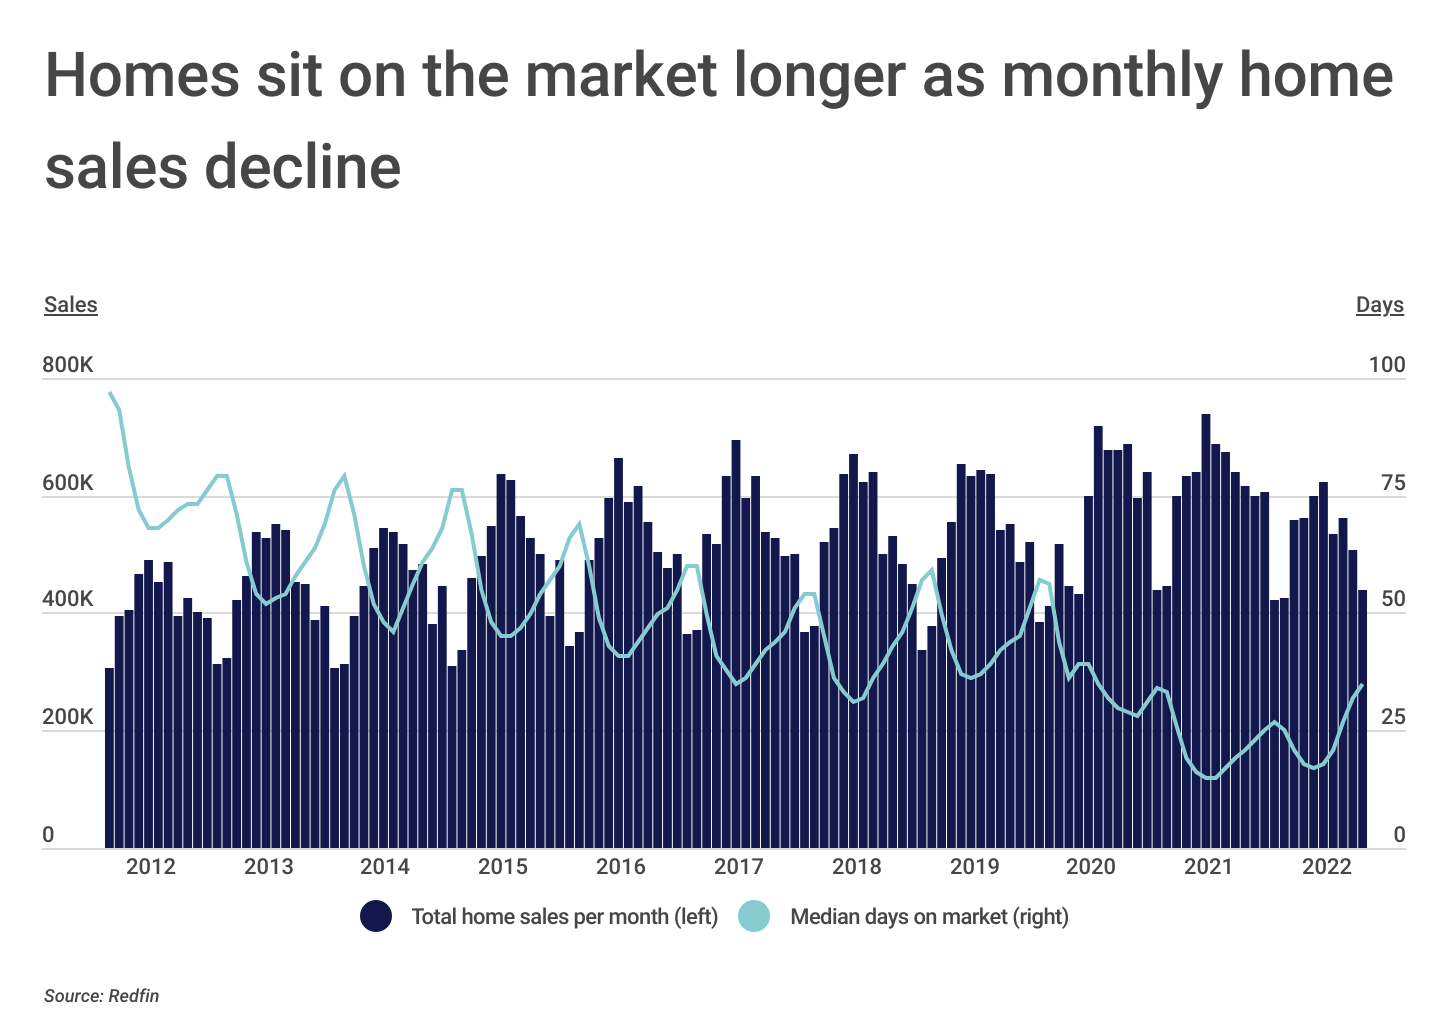
The housing market is entering the traditionally quieter winter season, but recent indicators suggest that the market has already been slowing in the last few months. New listings, pending sales, and prices are all on the decline, signs of rapid cooling after a two-year frenzy in the market.
One of the primary factors driving the slowing of the market has been inflation, including for housing costs. During the COVID-19 pandemic, the median home sale price in the U.S. increased by more than 38%, from $329,000 in the first quarter of 2020 to $454,900 in the third quarter of 2022. And as home prices have rapidly become more expensive, so has everything else: inflation as measured by the Consumer Price Index has topped 5% for 18 straight months, driven by increases in major expenses like food and rent. The effects of inflation have left potential buyers with less ability to save up for a purchase.
Adding to this pressure is an increase in interest rates. The U.S. Federal Reserve has engaged in aggressive rate hikes throughout 2022 to curb inflation, and mortgage lenders have pushed up rates for consumers as a result. The average interest rate for a 30-year fixed rate mortgage has increased from around 3% at the end of 2021 to about 6.5% now. In October, the average 30-year rate briefly passed 7% for the first time since before the Great Recession.
FOR CONSTRUCTION PROFESSIONALS
Construction estimating software helps to streamline the process of creating cost, material, and labor estimates for construction projects. There are many different types of construction cost estimating software available, ranging from simple spreadsheet templates to online collaborative software with robust feature sets.
As a result of these factors, total home sales per month have been down year-over-year for every month in 2022, and the gap between 2021 and 2022 monthly figures has widened as the year has gone on. In October 2022, home sales fell to 439,596—a decline of nearly 30%. As total sales have declined, another important metric—the time homes sit on the market before selling—is on the rise. September was the first month since February 2021 where the median days on market for home listings exceeded 30 days. At the height of the market, the typical listing spent just 15 days on the market, but today the median listing will sit on the market for 35 days.
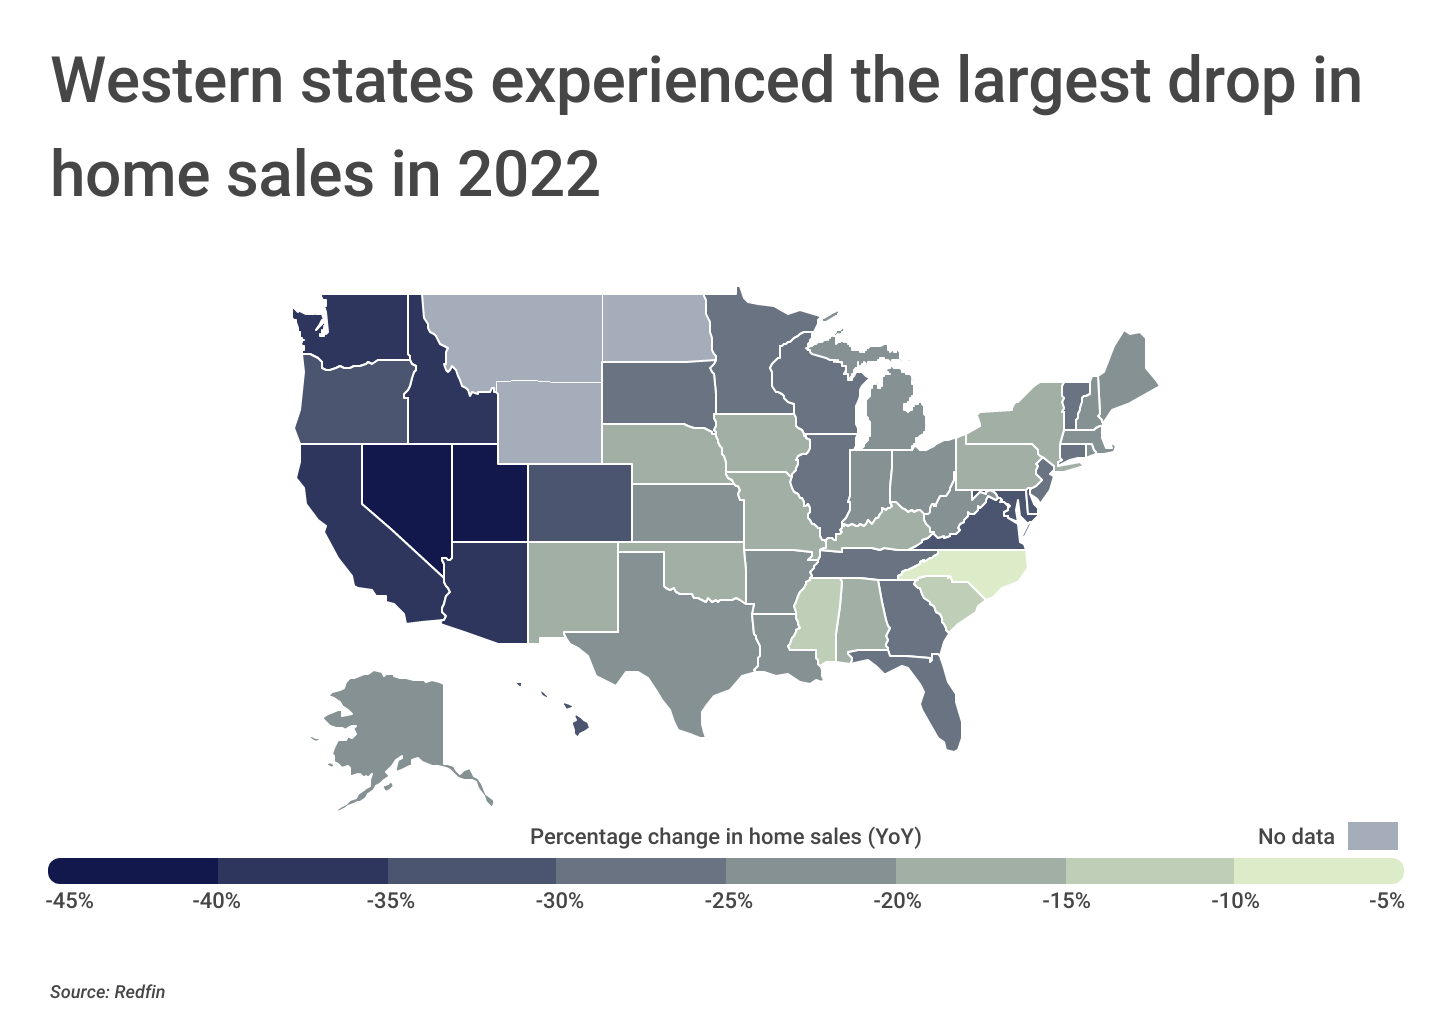
Few places have escaped the slowing of the market, but some locations are experiencing especially stark drops in activity. Nine of the top 10 states with the steepest drops in home sales from 2021 to 2022 are found in the Western U.S, led by Utah with a 43.2% decline. The region includes expensive states for housing like California (-37.4%) and Washington (-36.7%), along with states that boomed during the pandemic like Nevada (-40.8%), Arizona (-37.0%), and Idaho (-35.4%). Local markets in the Western region are also among the nation’s leaders in decreased home sales.
FOR CONSTRUCTION PROFESSIONALS
When the construction industry slows down, it becomes even more important to run your business as efficiently as possible. Construction project management software helps construction businesses avoid mistakes, reduce costs, and increase profitability. Some construction management software even offers built-in construction accounting features.
The data used in this analysis is from Redfin. To determine the locations with the largest drop in home sales, researchers at Construction Coverage calculated the percentage change in home sales from October 2021 to October 2022. In the event of a tie, the location with the greater percentage change in median days on market over the same time period was ranked higher.
Here are the U.S. metropolitan areas with the largest drop in home sales.
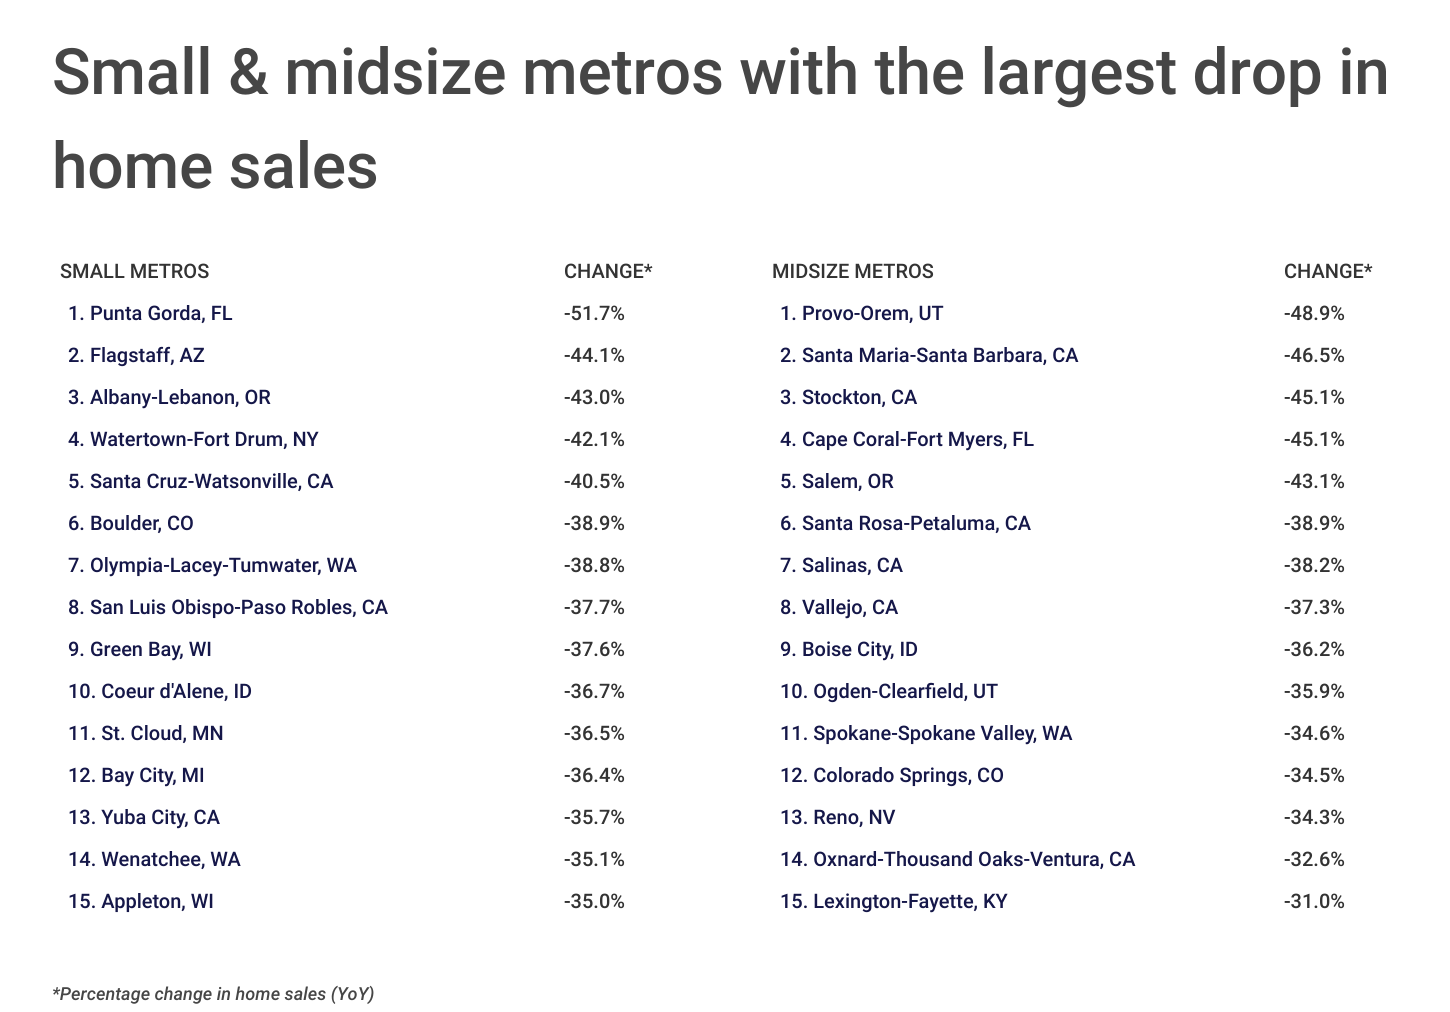
Large Metros With the Largest Drop in Home Sales

Photo Credit: Jacob Boomsma / Shutterstock
15. Fresno, CA
- Percentage change in home sales (YoY): -33.4%
- Percentage change in median days on market (YoY): +118.2%
- Total home sales per month (2022): 565
- Total home sales per month (2021): 848
- Median days on market (2022): 24
- Median days on market (2021): 11

Photo Credit: Sean Pavone / Shutterstock
14. Baltimore-Columbia-Towson, MD
- Percentage change in home sales (YoY): -34.2%
- Percentage change in median days on market (YoY): +16.7%
- Total home sales per month (2022): 2,823
- Total home sales per month (2021): 4,289
- Median days on market (2022): 28
- Median days on market (2021): 24

Photo Credit: ESB Professional / Shutterstock
13. Washington-Arlington-Alexandria, DC-VA-MD-WV
- Percentage change in home sales (YoY): -36.2%
- Percentage change in median days on market (YoY): +20.6%
- Total home sales per month (2022): 5,730
- Total home sales per month (2021): 8,985
- Median days on market (2022): 35
- Median days on market (2021): 29

Photo Credit: Bogdan Vacarciuc / Shutterstock
12. San Francisco-Oakland-Berkeley, CA
- Percentage change in home sales (YoY): -36.7%
- Percentage change in median days on market (YoY): +76.9%
- Total home sales per month (2022): 2,892
- Total home sales per month (2021): 4,571
- Median days on market (2022): 25
- Median days on market (2021): 14

Photo Credit: Andrew Zarivny / Shutterstock
11. Sacramento-Roseville-Folsom, CA
- Percentage change in home sales (YoY): -36.8%
- Percentage change in median days on market (YoY): +158.3%
- Total home sales per month (2022): 1,855
- Total home sales per month (2021): 2,934
- Median days on market (2022): 31
- Median days on market (2021): 12

Photo Credit: Nicholas Courtney / Shutterstock
10. Denver-Aurora-Lakewood, CO
- Percentage change in home sales (YoY): -37.3%
- Percentage change in median days on market (YoY): +214.3%
- Total home sales per month (2022): 3,524
- Total home sales per month (2021): 5,619
- Median days on market (2022): 22
- Median days on market (2021): 7

Photo Credit: Sean Pavone / Shutterstock
9. Los Angeles-Long Beach-Anaheim, CA
- Percentage change in home sales (YoY): -38.6%
- Percentage change in median days on market (YoY): +35.3%
- Total home sales per month (2022): 5,918
- Total home sales per month (2021): 9,634
- Median days on market (2022): 45
- Median days on market (2021): 33

Photo Credit: Checubus / Shutterstock
8. Seattle-Tacoma-Bellevue, WA
- Percentage change in home sales (YoY): -38.9%
- Percentage change in median days on market (YoY): +202.8%
- Total home sales per month (2022): 4,062
- Total home sales per month (2021): 6,648
- Median days on market (2022): 22
- Median days on market (2021): 7

Photo Credit: Jon Bilous / Shutterstock
7. Riverside-San Bernardino-Ontario, CA
- Percentage change in home sales (YoY): -39.5%
- Percentage change in median days on market (YoY): +45.2%
- Total home sales per month (2022): 3,495
- Total home sales per month (2021): 5,777
- Median days on market (2022): 45
- Median days on market (2021): 31

Photo Credit: Andrew Zarivny / Shutterstock
6. Portland-Vancouver-Hillsboro, OR-WA
- Percentage change in home sales (YoY): -39.6%
- Percentage change in median days on market (YoY): +150.0%
- Total home sales per month (2022): 2,488
- Total home sales per month (2021): 4,117
- Median days on market (2022): 25
- Median days on market (2021): 10

Photo Credit: Sean Pavone / Shutterstock
5. Phoenix-Mesa-Chandler, AZ
- Percentage change in home sales (YoY): -40.2%
- Percentage change in median days on market (YoY): +85.7%
- Total home sales per month (2022): 4,921
- Total home sales per month (2021): 8,230
- Median days on market (2022): 52
- Median days on market (2021): 28

Photo Credit: Dancestrokes / Shutterstock
4. San Diego-Chula Vista-Carlsbad, CA
- Percentage change in home sales (YoY): -41.5%
- Percentage change in median days on market (YoY): +100.0%
- Total home sales per month (2022): 1,931
- Total home sales per month (2021): 3,302
- Median days on market (2022): 28
- Median days on market (2021): 14
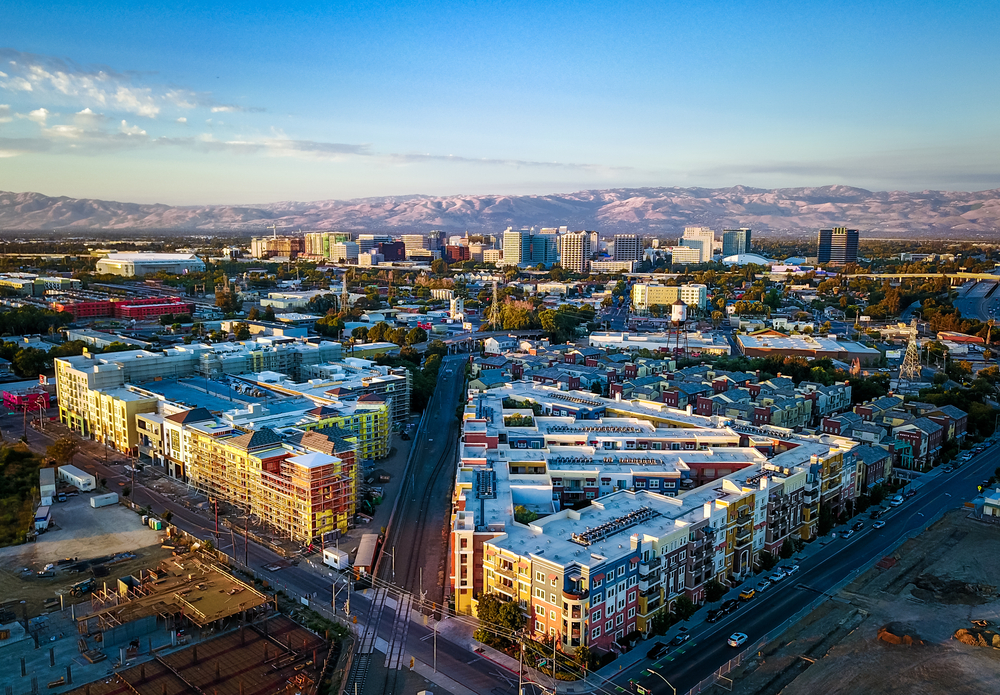
Photo Credit: Uladzik Kryhin / Shutterstock
3. San Jose-Sunnyvale-Santa Clara, CA
- Percentage change in home sales (YoY): -41.5%
- Percentage change in median days on market (YoY): +108.3%
- Total home sales per month (2022): 997
- Total home sales per month (2021): 1,703
- Median days on market (2022): 25
- Median days on market (2021): 12

Photo Credit: Andrey Bayda / Shutterstock
2. Las Vegas-Henderson-Paradise, NV
- Percentage change in home sales (YoY): -43.4%
- Percentage change in median days on market (YoY): +103.8%
- Total home sales per month (2022): 2,271
- Total home sales per month (2021): 4,011
- Median days on market (2022): 53
- Median days on market (2021): 26

Photo Credit: f11photo / Shutterstock
1. Salt Lake City, UT
- Percentage change in home sales (YoY): -47.1%
- Percentage change in median days on market (YoY): +185.7%
- Total home sales per month (2022): 866
- Total home sales per month (2021): 1,638
- Median days on market (2022): 40
- Median days on market (2021): 14
Detailed Findings & Methodology
The data used in this analysis is from Redfin’s Data Center. To determine the locations with the largest drop in home sales, researchers at Construction Coverage calculated the percentage change in home sales, year over year, from October 2021 to October 2022. In the event of a tie, the location with the greater percentage change in median days on market over the same time period was ranked higher. To improve relevance, only metropolitan areas with at least 100,000 residents were included. Additionally, metros were grouped into cohorts based on population size: small (100,000-349,999), midsize (350,000-999,999), and large (1,000,000 or more). Note, certain metropolitan areas and states were excluded due to insufficient data. Additionally, state- and metro-level data do not sum to the national statistics due to differences in Redfin data coverage across local markets.