
Cities With the Most Construction Workers
Note: This is the most recent release of our Cities With the Most Construction Workers study. To see data from prior years, please visit the Full Results section below.
The U.S. construction industry faces a high degree of uncertainty in 2025. On one hand, demand for new housing and infrastructure remains high, driven by a persistent housing shortage and a wave of federal investment. On the other hand, the sector is grappling with notable headwinds: labor shortages have tightened the market for skilled workers, while overall construction spending has slowed in recent months amid elevated interest rates and broader economic uncertainty. These conflicting trends have cast a spotlight on the construction workforce—both where it is growing and where it may be vulnerable.
Historically, construction employment has closely mirrored macroeconomic cycles, rising in times of expansion and contracting sharply during downturns. The recent post-pandemic boom brought millions of workers back into the industry, with employment reaching over 8 million in 2024 according to Bureau of Labor Statistics data. But as economic momentum cools, there is growing interest in where construction activity remains most concentrated.
This report by Construction Coverage examines long-term trends in construction employment, identifies the most common construction industry occupations, and highlights the U.S. cities and states where construction workers make up the largest share of the local workforce. These high-concentration areas not only reflect where construction activity is most robust, but also where local economies may be most exposed should the sector contract.
How Many People Work in the U.S. Construction Industry?
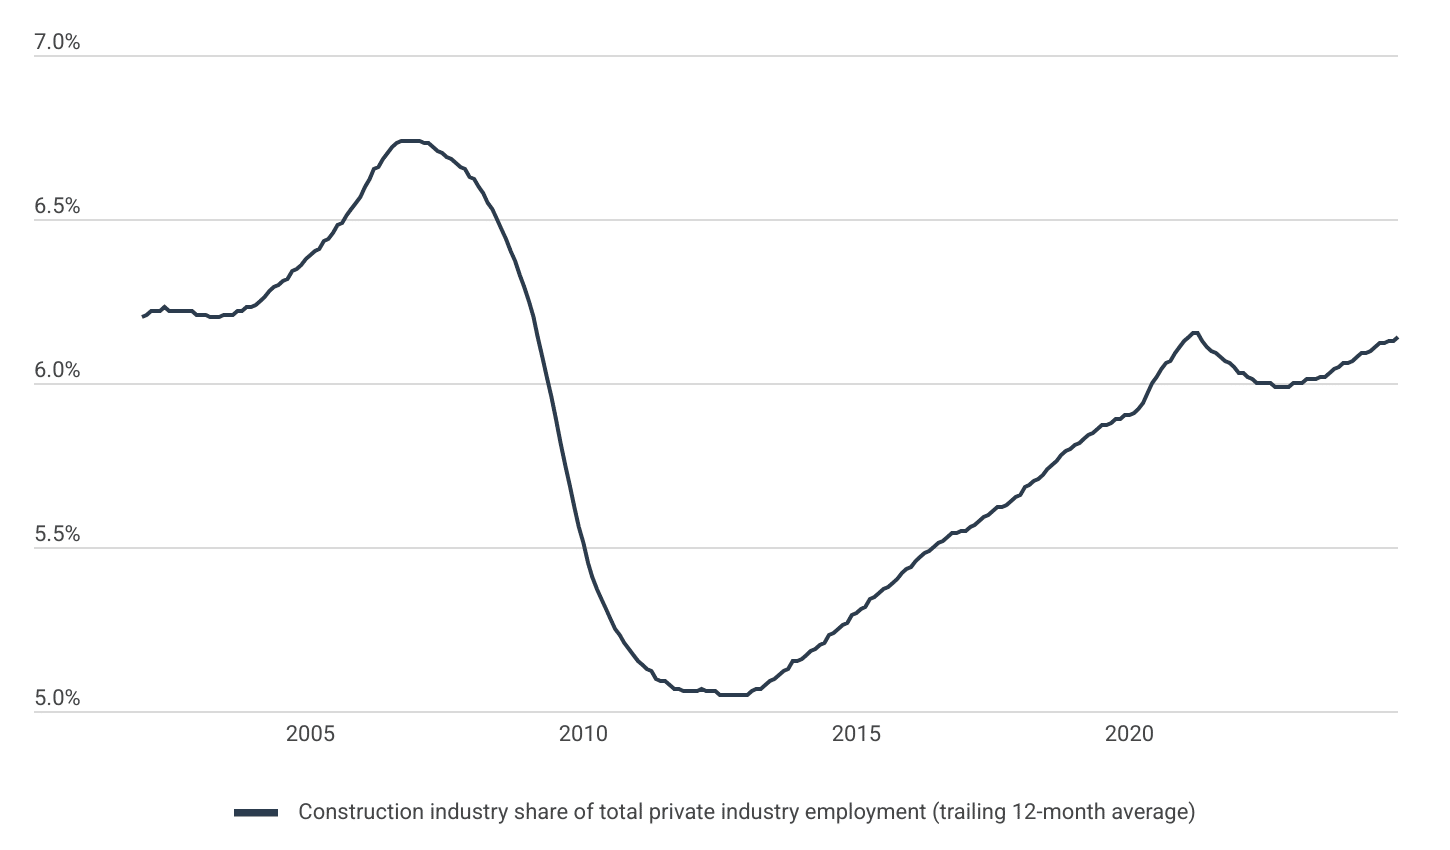
There are approximately 8.1 million Americans employed in construction, accounting for 6.1% of private-sector employment
Data: Construction Industry Share of Total Private Industry Employment Over Time
| Date | Construction industry share of employment (trailing 12-month average) |
|---|---|
| 12/1/2001 | 6.197% |
| 1/1/2002 | 6.208% |
| 2/1/2002 | 6.217% |
| 3/1/2002 | 6.222% |
| 4/1/2002 | 6.224% |
| 5/1/2002 | 6.225% |
| 6/1/2002 | 6.224% |
| 7/1/2002 | 6.222% |
| 8/1/2002 | 6.221% |
| 9/1/2002 | 6.220% |
| 10/1/2002 | 6.218% |
| 11/1/2002 | 6.216% |
| 12/1/2002 | 6.213% |
| 1/1/2003 | 6.212% |
| 2/1/2003 | 6.208% |
| 3/1/2003 | 6.204% |
| 4/1/2003 | 6.203% |
| 5/1/2003 | 6.204% |
| 6/1/2003 | 6.206% |
| 7/1/2003 | 6.209% |
| 8/1/2003 | 6.212% |
| 9/1/2003 | 6.216% |
| 10/1/2003 | 6.221% |
| 11/1/2003 | 6.225% |
| 12/1/2003 | 6.232% |
| 1/1/2004 | 6.239% |
| 2/1/2004 | 6.248% |
| 3/1/2004 | 6.261% |
| 4/1/2004 | 6.277% |
| 5/1/2004 | 6.287% |
| 6/1/2004 | 6.300% |
| 7/1/2004 | 6.313% |
| 8/1/2004 | 6.323% |
| 9/1/2004 | 6.335% |
| 10/1/2004 | 6.347% |
| 11/1/2004 | 6.361% |
| 12/1/2004 | 6.375% |
| 1/1/2005 | 6.387% |
| 2/1/2005 | 6.401% |
| 3/1/2005 | 6.413% |
| 4/1/2005 | 6.428% |
| 5/1/2005 | 6.444% |
| 6/1/2005 | 6.460% |
| 7/1/2005 | 6.476% |
| 8/1/2005 | 6.494% |
| 9/1/2005 | 6.514% |
| 10/1/2005 | 6.532% |
| 11/1/2005 | 6.553% |
| 12/1/2005 | 6.572% |
| 1/1/2006 | 6.596% |
| 2/1/2006 | 6.621% |
| 3/1/2006 | 6.645% |
| 4/1/2006 | 6.665% |
| 5/1/2006 | 6.684% |
| 6/1/2006 | 6.704% |
| 7/1/2006 | 6.717% |
| 8/1/2006 | 6.729% |
| 9/1/2006 | 6.738% |
| 10/1/2006 | 6.744% |
| 11/1/2006 | 6.744% |
| 12/1/2006 | 6.744% |
| 1/1/2007 | 6.742% |
| 2/1/2007 | 6.732% |
| 3/1/2007 | 6.726% |
| 4/1/2007 | 6.717% |
| 5/1/2007 | 6.709% |
| 6/1/2007 | 6.699% |
| 7/1/2007 | 6.690% |
| 8/1/2007 | 6.681% |
| 9/1/2007 | 6.670% |
| 10/1/2007 | 6.659% |
| 11/1/2007 | 6.649% |
| 12/1/2007 | 6.633% |
| 1/1/2008 | 6.615% |
| 2/1/2008 | 6.599% |
| 3/1/2008 | 6.576% |
| 4/1/2008 | 6.552% |
| 5/1/2008 | 6.526% |
| 6/1/2008 | 6.495% |
| 7/1/2008 | 6.467% |
| 8/1/2008 | 6.435% |
| 9/1/2008 | 6.404% |
| 10/1/2008 | 6.371% |
| 11/1/2008 | 6.334% |
| 12/1/2008 | 6.295% |
| 1/1/2009 | 6.248% |
| 2/1/2009 | 6.197% |
| 3/1/2009 | 6.143% |
| 4/1/2009 | 6.083% |
| 5/1/2009 | 6.020% |
| 6/1/2009 | 5.956% |
| 7/1/2009 | 5.890% |
| 8/1/2009 | 5.823% |
| 9/1/2009 | 5.755% |
| 10/1/2009 | 5.686% |
| 11/1/2009 | 5.623% |
| 12/1/2009 | 5.562% |
| 1/1/2010 | 5.508% |
| 2/1/2010 | 5.455% |
| 3/1/2010 | 5.408% |
| 4/1/2010 | 5.373% |
| 5/1/2010 | 5.339% |
| 6/1/2010 | 5.305% |
| 7/1/2010 | 5.275% |
| 8/1/2010 | 5.249% |
| 9/1/2010 | 5.226% |
| 10/1/2010 | 5.206% |
| 11/1/2010 | 5.187% |
| 12/1/2010 | 5.169% |
| 1/1/2011 | 5.153% |
| 2/1/2011 | 5.142% |
| 3/1/2011 | 5.130% |
| 4/1/2011 | 5.116% |
| 5/1/2011 | 5.104% |
| 6/1/2011 | 5.095% |
| 7/1/2011 | 5.087% |
| 8/1/2011 | 5.080% |
| 9/1/2011 | 5.074% |
| 10/1/2011 | 5.067% |
| 11/1/2011 | 5.061% |
| 12/1/2011 | 5.059% |
| 1/1/2012 | 5.062% |
| 2/1/2012 | 5.064% |
| 3/1/2012 | 5.065% |
| 4/1/2012 | 5.064% |
| 5/1/2012 | 5.063% |
| 6/1/2012 | 5.060% |
| 7/1/2012 | 5.055% |
| 8/1/2012 | 5.050% |
| 9/1/2012 | 5.047% |
| 10/1/2012 | 5.047% |
| 11/1/2012 | 5.047% |
| 12/1/2012 | 5.049% |
| 1/1/2013 | 5.053% |
| 2/1/2013 | 5.059% |
| 3/1/2013 | 5.065% |
| 4/1/2013 | 5.071% |
| 5/1/2013 | 5.080% |
| 6/1/2013 | 5.090% |
| 7/1/2013 | 5.101% |
| 8/1/2013 | 5.113% |
| 9/1/2013 | 5.124% |
| 10/1/2013 | 5.134% |
| 11/1/2013 | 5.146% |
| 12/1/2013 | 5.152% |
| 1/1/2014 | 5.162% |
| 2/1/2014 | 5.169% |
| 3/1/2014 | 5.178% |
| 4/1/2014 | 5.190% |
| 5/1/2014 | 5.202% |
| 6/1/2014 | 5.213% |
| 7/1/2014 | 5.225% |
| 8/1/2014 | 5.237% |
| 9/1/2014 | 5.248% |
| 10/1/2014 | 5.261% |
| 11/1/2014 | 5.272% |
| 12/1/2014 | 5.286% |
| 1/1/2015 | 5.299% |
| 2/1/2015 | 5.312% |
| 3/1/2015 | 5.323% |
| 4/1/2015 | 5.337% |
| 5/1/2015 | 5.348% |
| 6/1/2015 | 5.360% |
| 7/1/2015 | 5.371% |
| 8/1/2015 | 5.382% |
| 9/1/2015 | 5.392% |
| 10/1/2015 | 5.404% |
| 11/1/2015 | 5.416% |
| 12/1/2015 | 5.430% |
| 1/1/2016 | 5.443% |
| 2/1/2016 | 5.456% |
| 3/1/2016 | 5.470% |
| 4/1/2016 | 5.483% |
| 5/1/2016 | 5.494% |
| 6/1/2016 | 5.504% |
| 7/1/2016 | 5.514% |
| 8/1/2016 | 5.522% |
| 9/1/2016 | 5.531% |
| 10/1/2016 | 5.537% |
| 11/1/2016 | 5.544% |
| 12/1/2016 | 5.548% |
| 1/1/2017 | 5.554% |
| 2/1/2017 | 5.562% |
| 3/1/2017 | 5.571% |
| 4/1/2017 | 5.578% |
| 5/1/2017 | 5.588% |
| 6/1/2017 | 5.598% |
| 7/1/2017 | 5.607% |
| 8/1/2017 | 5.616% |
| 9/1/2017 | 5.624% |
| 10/1/2017 | 5.633% |
| 11/1/2017 | 5.642% |
| 12/1/2017 | 5.653% |
| 1/1/2018 | 5.664% |
| 2/1/2018 | 5.677% |
| 3/1/2018 | 5.689% |
| 4/1/2018 | 5.700% |
| 5/1/2018 | 5.712% |
| 6/1/2018 | 5.725% |
| 7/1/2018 | 5.737% |
| 8/1/2018 | 5.750% |
| 9/1/2018 | 5.764% |
| 10/1/2018 | 5.777% |
| 11/1/2018 | 5.789% |
| 12/1/2018 | 5.801% |
| 1/1/2019 | 5.815% |
| 2/1/2019 | 5.823% |
| 3/1/2019 | 5.831% |
| 4/1/2019 | 5.841% |
| 5/1/2019 | 5.850% |
| 6/1/2019 | 5.858% |
| 7/1/2019 | 5.866% |
| 8/1/2019 | 5.873% |
| 9/1/2019 | 5.881% |
| 10/1/2019 | 5.887% |
| 11/1/2019 | 5.893% |
| 12/1/2019 | 5.897% |
| 1/1/2020 | 5.902% |
| 2/1/2020 | 5.909% |
| 3/1/2020 | 5.916% |
| 4/1/2020 | 5.935% |
| 5/1/2020 | 5.969% |
| 6/1/2020 | 5.998% |
| 7/1/2020 | 6.020% |
| 8/1/2020 | 6.040% |
| 9/1/2020 | 6.056% |
| 10/1/2020 | 6.071% |
| 11/1/2020 | 6.087% |
| 12/1/2020 | 6.108% |
| 1/1/2021 | 6.126% |
| 2/1/2021 | 6.137% |
| 3/1/2021 | 6.152% |
| 4/1/2021 | 6.150% |
| 5/1/2021 | 6.129% |
| 6/1/2021 | 6.111% |
| 7/1/2021 | 6.099% |
| 8/1/2021 | 6.086% |
| 9/1/2021 | 6.076% |
| 10/1/2021 | 6.067% |
| 11/1/2021 | 6.058% |
| 12/1/2021 | 6.046% |
| 1/1/2022 | 6.034% |
| 2/1/2022 | 6.030% |
| 3/1/2022 | 6.021% |
| 4/1/2022 | 6.012% |
| 5/1/2022 | 6.005% |
| 6/1/2022 | 6.001% |
| 7/1/2022 | 5.997% |
| 8/1/2022 | 5.995% |
| 9/1/2022 | 5.994% |
| 10/1/2022 | 5.994% |
| 11/1/2022 | 5.993% |
| 12/1/2022 | 5.994% |
| 1/1/2023 | 5.996% |
| 2/1/2023 | 6.000% |
| 3/1/2023 | 6.002% |
| 4/1/2023 | 6.006% |
| 5/1/2023 | 6.009% |
| 6/1/2023 | 6.013% |
| 7/1/2023 | 6.018% |
| 8/1/2023 | 6.025% |
| 9/1/2023 | 6.031% |
| 10/1/2023 | 6.039% |
| 11/1/2023 | 6.047% |
| 12/1/2023 | 6.056% |
| 1/1/2024 | 6.063% |
| 2/1/2024 | 6.071% |
| 3/1/2024 | 6.080% |
| 4/1/2024 | 6.087% |
| 5/1/2024 | 6.093% |
| 6/1/2024 | 6.100% |
| 7/1/2024 | 6.108% |
| 8/1/2024 | 6.116% |
| 9/1/2024 | 6.122% |
| 10/1/2024 | 6.126% |
| 11/1/2024 | 6.132% |
| 12/1/2024 | 6.137% |
Hiring workers or managing crews on the jobsite?
Protect your business from injuries and lawsuits with the right workers’ compensation insurance.
As of December 2024, about 8.1 million Americans work in construction, accounting for 6.1% of private-sector employment. While this marks a strong recovery from the lows of the Great Recession, the sector has yet to return to pre-2008 levels.
Construction employment declined sharply following the housing market crash, reaching a low point in early 2011 when it accounted for just 4.8% of private-sector jobs—the lowest level in over 30 years. Since then, the sector has gradually regained ground, supported by sustained demand for housing and infrastructure projects.
The COVID-19 pandemic briefly accelerated this trend. With construction classified as essential in many states, the industry avoided the widespread job losses seen in other sectors, and its employment share temporarily rose above 6.4%. While that surge was short-lived, construction’s share has held relatively steady in the years since, hovering between 6.0% and 6.3%.
The Most Popular Construction Industry Jobs
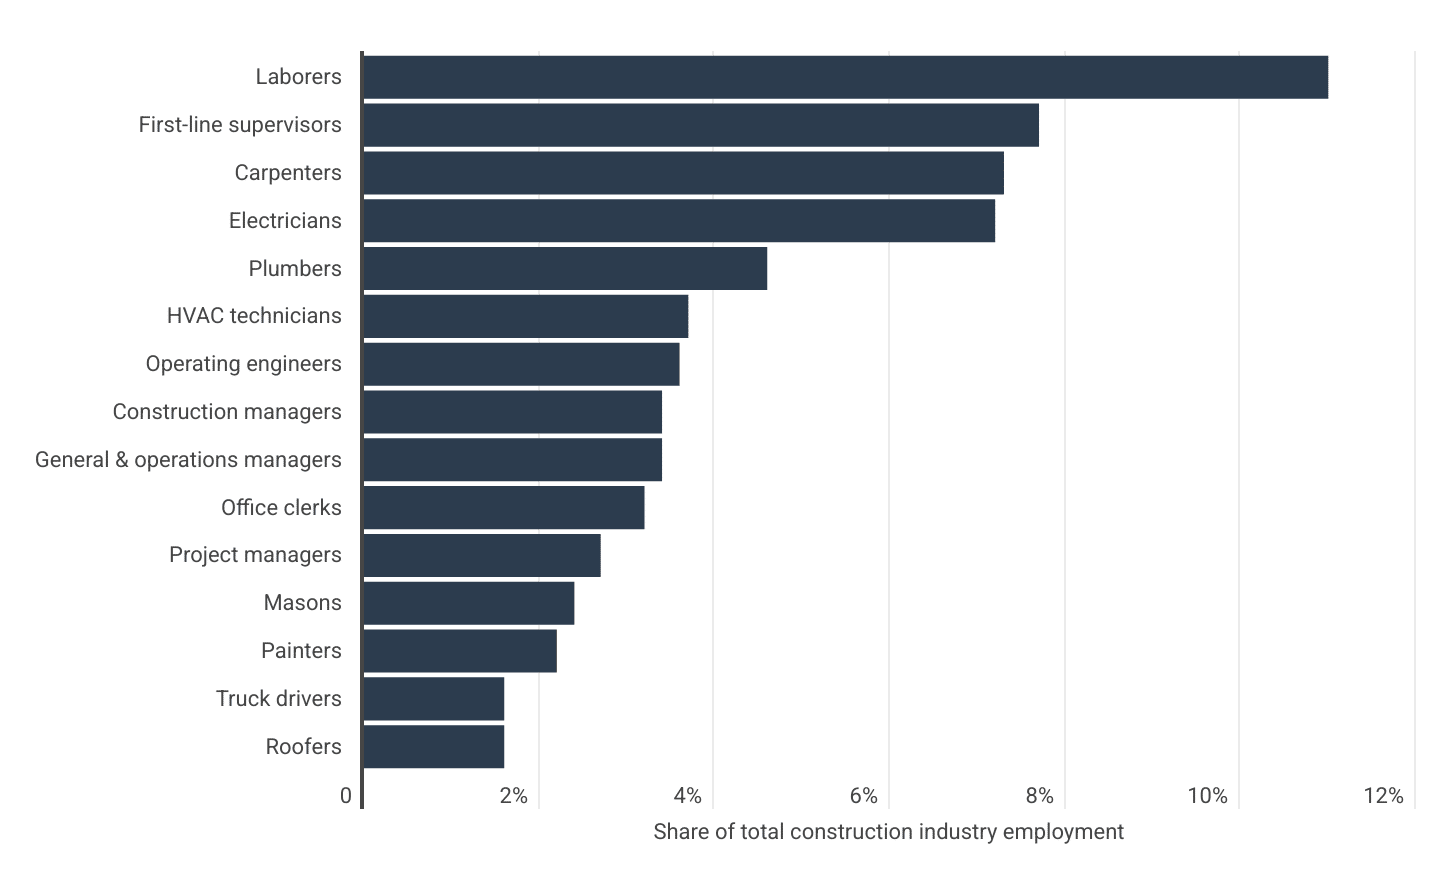
Laborers, supervisors, and carpenters are the most common construction jobs
Data: The Most Popular Construction Industry Jobs
| Occupation | Share of total construction industry employment |
|---|---|
| Laborers | 11.0% |
| First-line supervisors | 7.7% |
| Carpenters | 7.3% |
| Electricians | 7.2% |
| Plumbers | 4.6% |
| HVAC technicians | 3.7% |
| Operating engineers | 3.6% |
| Construction managers | 3.4% |
| General & operations managers | 3.4% |
| Office clerks | 3.2% |
| Project managers | 2.7% |
| Masons | 2.4% |
| Painters | 2.2% |
| Truck drivers | 1.6% |
| Roofers | 1.6% |
While the construction industry is often associated with manual labor and skilled trades, the sector supports a broad mix of occupations, from on-site workers to project coordinators and administrative staff. The most common roles remain those at the core of physical construction: laborers (11.0%), first-line supervisors (7.7%), and carpenters (7.3%) collectively make up more than a quarter of the industry’s workforce. Other specialized trades like electricians (7.2%), plumbers (4.6%), HVAC technicians (3.7%), masons (2.4%), painters (2.2%), and roofers (1.6%) are also among the most popular construction jobs.
Specialized trades make up over half the construction workforce.
Whether you’re a licensed electrician or a general handyman, insurance is often a prerequisite for getting hired—and essential for covering liability on active jobs.
Beyond the jobsite, many roles support project planning, oversight, and business operations. Construction managers and general managers each represent 3.4% of total construction employment, while project managers account for 2.7%. Administrative roles—including office clerks (3.2%)—play a smaller but essential role in keeping office operations running smoothly.
Which States Rely Most Heavily on the Construction Sector for Jobs?
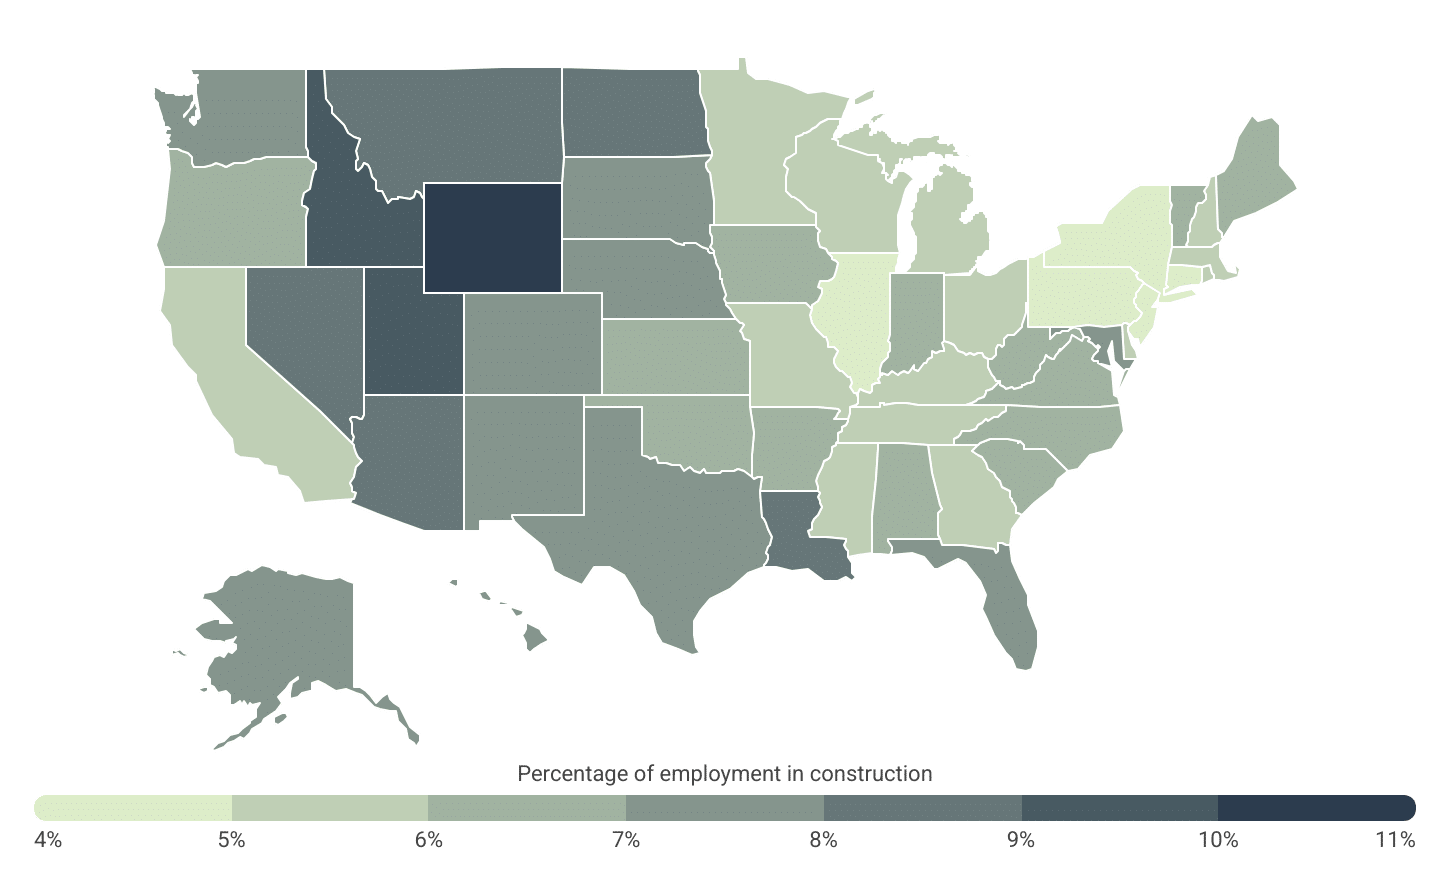
Wyoming, Utah, and Idaho have the highest concentration of construction workers
Data: Percentage of Employment in Construction by U.S. State
| State | Percentage of employment in construction |
|---|---|
| Wyoming | 11.0% |
| Utah | 9.5% |
| Idaho | 9.3% |
| Montana | 8.7% |
| Louisiana | 8.7% |
| North Dakota | 8.2% |
| Arizona | 8.1% |
| Nevada | 8.0% |
| New Mexico | 7.9% |
| Colorado | 7.7% |
| South Dakota | 7.7% |
| Hawaii | 7.5% |
| Florida | 7.4% |
| Maryland | 7.3% |
| Nebraska | 7.3% |
| Alaska | 7.3% |
| Texas | 7.2% |
| Washington | 7.1% |
| Oregon | 6.8% |
| North Carolina | 6.5% |
| Virginia | 6.5% |
| Iowa | 6.5% |
| Maine | 6.4% |
| Oklahoma | 6.3% |
| Vermont | 6.3% |
| Alabama | 6.2% |
| Indiana | 6.1% |
| South Carolina | 6.1% |
| Arkansas | 6.1% |
| Kansas | 6.0% |
| West Virginia | 6.0% |
| Missouri | 5.9% |
| Delaware | 5.9% |
| California | 5.9% |
| Tennessee | 5.8% |
| Wisconsin | 5.5% |
| Kentucky | 5.5% |
| Georgia | 5.5% |
| Minnesota | 5.4% |
| Mississippi | 5.4% |
| Massachusetts | 5.3% |
| New Hampshire | 5.3% |
| Ohio | 5.2% |
| Michigan | 5.1% |
| Rhode Island | 5.1% |
| Pennsylvania | 4.9% |
| New York | 4.7% |
| Illinois | 4.5% |
| New Jersey | 4.5% |
| Connecticut | 4.3% |
All eight Mountain West states rank among the top 10 nationally for construction employment as a share of total jobs. Wyoming leads the nation at 11.0%, followed closely by Utah (9.5%), Idaho (9.3%), Montana (8.7%), Arizona (8.1%), Nevada (8.0%), New Mexico (7.9%), and Colorado (7.7%). This regional concentration reflects both strong construction demand and a significant dependence on the sector for employment.
Construction activity in the Mountain West is being driven by a combination of rapid in-migration, expanding housing needs, and large-scale manufacturing and infrastructure projects. The region’s business-friendly environment and abundance of undeveloped land have made it a hub for both residential and industrial development, pushing construction employment to consistently high levels across state lines.
Working across multiple sites or transporting gear daily?
Inland marine insurance protects tools and equipment wherever the job takes you.
In contrast, states in the Northeast—such as Connecticut (4.3%), New Jersey (4.5%), and New York (4.7%)—along with several in the Midwest like Illinois (4.5%) and Michigan (5.1%), report the lowest shares of construction employment. These patterns suggest slower population growth, more mature housing markets, and possibly more diversified state economies where construction plays a less dominant role.
Where Is Construction Industry Employment Growing the Most?
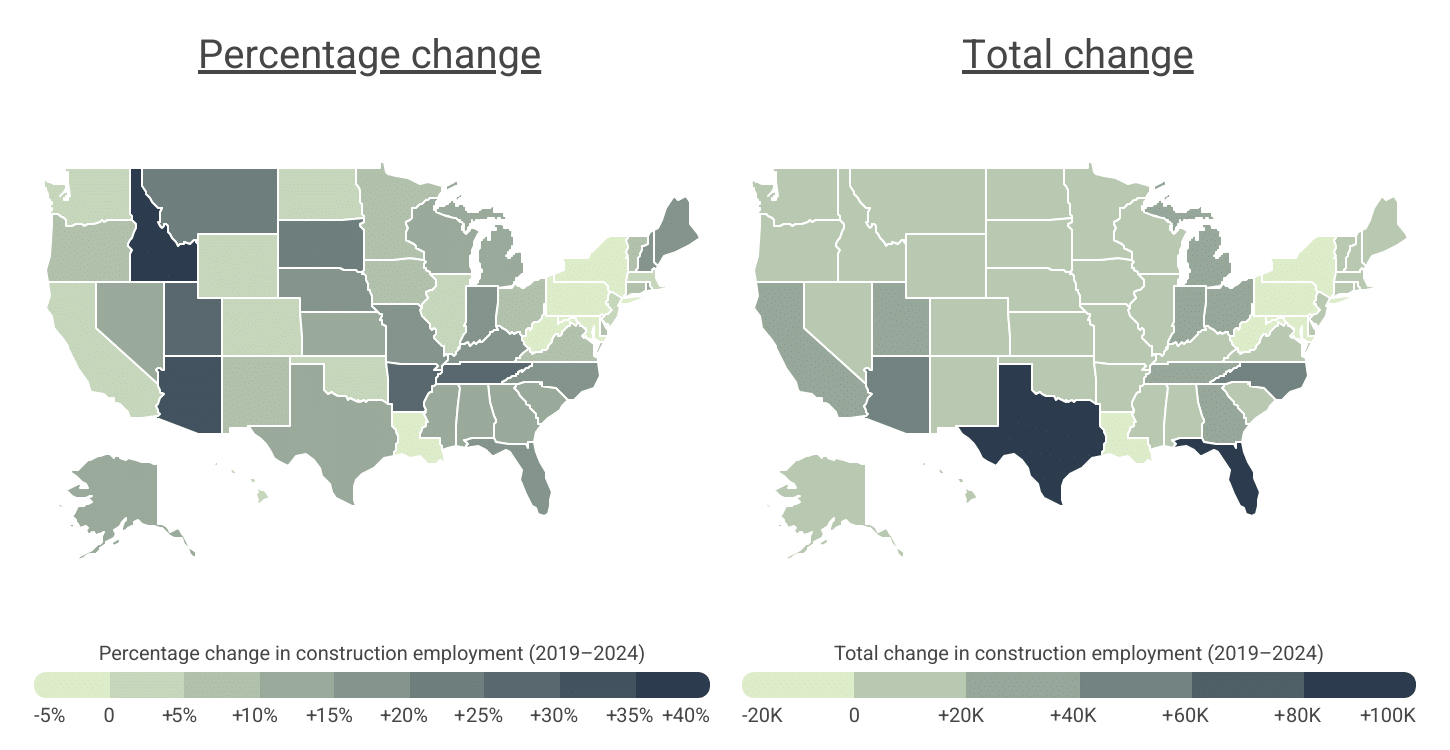
Since 2019, states in the Mountain West are experiencing a hiring boom in construction
Data: Percentage and Total Change in Construction Industry Employment by State
| State | Percentage change |
|---|---|
| Idaho | +35.5% |
| Arizona | +32.3% |
| Arkansas | +27.3% |
| Utah | +26.3% |
| Tennessee | +25.6% |
| Montana | +24.5% |
| South Dakota | +23.8% |
| Maine | +17.7% |
| North Carolina | +17.4% |
| Indiana | +16.2% |
| Kentucky | +16.2% |
| New Hampshire | +15.9% |
| Missouri | +15.8% |
| Nebraska | +15.7% |
| Florida | +15.0% |
| Nevada | +14.3% |
| Alabama | +14.1% |
| Mississippi | +13.5% |
| Wisconsin | +13.4% |
| Michigan | +13.2% |
| Alaska | +13.0% |
| Georgia | +11.9% |
| Kansas | +11.6% |
| Rhode Island | +11.2% |
| Texas | +10.8% |
| South Carolina | +10.2% |
| Ohio | +9.9% |
| Minnesota | +8.6% |
| Iowa | +8.6% |
| Virginia | +7.8% |
| New Mexico | +7.5% |
| Oregon | +6.6% |
| Delaware | +6.0% |
| Vermont | +6.0% |
| Connecticut | +5.9% |
| Colorado | +4.7% |
| Massachusetts | +4.6% |
| Hawaii | +4.6% |
| North Dakota | +4.1% |
| Illinois | +3.9% |
| Oklahoma | +3.9% |
| Wyoming | +3.5% |
| California | +3.1% |
| Washington | +3.0% |
| New Jersey | +2.9% |
| Pennsylvania | -0.2% |
| Maryland | -1.1% |
| Louisiana | -1.3% |
| New York | -4.3% |
| West Virginia | -5.0% |
| State | Total change |
|---|---|
| Florida | +84,355 |
| Texas | +83,342 |
| Arizona | +55,375 |
| North Carolina | +40,408 |
| Tennessee | +33,248 |
| Utah | +28,775 |
| California | +27,802 |
| Georgia | +24,340 |
| Indiana | +23,695 |
| Michigan | +22,767 |
| Ohio | +22,482 |
| Missouri | +19,982 |
| Idaho | +17,984 |
| Wisconsin | +16,614 |
| Virginia | +15,792 |
| Arkansas | +14,342 |
| Nevada | +13,698 |
| Alabama | +13,216 |
| Kentucky | +13,023 |
| Minnesota | +10,950 |
| South Carolina | +10,933 |
| Illinois | +8,884 |
| Nebraska | +8,449 |
| Colorado | +8,330 |
| Massachusetts | +7,462 |
| Kansas | +7,425 |
| Montana | +7,326 |
| Oregon | +7,209 |
| Iowa | +6,708 |
| Washington | +6,221 |
| Mississippi | +6,033 |
| South Dakota | +5,618 |
| Maine | +5,319 |
| New Jersey | +4,554 |
| New Hampshire | +4,424 |
| New Mexico | +3,741 |
| Connecticut | +3,541 |
| Oklahoma | +3,234 |
| Rhode Island | +2,231 |
| Alaska | +2,132 |
| Hawaii | +1,702 |
| Delaware | +1,374 |
| North Dakota | +1,157 |
| Vermont | +913 |
| Wyoming | +804 |
| Pennsylvania | -629 |
| West Virginia | -1,787 |
| Maryland | -1,809 |
| Louisiana | -1,822 |
| New York | -17,487 |
Despite short- and long-term labor shortages at the national level, some states have seen substantial growth in construction hiring. The Bureau of Labor Statistics recorded a 35.5% increase in construction employment in Idaho from 2019 to 2024, the largest in the nation. Other parts of the Mountain West have also seen substantial increases, with Arizona (+32.3%), Utah (+26.3%), and Montana (+24.5%) all ranking in the top 10 for percentage growth.
Notably, the states with the highest percentage gains in construction employment tend to have lower population densities. However, these percentages don’t fully capture the impact of growth in more populous states. Florida, for instance, saw a more modest 15.0% growth but added 84,355 new construction industry positions—over 66,000 more jobs than the 17,984 that Idaho added during the same time period. Similarly, Texas’ 10.8% increase in construction employment translated to over 83,000 new jobs.
Below is a breakdown of construction industry employment across over 360 metros and all 50 states. For more detailed information, refer to the methodology section.
Cities With the Most Construction Workers
| Top Large Metros | Percentage* |
|---|---|
| 1. Sacramento-Roseville-Folsom, CA | 9.3% |
| 2. Phoenix-Mesa-Chandler, AZ | 8.4% |
| 3. Raleigh-Cary, NC | 8.4% |
| 4. Riverside-San Bernardino-Ontario, CA | 8.2% |
| 5. Houston-Pasadena-The Woodlands, TX | 8.1% |
| 6. Salt Lake City-Murray, UT | 8.0% |
| 7. Austin-Round Rock-San Marcos, TX | 7.7% |
| 8. Las Vegas-Henderson-North Las Vegas, NV | 7.7% |
| 9. Urban Honolulu, HI | 7.7% |
| 10. Denver-Aurora-Centennial, CO | 7.6% |
| 11. Jacksonville, FL | 7.6% |
| 12. Portland-Vancouver-Hillsboro, OR-WA | 7.5% |
| 13. Richmond, VA | 7.5% |
| 14. San Antonio-New Braunfels, TX | 7.2% |
| 15. Orlando-Kissimmee-Sanford, FL | 7.2% |
| Bottom Large Metros | Percentage* |
|---|---|
| 1. Memphis, TN-MS-AR | 4.5% |
| 2. Cleveland, OH | 4.5% |
| 3. Chicago-Naperville-Elgin, IL-IN | 4.5% |
| 4. Hartford-West Hartford-East Hartford, CT | 4.5% |
| 5. Buffalo-Cheektowaga, NY | 4.6% |
| 6. Philadelphia-Camden-Wilmington, PA-NJ-DE-MD | 4.6% |
| 7. New York-Newark-Jersey City, NY-NJ | 4.6% |
| 8. Los Angeles-Long Beach-Anaheim, CA | 4.7% |
| 9. Detroit-Warren-Dearborn, MI | 4.8% |
| 10. Milwaukee-Waukesha, WI | 5.0% |
| 11. San Jose-Sunnyvale-Santa Clara, CA | 5.1% |
| 12. Boston-Cambridge-Newton, MA-NH | 5.1% |
| 13. Minneapolis-St. Paul-Bloomington, MN-WI | 5.2% |
| 14. Cincinnati, OH-KY-IN | 5.3% |
| 15. Rochester, NY | 5.4% |
| Top Midsize Metros | Percentage* |
|---|---|
| 1. Cape Coral-Fort Myers, FL | 16.2% |
| 2. Beaumont-Port Arthur, TX | 15.8% |
| 3. Baton Rouge, LA | 14.9% |
| 4. Corpus Christi, TX | 13.1% |
| 5. Naples-Marco Island, FL | 13.1% |
| 6. Provo-Orem-Lehi, UT | 11.6% |
| 7. North Port-Bradenton-Sarasota, FL | 10.3% |
| 8. Ogden, UT | 10.2% |
| 9. Boise City, ID | 10.1% |
| 10. Reno, NV | 9.8% |
| 11. Port St. Lucie, FL | 9.8% |
| 12. Ocala, FL | 9.5% |
| 13. Vallejo, CA | 9.2% |
| 14. Santa Rosa-Petaluma, CA | 9.1% |
| 15. Wilmington, NC | 8.8% |
| Bottom Midsize Metros | Percentage* |
|---|---|
| 1. Brownsville-Harlingen, TX | 3.0% |
| 2. Trenton-Princeton, NJ | 3.0% |
| 3. McAllen-Edinburg-Mission, TX | 3.6% |
| 4. Ann Arbor, MI | 3.7% |
| 5. Allentown-Bethlehem-Easton, PA-NJ | 3.8% |
| 6. Durham-Chapel Hill, NC | 3.9% |
| 7. New Haven, CT | 4.1% |
| 8. Harrisburg-Carlisle, PA | 4.2% |
| 9. Scranton–Wilkes-Barre, PA | 4.3% |
| 10. Hickory-Lenoir-Morganton, NC | 4.4% |
| 11. Salinas, CA | 4.6% |
| 12. Dayton-Kettering-Beavercreek, OH | 4.6% |
| 13. Springfield, MA | 4.7% |
| 14. Reading, PA | 4.8% |
| 15. Huntsville, AL | 5.0% |
| Top Small Metros | Percentage* |
|---|---|
| 1. St. George, UT | 13.6% |
| 2. Greeley, CO | 13.4% |
| 3. Bozeman, MT | 12.4% |
| 4. Wildwood-The Villages, FL | 12.4% |
| 5. Lake Charles, LA | 12.2% |
| 6. Punta Gorda, FL | 11.1% |
| 7. Coeur d’Alene, ID | 11.0% |
| 8. Farmington, NM | 10.7% |
| 9. Mount Vernon-Anacortes, WA | 10.5% |
| 10. Fairbanks-College, AK | 10.5% |
| 11. Homosassa Springs, FL | 10.3% |
| 12. Panama City-Panama City Beach, FL | 10.2% |
| 13. Prescott Valley-Prescott, AZ | 10.0% |
| 14. Cheyenne, WY | 10.0% |
| 15. Odessa, TX | 9.9% |
| Bottom Small Metros | Percentage* |
|---|---|
| 1. Ithaca, NY | 2.2% |
| 2. Rome, GA | 2.2% |
| 3. Eagle Pass, TX | 2.3% |
| 4. Dalton, GA | 2.4% |
| 5. Laredo, TX | 2.4% |
| 6. Hinesville, GA | 2.9% |
| 7. Springfield, OH | 3.0% |
| 8. Hanford-Corcoran, CA | 3.3% |
| 9. Utica-Rome, NY | 3.3% |
| 10. Kenosha, WI | 3.4% |
| 11. Boulder, CO | 3.4% |
| 12. Bloomington, IL | 3.5% |
| 13. Norwich-New London-Willimantic, CT | 3.5% |
| 14. Anniston-Oxford, AL | 3.6% |
| 15. Elkhart-Goshen, IN | 3.6% |
States With the Most Construction Workers
| Top States | Percentage* |
|---|---|
| 1. Wyoming | 11.0% |
| 2. Utah | 9.5% |
| 3. Idaho | 9.3% |
| 4. Montana | 8.7% |
| 5. Louisiana | 8.7% |
| 6. North Dakota | 8.2% |
| 7. Arizona | 8.1% |
| 8. Nevada | 8.0% |
| 9. New Mexico | 7.9% |
| 10. Colorado | 7.7% |
| 11. South Dakota | 7.7% |
| 12. Hawaii | 7.5% |
| 13. Florida | 7.4% |
| 14. Maryland | 7.3% |
| 15. Nebraska | 7.3% |
| Bottom States | Percentage* |
|---|---|
| 1. Connecticut | 4.3% |
| 2. New Jersey | 4.5% |
| 3. Illinois | 4.5% |
| 4. New York | 4.7% |
| 5. Pennsylvania | 4.9% |
| 6. Rhode Island | 5.1% |
| 7. Michigan | 5.1% |
| 8. Ohio | 5.2% |
| 9. New Hampshire | 5.3% |
| 10. Massachusetts | 5.3% |
| 11. Mississippi | 5.4% |
| 12. Minnesota | 5.4% |
| 13. Georgia | 5.5% |
| 14. Kentucky | 5.5% |
| 15. Wisconsin | 5.5% |
*Percentage of employment in construction
Cities With the Most Construction Worker Growth
| Top Large Metros | Change* |
|---|---|
| 1. Phoenix-Mesa-Chandler, AZ | +34.2% |
| 2. Austin-Round Rock-San Marcos, TX | +31.1% |
| 3. Raleigh-Cary, NC | +30.0% |
| 4. Salt Lake City-Murray, UT | +28.3% |
| 5. Columbus, OH | +27.9% |
| 6. Indianapolis-Carmel-Greenwood, IN | +23.7% |
| 7. San Antonio-New Braunfels, TX | +22.0% |
| 8. Fresno, CA | +20.5% |
| 9. Louisville/Jefferson County, KY-IN | +17.2% |
| 10. Charlotte-Concord-Gastonia, NC-SC | +17.0% |
| 11. Kansas City, MO-KS | +16.5% |
| 12. Dallas-Fort Worth-Arlington, TX | +16.1% |
| 13. Tampa-St. Petersburg-Clearwater, FL | +15.8% |
| 14. Tucson, AZ | +15.5% |
| 15. Grand Rapids-Wyoming-Kentwood, MI | +15.1% |
| Bottom Large Metros | Change |
|---|---|
| 1. Pittsburgh, PA | -9.7% |
| 2. San Francisco-Oakland-Fremont, CA | -6.3% |
| 3. New York-Newark-Jersey City, NY-NJ | -4.2% |
| 4. Seattle-Tacoma-Bellevue, WA | -2.4% |
| 5. Baltimore-Columbia-Towson, MD | -0.7% |
| 6. Houston-Pasadena-The Woodlands, TX | -0.6% |
| 7. San Jose-Sunnyvale-Santa Clara, CA | -0.1% |
| 8. Los Angeles-Long Beach-Anaheim, CA | +0.1% |
| 9. Chicago-Naperville-Elgin, IL-IN | +0.9% |
| 10. Buffalo-Cheektowaga, NY | +1.4% |
| 11. Washington-Arlington-Alexandria, DC-VA-MD-WV | +2.3% |
| 12. Memphis, TN-MS-AR | +3.2% |
| 13. Philadelphia-Camden-Wilmington, PA-NJ-DE-MD | +3.5% |
| 14. Urban Honolulu, HI | +4.0% |
| 15. Boston-Cambridge-Newton, MA-NH | +4.1% |
| Top Midsize Metros | Change* |
|---|---|
| 1. Fayetteville-Springdale-Rogers, AR | +45.9% |
| 2. Boise City, ID | +36.4% |
| 3. Cape Coral-Fort Myers, FL | +30.8% |
| 4. Lafayette, LA | +29.9% |
| 5. Hickory-Lenoir-Morganton, NC | +28.4% |
| 6. Brownsville-Harlingen, TX | +28.4% |
| 7. Savannah, GA | +28.1% |
| 8. Jackson, MS | +26.7% |
| 9. Lansing-East Lansing, MI | +25.1% |
| 10. Port St. Lucie, FL | +24.6% |
| 11. Wilmington, NC | +24.6% |
| 12. Reno, NV | +24.4% |
| 13. Killeen-Temple, TX | +23.8% |
| 14. Shreveport-Bossier City, LA | +23.5% |
| 15. Greensboro-High Point, NC | +23.0% |
| Bottom Midsize Metros | Change* |
|---|---|
| 1. Vallejo, CA | -10.8% |
| 2. El Paso, TX | -5.7% |
| 3. Toledo, OH | -3.6% |
| 4. Syracuse, NY | -2.2% |
| 5. Bakersfield-Delano, CA | -1.9% |
| 6. Fort Collins-Loveland, CO | -1.7% |
| 7. Santa Rosa-Petaluma, CA | -1.3% |
| 8. Fayetteville, NC | -0.7% |
| 9. Allentown-Bethlehem-Easton, PA-NJ | No change |
| 10. Eugene-Springfield, OR | +0.8% |
| 11. Colorado Springs, CO | +1.1% |
| 12. Gulfport-Biloxi, MS | +2.1% |
| 13. Corpus Christi, TX | +3.1% |
| 14. Reading, PA | +3.2% |
| 15. Springfield, MA | +3.3% |
| Top Small Metros | Change* |
|---|---|
| 1. Eagle Pass, TX | +87.8% |
| 2. Kokomo, IN | +68.9% |
| 3. Elizabethtown, KY | +60.5% |
| 4. Helena, MT | +43.3% |
| 5. Warner Robins, GA | +42.4% |
| 6. Paducah, KY-IL | +39.3% |
| 7. Pocatello, ID | +37.8% |
| 8. Twin Falls, ID | +36.5% |
| 9. Daphne-Fairhope-Foley, AL | +35.0% |
| 10. Auburn-Opelika, AL | +34.9% |
| 11. Lake Havasu City-Kingman, AZ | +34.5% |
| 12. Wenatchee-East Wenatchee, WA | +33.2% |
| 13. Clarksville, TN-KY | +32.9% |
| 14. Sherman-Denison, TX | +32.2% |
| 15. St. George, UT | +31.7% |
| Bottom Small Metros | Change* |
|---|---|
| 1. Lake Charles, LA | -55.7% |
| 2. Wheeling, WV-OH | -26.8% |
| 3. Johnstown, PA | -22.2% |
| 4. Niles, MI | -13.6% |
| 5. Odessa, TX | -13.0% |
| 6. Victoria, TX | -12.5% |
| 7. Napa, CA | -11.2% |
| 8. Ames, IA | -9.4% |
| 9. Chico, CA | -8.9% |
| 10. Muncie, IN | -8.5% |
| 11. Williamsport, PA | -8.4% |
| 12. Beckley, WV | -7.4% |
| 13. Longview, TX | -7.2% |
| 14. Ithaca, NY | -6.8% |
| 15. Boulder, CO | -5.5% |
States With the Most Construction Worker Growth
| Top States | Change* |
|---|---|
| 1. Idaho | +35.5% |
| 2. Arizona | +32.3% |
| 3. Arkansas | +27.3% |
| 4. Utah | +26.3% |
| 5. Tennessee | +25.6% |
| 6. Montana | +24.5% |
| 7. South Dakota | +23.8% |
| 8. Maine | +17.7% |
| 9. North Carolina | +17.4% |
| 10. Indiana | +16.2% |
| 11. Kentucky | +16.2% |
| 12. New Hampshire | +15.9% |
| 13. Missouri | +15.8% |
| 14. Nebraska | +15.7% |
| 15. Florida | +15.0% |
| Bottom States | Change* |
|---|---|
| 1. West Virginia | -5.0% |
| 2. New York | -4.3% |
| 3. Louisiana | -1.3% |
| 4. Maryland | -1.1% |
| 5. Pennsylvania | -0.2% |
| 6. New Jersey | +2.9% |
| 7. Washington | +3.0% |
| 8. California | +3.1% |
| 9. Wyoming | +3.5% |
| 10. Oklahoma | +3.9% |
| 11. Illinois | +3.9% |
| 12. North Dakota | +4.1% |
| 13. Hawaii | +4.6% |
| 14. Massachusetts | +4.6% |
| 15. Colorado | +4.7% |
*5-year change in construction employment
Full Results
Methodology
To determine the locations with the most construction workers, researchers at Construction Coverage analyzed the latest data from the U.S. Bureau of Labor Statistics’ Quarterly Census of Employment and Wages. The researchers ranked locations by the percentage of total employment in the construction industry in 2024, the latest data available. In the event of a tie, the location with the greater total number of construction industry employees was ranked higher. The QCEW sometimes omits data to protect the identity, or identifiable information, of cooperating employers. Some metropolitan areas have “N/A” values that reflect these omissions or metropolitan boundary changes from prior years, and some metros were omitted entirely due to insufficient data.
To improve relevance, metros were grouped into cohorts based on population size: small (less than 350,000), midsize (350,000–1,000,000), and large (more than 1,000,000).
References
- Associated Builders and Contractors (January 24, 2025). ABC: Construction Industry Must Attract 439,000 Workers in 2025. https://www.abc.org/News-Media/News-Releases/abc-construction-industry-must-attract-439000-workers-in-2025.
- National Conference of State Legislatures (NCSL) (January 11, 2021). COVID-19: Essential Workers in the States. https://www.ncsl.org/labor-and-employment/covid-19-essential-workers-in-the-states#trades.
- U.S. Bureau of Labor Statistics (July 3, 2025). Unemployment Rate. https://fred.stlouisfed.org/series/UNRATE.
- Rogers, L., et al. (March 30, 2023). Domestic Outmigration From Some Urban Counties Slowed, Smaller Gains in Rural Counties. U.S. Census Bureau. https://www.census.gov/library/stories/2023/03/domestic-migration-trends-shifted.html.
- Fikri, K. (February 7, 2023). The Mountain West Is Winning Manufacturing’s New Build-Out. Economic Innovation Group. https://eig.org/mountain-west-leads-manufacturing-investment/.
- U.S. Bureau of Labor Statistics (2025). Quarterly Census of Employment and Wages. https://www.bls.gov/cew/.