
U.S. Cities With the Most Single-Family Homes
Note: This is the most recent release of our U.S. Cities With the Most Single-Family Homes study. To see data from prior years, please visit the Full Results section below.
The ongoing repercussions of the COVID-19 pandemic continue to shape the U.S. real estate market, influencing both the geographical preferences of families and their housing choices.
Initially, the pandemic prompted a migration of families from densely populated urban areas to more spacious homes in rural or suburban settings. Contributing factors such as increased personal savings rates, the rise of remote work flexibility, and historically low interest rates fueled a substantial demand for larger single-family homes.
In recent years, however, rising home prices and interest rates have strained affordability, particularly for first-time buyers and younger families with limited budgets. Return-to-office mandates by employers further complicate housing decisions. Taken together, these changes have increased demand for more affordable multi-family housing options, evident in recent construction trends.
Trends in Single-Family Residential Construction
High interest rates and housing costs have put downward pressure on single-family construction
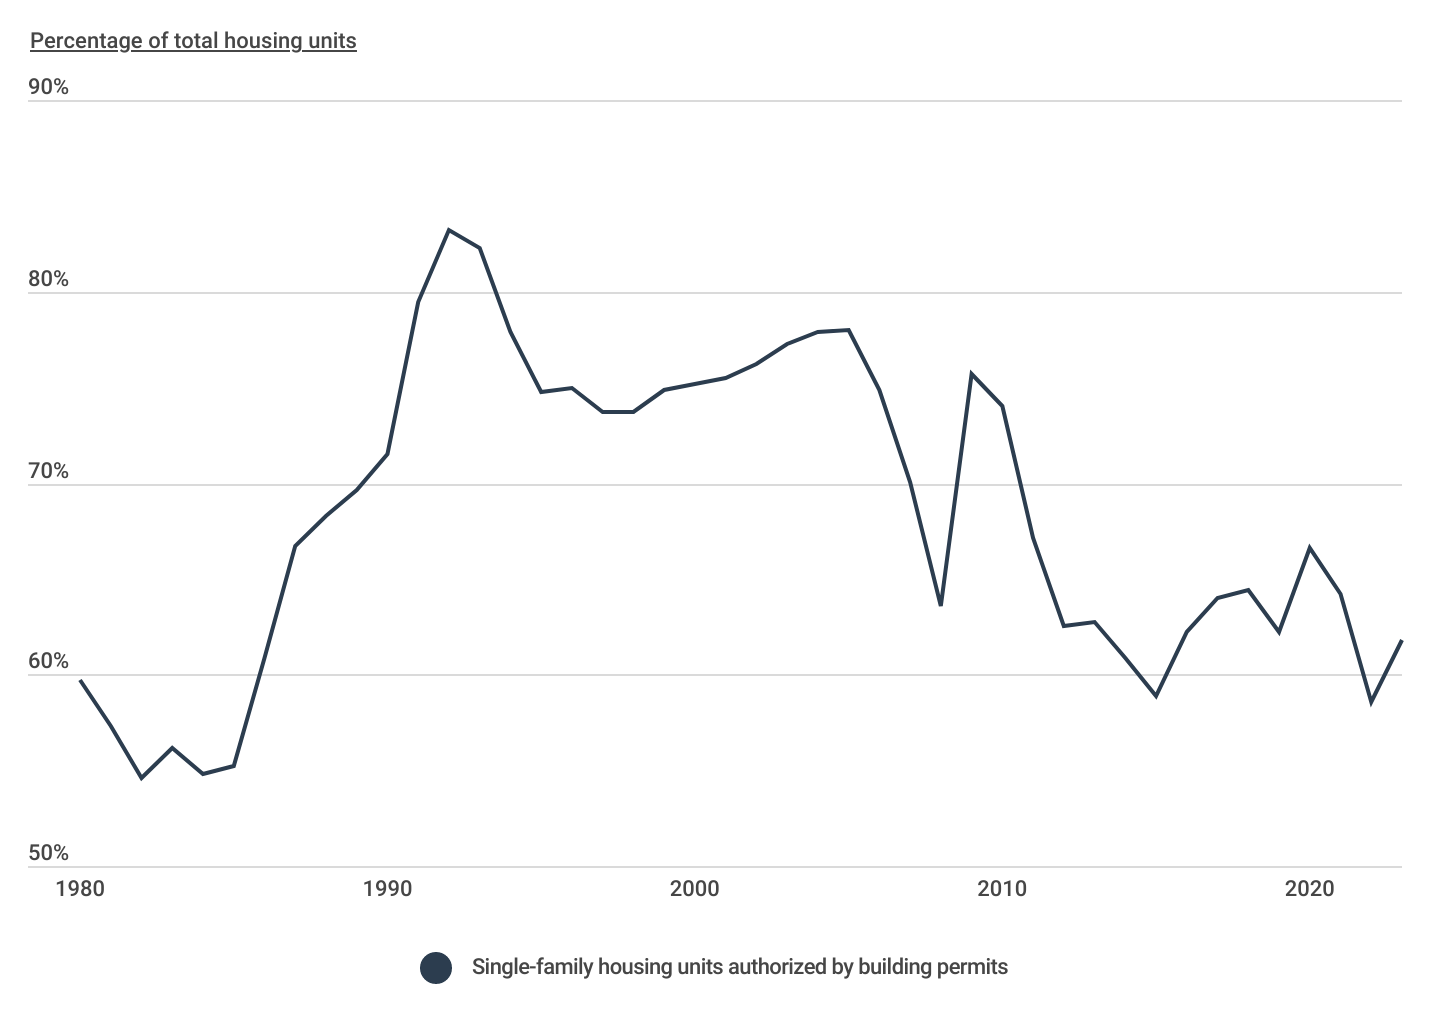
Since the peak of the U.S. housing bubble in the early 2000s, the proportion of housing units authorized for single-family homes has decreased significantly—from 78.0% in 2005 to 58.9% in 2015. Although there was a modest rebound in single-family construction post-2015, which gained momentum during the initial year of the pandemic amid heightened demand, this surge has since subsided. In 2023, only 61.8% of new construction was allocated to single-family units.
While as many as 89% of homebuyers would prefer a single-family home, recent construction trends diverge from this sentiment. This underinvestment has led to an estimated shortfall of approximately 6.5 million single-family homes, a primary contributor to elevated housing prices.
Owned vs. Rented Single-Family Housing
Only about one-third of renters live in single-family units, compared to 89% of owners
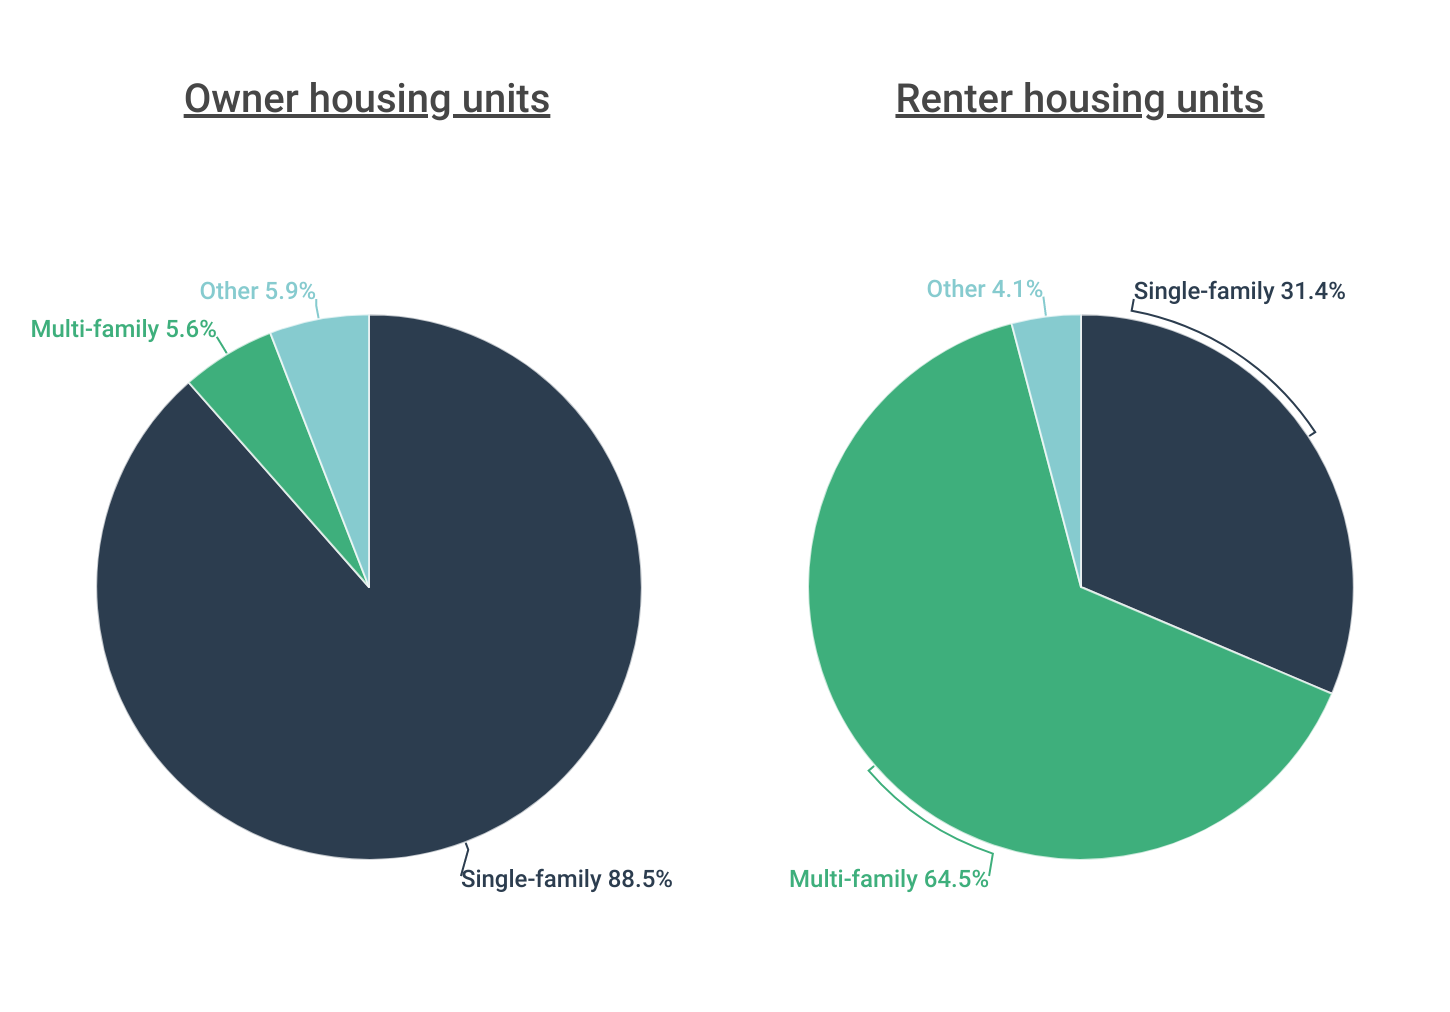
Americans’ strong preference for single-family homes observed during the early stages of the pandemic also extended to the rental market before softening in recent months. Only about one-third of renters (31.4%) live in single-family units, compared to 88.5% of owners. But during the pandemic, there was a notable surge in demand for single-family rentals, causing rent prices to reach record levels. According to CoreLogic, single-family rents experienced double-digit percentage increases year-over-year in 2021 and 2022 before stabilizing in 2023.
Single-Family Housing by Location
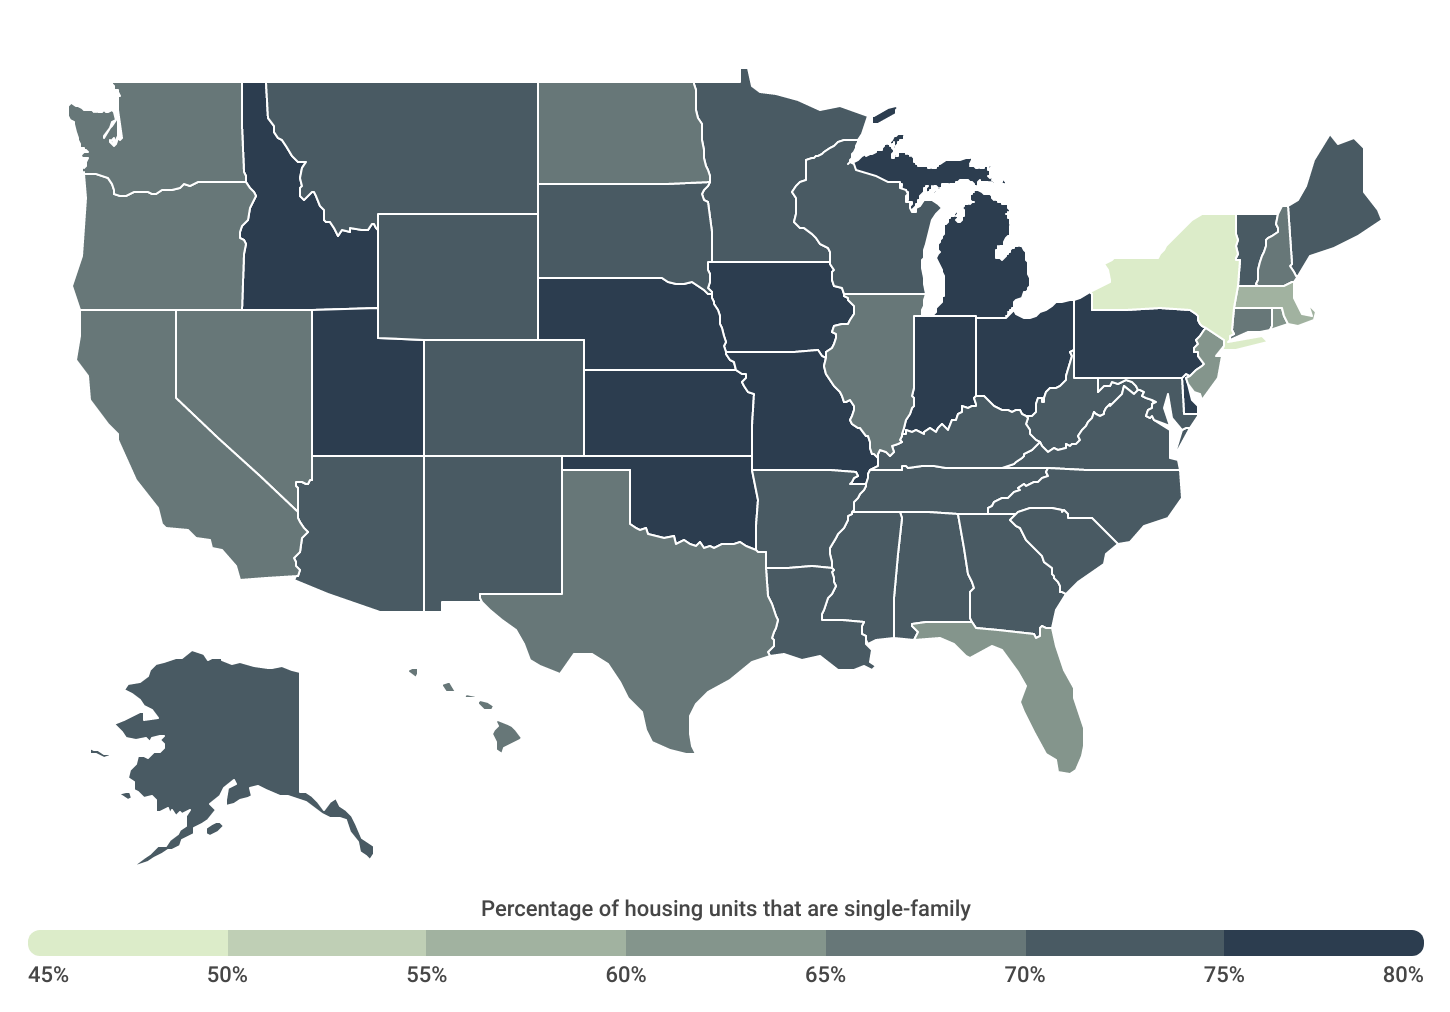
New York is the only state in which single-family homes account for <50% of total
FOR CONSTRUCTION PROFESSIONALS
Having the right construction software can make all the difference when it comes to running a successful business. Implementing construction bidding software can improve your odds of winning new contracts, while contractor accounting software will allow you to better keep tabs on the profitability of each individual job.
But while adequate supply of single-family homes is a current challenge, single-family units remain the norm in most places. New York is the only state where multi-family units constitute the majority of housing (46.8% single-family units). In contrast, 35 states have 70% or more single-family units, with Idaho (78.3%), Iowa (78.2%), and Kansas (78.1%) leading the way.
Among large cities with populations exceeding 350,000, the share of single-family housing varies from a high of 74.2% in Detroit to a low of 17.0% in New York City. However, when considering cities with populations of 100,000 or more, numerous suburbs of larger urban areas boast a share of single-family homes exceeding 90%. Examples include Rio Rancho, NM (suburb of Albuquerque), Buckeye, AZ (suburb of Phoenix), and Lehigh Acres, FL (suburb of Fort Myers).
Below is a complete breakdown of single-family housing for more than 300 U.S. cities and all 50 states. The analysis was conducted by Construction Coverage using data from the U.S. Census Bureau. For more information, refer to the methodology section.
Large Cities With the Most Single-Family Homes
| Top Cities | Percentage* |
|---|---|
| 1. Detroit, MI | 74.2% |
| 2. Wichita, KS | 73.9% |
| 3. Bakersfield, CA | 73.8% |
| 4. Oklahoma City, OK | 72.3% |
| 5. Fort Worth, TX | 71.5% |
| 6. Virginia Beach, VA | 71.4% |
| 7. Albuquerque, NM | 70.9% |
| 8. Las Vegas, NV | 70.6% |
| 9. El Paso, TX | 70.1% |
| 10. Colorado Springs, CO | 69.6% |
| 11. Arlington, TX | 68.9% |
| 12. Sacramento, CA | 68.4% |
| 13. Memphis, TN | 68.3% |
| 14. Louisville, KY | 68.2% |
| 15. Omaha, NE | 68.1% |
| Bottom Cities | Percentage* |
|---|---|
| 1. New York, NY | 17.0% |
| 2. Boston, MA | 18.8% |
| 3. Chicago, IL | 30.3% |
| 4. Miami, FL | 31.1% |
| 5. San Francisco, CA | 32.3% |
| 6. Washington, DC | 32.5% |
| 7. Atlanta, GA | 42.0% |
| 8. Los Angeles, CA | 42.4% |
| 9. Seattle, WA | 44.4% |
| 10. Minneapolis, MN | 44.8% |
| 11. Milwaukee, WI | 44.8% |
| 12. Dallas, TX | 46.0% |
| 13. Long Beach, CA | 46.9% |
| 14. Oakland, CA | 48.7% |
| 15. Houston, TX | 49.3% |
Midsize Cities With the Most Single-Family Homes
| Top Cities | Percentage* |
|---|---|
| 1. Port St. Lucie, FL | 91.7% |
| 2. Surprise, AZ | 90.0% |
| 3. Elk Grove, CA | 88.1% |
| 4. Gilbert, AZ | 87.4% |
| 5. Cape Coral, FL | 84.0% |
| 6. Palmdale, CA | 82.9% |
| 7. Chesapeake, VA | 82.1% |
| 8. Peoria, AZ | 82.1% |
| 9. Fontana, CA | 81.4% |
| 10. North Las Vegas, NV | 80.8% |
| 11. Moreno Valley, CA | 80.6% |
| 12. Enterprise, NV | 79.4% |
| 13. Roseville, CA | 79.2% |
| 14. Montgomery, AL | 78.6% |
| 15. Stockton, CA | 77.4% |
| Bottom Cities | Percentage* |
|---|---|
| 1. Jersey City, NJ | 14.2% |
| 2. Paterson, NJ | 23.0% |
| 3. Newark, NJ | 25.7% |
| 4. Yonkers, NY | 29.4% |
| 5. Providence, RI | 34.2% |
| 6. Arlington, VA | 35.6% |
| 7. Worcester, MA | 35.9% |
| 8. Glendale, CA | 36.8% |
| 9. Alexandria, VA | 37.1% |
| 10. Honolulu, HI | 37.2% |
| 11. Orlando, FL | 42.5% |
| 12. Paradise, NV | 42.8% |
| 13. Buffalo, NY | 43.4% |
| 14. Irving, TX | 43.6% |
| 15. Fort Lauderdale, FL | 44.7% |
Small Cities With the Most Single-Family Homes
| Top Cities | Percentage* |
|---|---|
| 1. Rio Rancho, NM | 93.3% |
| 2. Buckeye, AZ | 93.2% |
| 3. Lehigh Acres, FL | 90.7% |
| 4. Spring Hill, FL | 90.1% |
| 5. Sugar Land, TX | 89.0% |
| 6. Menifee, CA | 88.2% |
| 7. Palm Bay, FL | 85.3% |
| 8. Hesperia, CA | 85.0% |
| 9. South Fulton, GA | 84.9% |
| 10. Goodyear, AZ | 84.7% |
| 11. Highlands Ranch, CO | 84.4% |
| 12. Joliet, IL | 84.2% |
| 13. Warren, MI | 83.8% |
| 14. Broken Arrow, OK | 83.5% |
| 15. Meridian, ID | 83.4% |
| Bottom Cities | Percentage* |
|---|---|
| 1. Cambridge, MA | 15.3% |
| 2. Hartford, CT | 21.9% |
| 3. Elizabeth, NJ | 22.0% |
| 4. New Haven, CT | 27.3% |
| 5. New Bedford, MA | 29.7% |
| 6. Albany, NY | 31.1% |
| 7. Stamford, CT | 39.5% |
| 8. Quincy, MA | 40.8% |
| 9. Lynn, MA | 41.0% |
| 10. Lowell, MA | 41.1% |
| 11. Bridgeport, CT | 41.3% |
| 12. Pompano Beach, FL | 41.6% |
| 13. Fargo, ND | 41.9% |
| 14. Gainesville, FL | 43.4% |
| 15. Inglewood, CA | 43.6% |
States With the Most Single-Family Homes
| Top States | Percentage* |
|---|---|
| 1. Idaho | 78.3% |
| 2. Iowa | 78.2% |
| 3. Kansas | 78.1% |
| 4. Indiana | 77.9% |
| 5. Delaware | 77.8% |
| 6. Michigan | 77.4% |
| 7. Nebraska | 76.3% |
| 8. Utah | 76.2% |
| 9. Pennsylvania | 76.0% |
| 10. Oklahoma | 75.6% |
| 11. Missouri | 75.2% |
| 12. Ohio | 75.2% |
| 13. West Virginia | 74.7% |
| 14. Wyoming | 73.9% |
| 15. Tennessee | 73.9% |
| Bottom States | Percentage* |
|---|---|
| 1. New York | 46.8% |
| 2. Massachusetts | 56.5% |
| 3. Rhode Island | 61.1% |
| 4. New Jersey | 63.3% |
| 5. Florida | 64.4% |
| 6. California | 65.2% |
| 7. North Dakota | 65.6% |
| 8. Illinois | 65.6% |
| 9. Connecticut | 65.7% |
| 10. Hawaii | 66.6% |
| 11. Washington | 67.2% |
| 12. Oregon | 67.9% |
| 13. Nevada | 68.0% |
| 14. Texas | 68.5% |
| 15. New Hampshire | 69.0% |
*Percentage of housing units that are single-family
FOR CONSTRUCTION PROFESSIONALS
Whether you specialize in new single-family homes or commercial projects, having the right insurance for your construction business is critical. The following policy types are the bare minimum any business should have:
- Builders risk insurance – to protect the project during the course of construction
- Commercial auto insurance – to protect vehicles used for business purposes
- Inland marine insurance – to protect tools and equipment while in transit
- Commercial property insurance – to protect your office building or warehouse from damage or theft
Methodology
The data used in this analysis is from the U.S. Census Bureau’s 2022 American Community Survey 1-Year Estimates. To determine the locations with the most single-family homes, researchers calculated the percentage of housing units that are single-family, defined as “single unit, detached” or “single unit, attached”. In the event of a tie, the location with the higher percentage of owner-occupied housing units that are single-family was ranked higher. To improve relevance, only cities with at least 100,000 residents were included. Additionally, cities were grouped into cohorts based on population size: small (100,000–149,999), midsize (150,000–349,999), and large (350,000 or more).
References
- Cohn, D. (July 6, 2020). About a fifth of U.S. adults moved due to COVID-19 or know someone who did. Pew Research Center. https://www.pewresearch.org/short-reads/2020/07/06/about-a-fifth-of-u-s-adults-moved-due-to-covid-19-or-know-someone-who-did/.
- Swaminathan, A. (March 8, 2023). U.S. Has a Shortfall of 6.5 Million Single-Family Homes Due to a Decade of Under-Building, Report Says. Realtor.com. https://www.realtor.com/news/trends/u-s-has-a-shortfall-of-6-5-million-single-family-homes-due-to-a-decade-of-under-building-report-says/.
- Ibid.
- CoreLogic (January 16, 2024). US Annual Rent Growth Holds at Less Than 3% in November, CoreLogic Reports. https://www.corelogic.com/press-releases/us-annual-rent-growth-holds-less-than-3-in-november/.
- U.S. Census Bureau (2022). American Community Survey. https://www.census.gov/programs-surveys/acs.