
The Most Transient American Cities
The United States has long been a mobile nation. Throughout America’s earliest days as a colonial outpost, the exploration of the frontier, the urbanization of industrial cities, and the postwar suburban boom, the freedom to venture out in search of opportunity has been a lasting American idea. And yet now, in the modern era, data shows that movement in the U.S. has been steadily declining for nearly four decades.
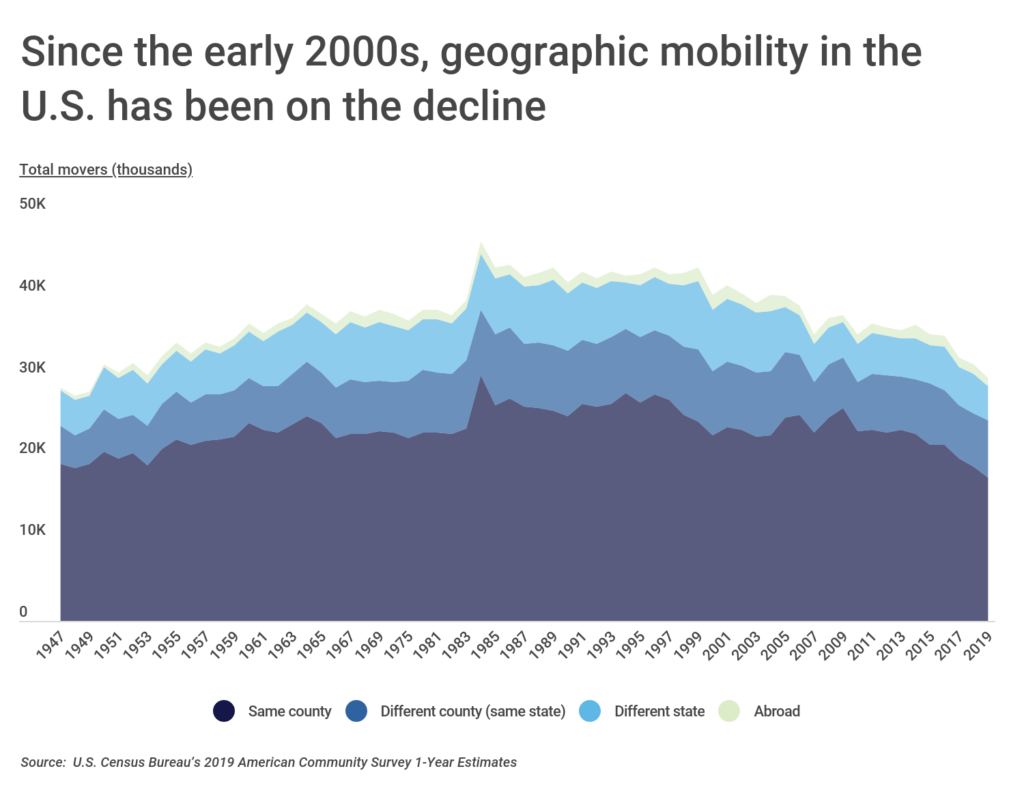
According to U.S. Census data, geographic mobility peaked in the late 1980s, then held steady through the 1990s before entering a slow decline at the beginning of this century. Multiple factors explain this trend. For one, Baby Boomers—until recently the largest segment of the American population—began to reach middle age in the 1990s. At a point when many Boomers were established in their careers, raising children, and owning homes, they became less likely to demonstrate the mobility of their youth. More recently, the economic turbulence to housing and labor markets brought on by the Great Recession pushed mobility further downward. Simultaneously, many desirable locations have become more expensive, which makes it more difficult for people to move both between and within geographic areas.
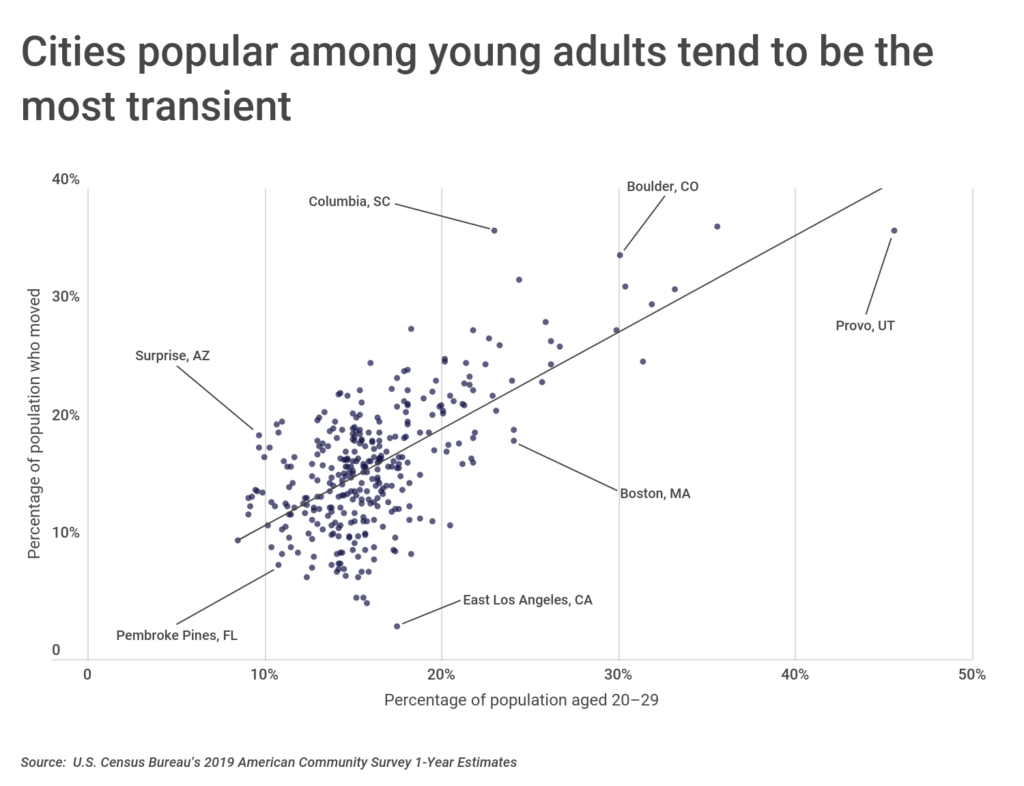
While these trends have decreased mobility for younger generations in particular, young adults still tend to be the most transient age group. This makes sense: every year, students leave their hometowns for college, new graduates relocate to new places early in their careers in search of good jobs and opportunity, and families move into new homes together as young people marry and begin to have children. In 2019—as in other recent years—many of the areas with a large population of young adults were also the areas considered most transient.
But as with many other aspects of American life, the ongoing COVID-19 pandemic is likely to change this picture. Many Americans, especially in dense urban areas, have begun to reconsider their living arrangements in response to COVID-19 shutdowns and social distancing measures. The pandemic has put a premium on living space, both for health reasons—given the need to socially distance—and in light of many households’ transition to working and schooling from home. Meanwhile, the typically transient student population is staying in place more than ever, bypassing the residential college experience in favor of remote learning.
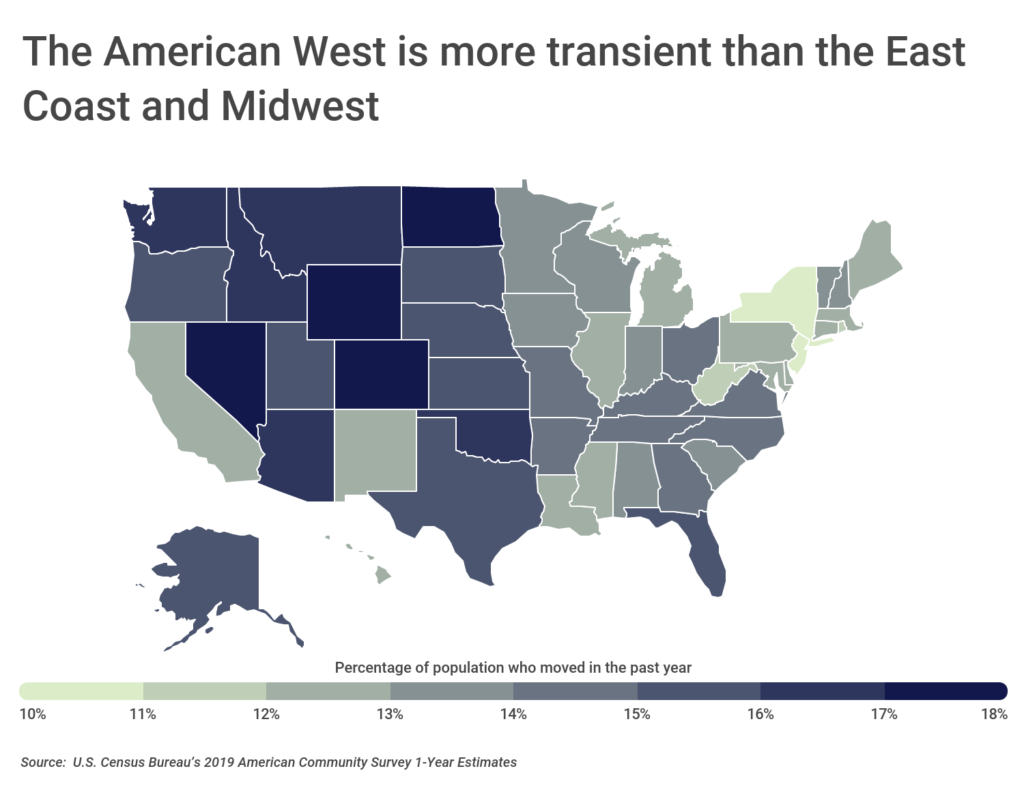
Geographically, this shift in preferences could reinforce existing patterns in population growth and movement. In recent years, the Western United States has had a greater rate of population growth than other parts of the country, driven in part by migration from more expensive population centers like California. By definition, this had made the population more transient, and with people increasingly seeking out more space at a lower cost, states like Nevada and Colorado could have new appeal for movers.
At the city level, however, it remains the case that cities with high percentages of students and young adults tend to be more transient than others. Cities like Boulder and Provo—where the University of Colorado and Brigham Young University are respectively located—have some of the largest populations of people aged 20-29 and are also among the most transient.
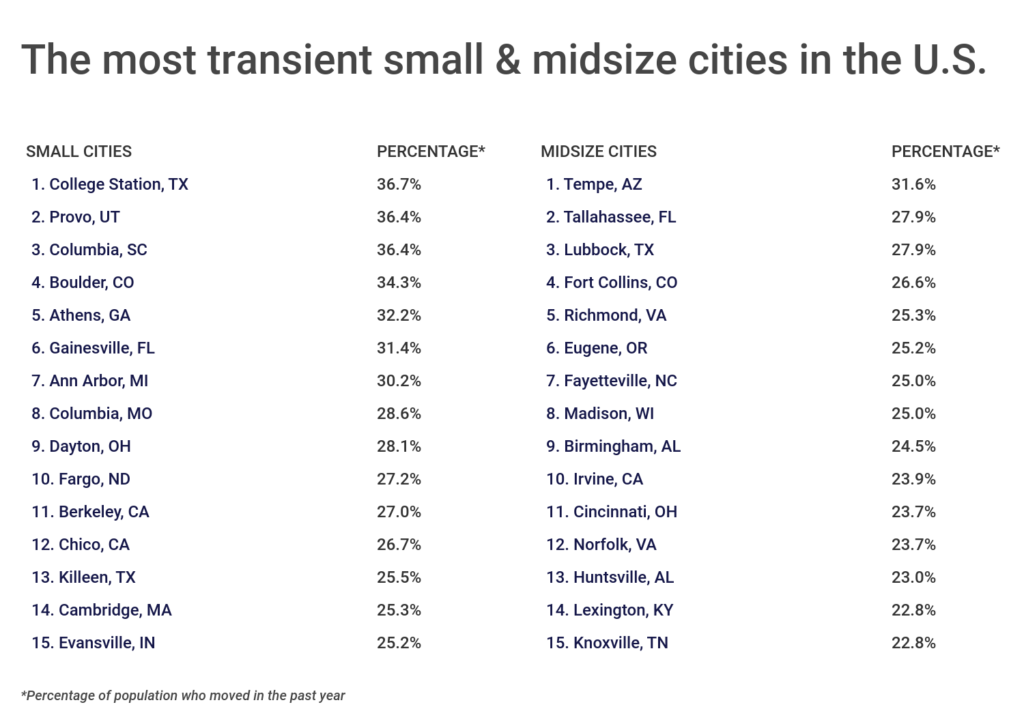
To identify the most transient locations in the U.S., researchers at Construction Coverage used U.S. Census data to calculate the percentage of each location’s 2019 population that had moved within the past year, including people who moved within the same county, from a different county, from a different state, or from abroad. The researchers also pulled data on the population age 20-29 and included the raw number of total movers for added context on the mobile population.
Here are the most transient cities in the U.S.
The Most Transient Large Cities in the U.S.
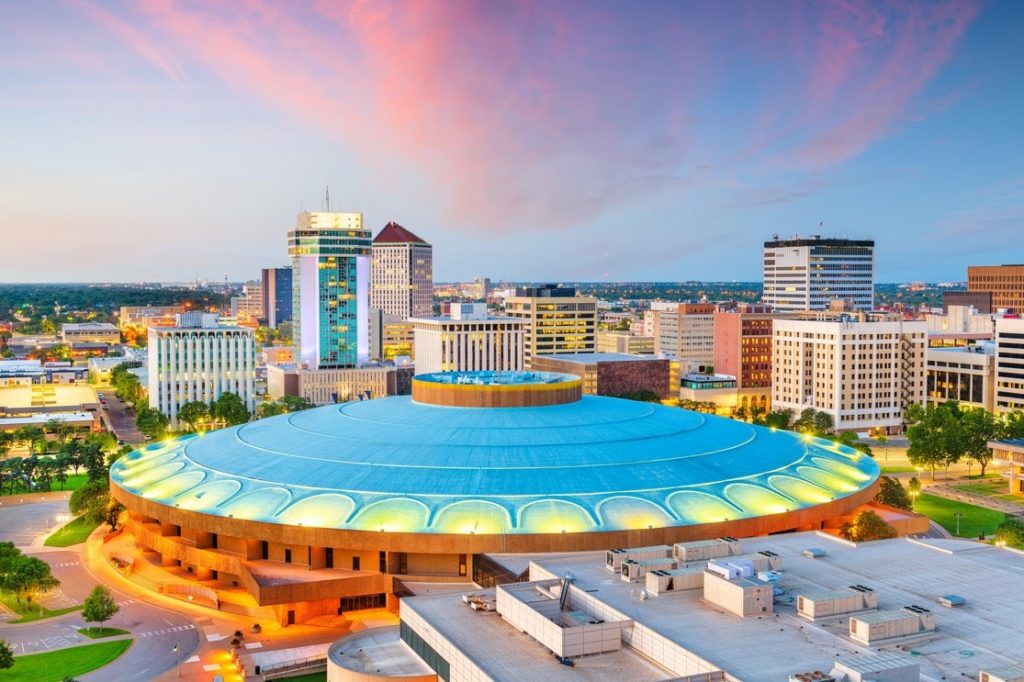
Photo Credit: Alamy Stock Photo
15. Wichita, KS
- Percentage of population who moved in the past year: 18.7%
- Total movers: 72,016
- Moved within the same county: 55,211
- Moved from different county (same state): 5,872
- Moved from a different state: 9,610
- Moved from abroad: 1,323
- Population: 384,278
- Percentage of population aged 20-29: 15.0%
TRENDING
Breaking ground on a new project? It’s important to make sure you have adequate insurance. Read our complete construction insurance guide or head straight to our guide on builders risk insurance.

Photo Credit: Alamy Stock Photo
14. Denver, CO
- Percentage of population who moved in the past year: 18.9%
- Total movers: 136,103
- Moved within the same county: 58,722
- Moved from different county (same state): 35,430
- Moved from a different state: 37,016
- Moved from abroad: 4,935
- Population: 719,506
- Percentage of population aged 20-29: 18.0%

Photo Credit: Alamy Stock Photo
13. Oklahoma City, OK
- Percentage of population who moved in the past year: 18.9%
- Total movers: 122,007
- Moved within the same county: 75,122
- Moved from different county (same state): 24,278
- Moved from a different state: 19,319
- Moved from abroad: 3,288
- Population: 644,618
- Percentage of population aged 20-29: 15.1%

Photo Credit: Alamy Stock Photo
12. Washington, DC
- Percentage of population who moved in the past year: 19.2%
- Total movers: 133,758
- Moved within the same county: 64,893
- Moved from different county (same state): 0
- Moved from a different state: 58,879
- Moved from abroad: 9,986
- Population: 697,556
- Percentage of population aged 20-29: 18.8%

Photo Credit: Alamy Stock Photo
11. Aurora, CO
- Percentage of population who moved in the past year: 19.4%
- Total movers: 72,896
- Moved within the same county: 31,893
- Moved from different county (same state): 26,310
- Moved from a different state: 12,273
- Moved from abroad: 2,420
- Population: 375,979
- Percentage of population aged 20-29: 15.2%

Photo Credit: Alamy Stock Photo
10. Tulsa, OK
- Percentage of population who moved in the past year: 19.6%
- Total movers: 77,767
- Moved within the same county: 51,291
- Moved from different county (same state): 11,526
- Moved from a different state: 12,798
- Moved from abroad: 2,152
- Population: 396,163
- Percentage of population aged 20-29: 15.0%
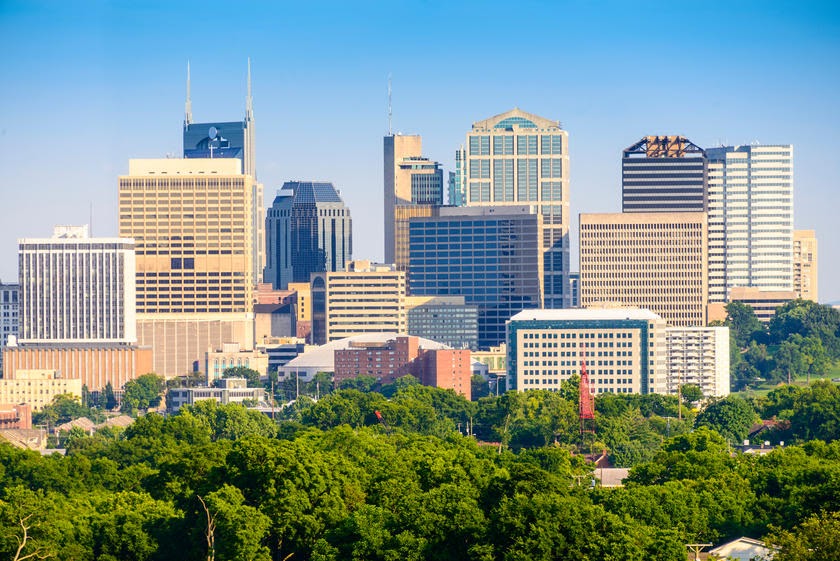
Photo Credit: Alamy Stock Photo
9. Nashville, TN
- Percentage of population who moved in the past year: 19.9%
- Total movers: 130,518
- Moved within the same county: 74,793
- Moved from different county (same state): 20,948
- Moved from a different state: 27,642
- Moved from abroad: 7,135
- Population: 657,228
- Percentage of population aged 20-29: 18.1%

Photo Credit: Alamy Stock Photo
8. Tampa, FL
- Percentage of population who moved in the past year: 20.5%
- Total movers: 80,778
- Moved within the same county: 48,765
- Moved from different county (same state): 15,750
- Moved from a different state: 12,159
- Moved from abroad: 4,104
- Population: 394,908
- Percentage of population aged 20-29: 15.2%
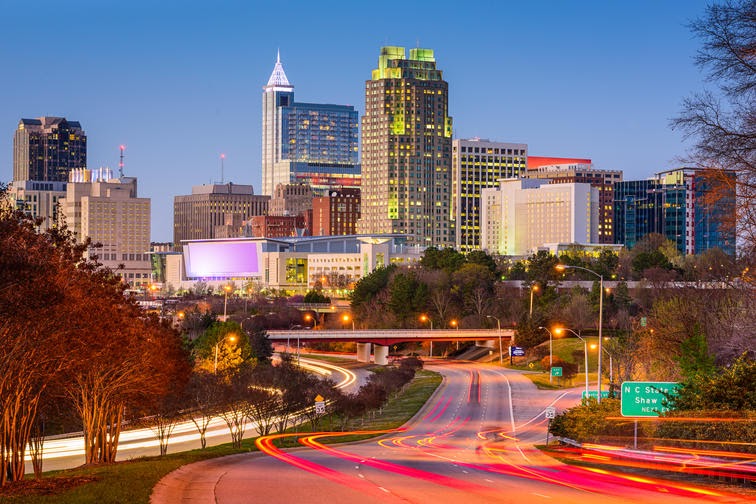
Photo Credit: Alamy Stock Photo
7. Raleigh, NC
- Percentage of population who moved in the past year: 21.0%
- Total movers: 98,635
- Moved within the same county: 58,167
- Moved from different county (same state): 21,045
- Moved from a different state: 16,355
- Moved from abroad: 3,068
- Population: 469,096
- Percentage of population aged 20-29: 18.0%
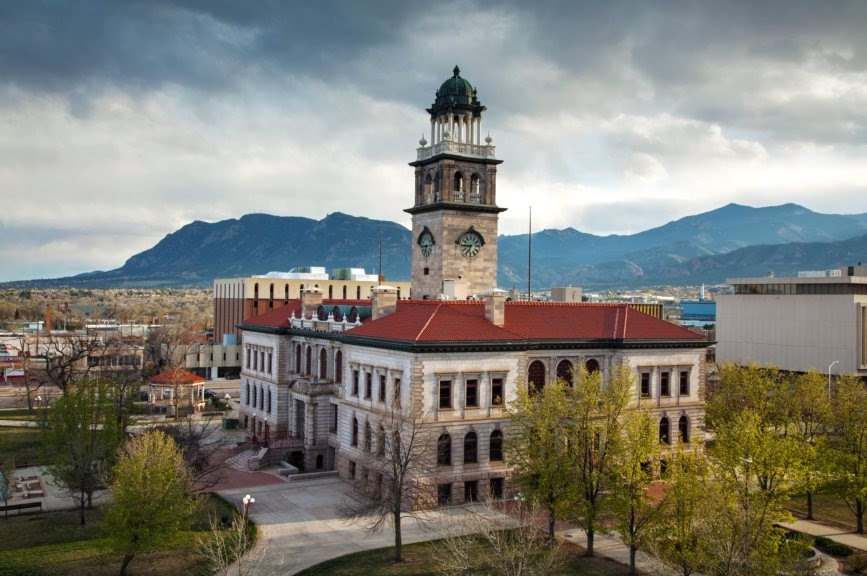
Photo Credit: Alamy Stock Photo
6. Colorado Springs, CO
- Percentage of population who moved in the past year: 21.4%
- Total movers: 101,268
- Moved within the same county: 53,076
- Moved from different county (same state): 12,886
- Moved from a different state: 33,502
- Moved from abroad: 1,804
- Population: 472,541
- Percentage of population aged 20-29: 17.5%
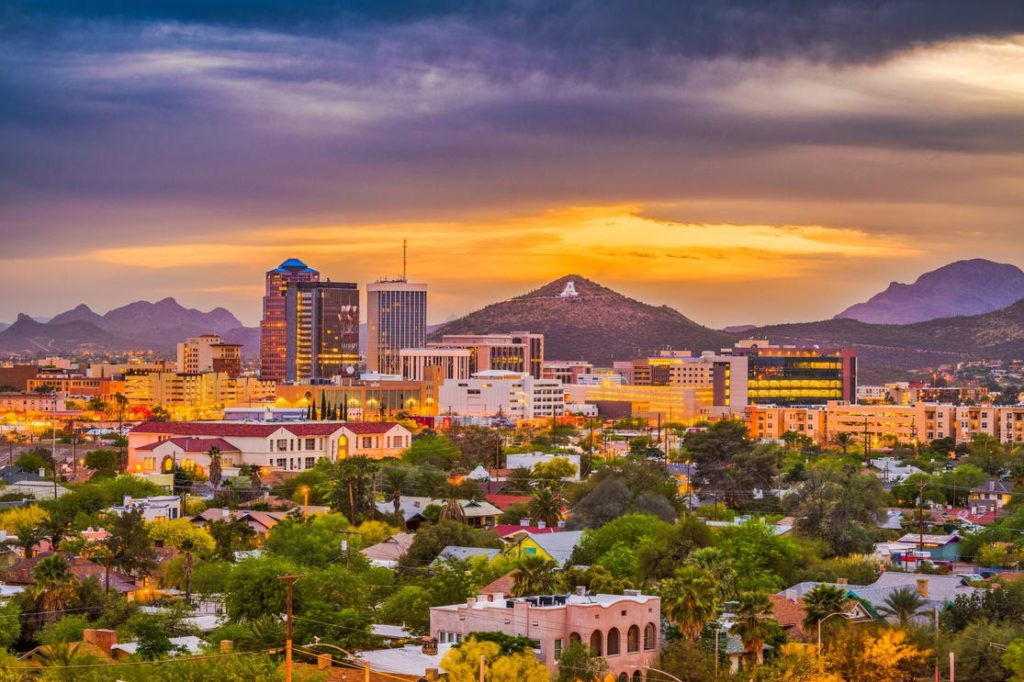
Photo Credit: Alamy Stock Photo
5. Tucson, AZ
- Percentage of population who moved in the past year: 21.6%
- Total movers: 117,121
- Moved within the same county: 80,084
- Moved from different county (same state): 11,768
- Moved from a different state: 19,050
- Moved from abroad: 6,219
- Population: 543,386
- Percentage of population aged 20-29: 20.0%

Photo Credit: Alamy Stock Photo
4. Austin, TX
- Percentage of population who moved in the past year: 22.1%
- Total movers: 213,743
- Moved within the same county: 126,443
- Moved from different county (same state): 43,408
- Moved from a different state: 30,690
- Moved from abroad: 13,202
- Population: 967,577
- Percentage of population aged 20-29: 19.0%

Photo Credit: Alamy Stock Photo
3. Columbus, OH
- Percentage of population who moved in the past year: 22.7%
- Total movers: 201,275
- Moved within the same county: 146,260
- Moved from different county (same state): 31,649
- Moved from a different state: 18,109
- Moved from abroad: 5,257
- Population: 887,026
- Percentage of population aged 20-29: 19.5%

Photo Credit: Alamy Stock Photo
2. Seattle, WA
- Percentage of population who moved in the past year: 23.4%
- Total movers: 175,193
- Moved within the same county: 113,430
- Moved from different county (same state): 13,772
- Moved from a different state: 36,926
- Moved from abroad: 11,065
- Population: 747,296
- Percentage of population aged 20-29: 21.3%

Photo Credit: Alamy Stock Photo
1. Minneapolis, MN
- Percentage of population who moved in the past year: 24.0%
- Total movers: 101,783
- Moved within the same county: 62,011
- Moved from different county (same state): 19,312
- Moved from a different state: 16,028
- Moved from abroad: 4,432
- Population: 423,224
- Percentage of population aged 20-29: 21.6%
Methodology & Detailed Findings
The data used in this analysis is from the U.S. Census Bureau’s 2019 American Community Survey 1-Year Estimates. To identify the most transient locations in the U.S., researchers at Construction Coverage calculated the percentage of each location’s 2019 population that had moved within the past year. This includes people who moved within the same county, from a different county, from a different state, or from abroad. Only cities with at least 100,000 people were included in the analysis. Additionally, cities were grouped based on population size: small (100,000-149,999), midsize (150,000-349,999), and large (350,000 or more).