
The Most Unionized Cities in America
Note: This is the most recent release of our Most Unionized Cities in America study. To see data from prior years, please visit the Full Results section below.
Labor unions in the United States have experienced significant changes over the past several decades. Once a pillar for American workers, unions have seen their influence wane due to a combination of economic, political, and technological forces. Employer opposition, the rise of contract and gig-based work, globalization, and evolving labor laws have all contributed to a steady decline in union membership. These shifts have affected a wide range of occupations—from skilled trades like carpentry and plumbing to public-sector roles such as education and emergency response.
In recent years, however, interest in organized labor has experienced a resurgence. Growing public support for unions, high-profile organizing efforts at major corporations, and nationwide strikes in education, transportation, and entertainment have all signaled renewed momentum. At the same time, political developments continue to shape the landscape. In March 2025, President Donald Trump signed an executive order aimed at eliminating collective bargaining rights for more than one million federal employees—a move that union leaders view as part of a broader strategy to curtail organized labor across the country.
Against this backdrop, this report by Construction Coverage explores how union membership has changed over time, the differences in pay between union and non-union workers, and where unionization remains strongest at the state and city levels.
Hiring employees in a unionized city?
Whether you’re operating with union or non-union labor, most states require workers’ comp coverage. Learn what your business needs to stay compliant with this guide to workers’ compensation insurance.
What Percentage of U.S. Workers Are Union Members?
Only 9.9% of American workers are union members, down from 24.1% in 1979
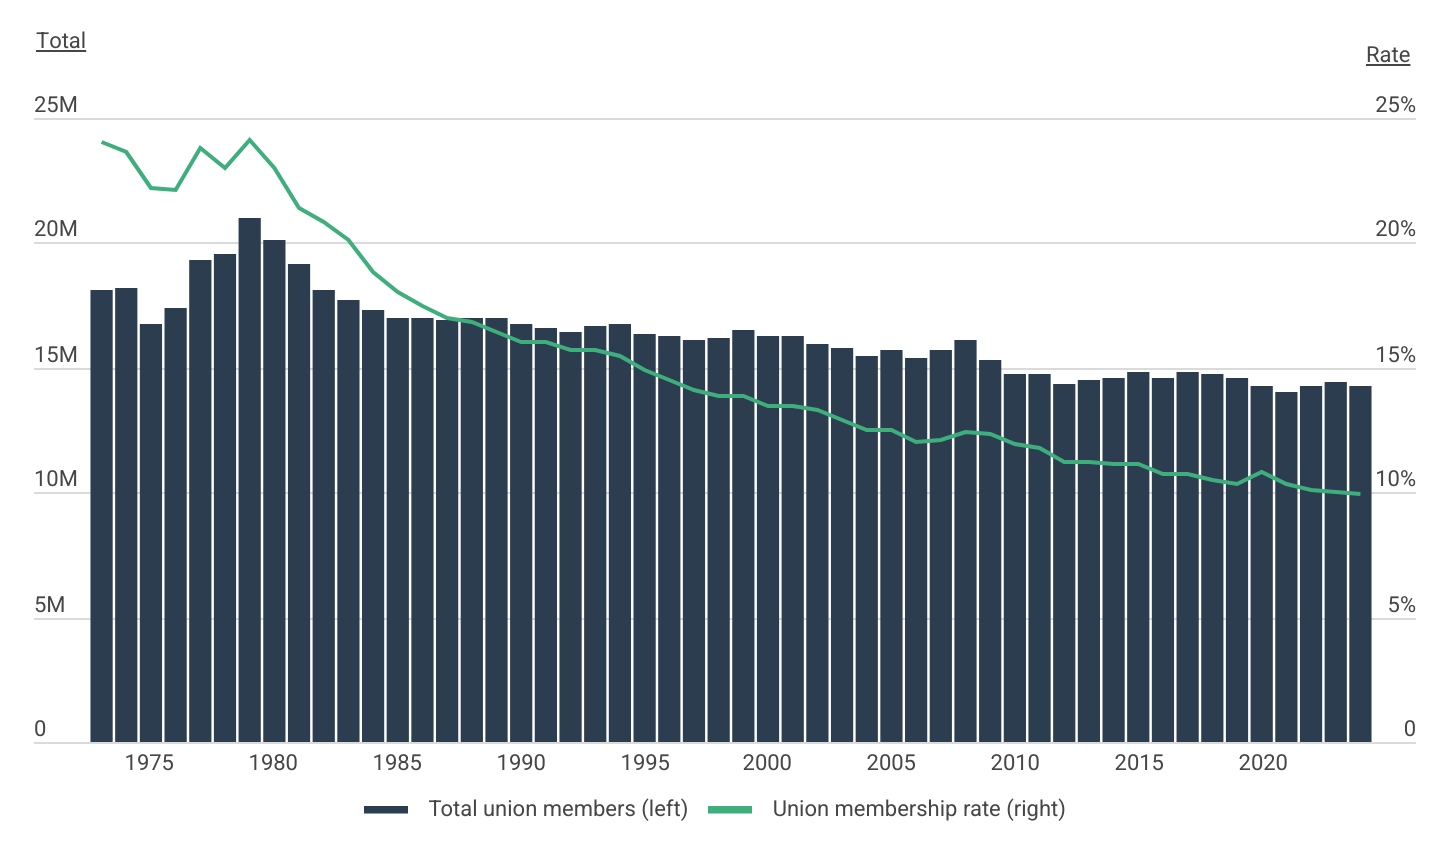
Data: U.S. Union Membership Over Time
| Year | Total union members | Union membership rate |
|---|---|---|
| 1973 | 18,088,600 | 24.0% |
| 1974 | 18,176,500 | 23.6% |
| 1975 | 16,778,300 | 22.2% |
| 1976 | 17,403,000 | 22.1% |
| 1977 | 19,335,100 | 23.8% |
| 1978 | 19,548,400 | 23.0% |
| 1979 | 20,986,100 | 24.1% |
| 1980 | 20,095,300 | 23.0% |
| 1981 | 19,137,300 | 21.4% |
| 1983 | 17,717,400 | 20.1% |
| 1984 | 17,339,800 | 18.8% |
| 1985 | 16,996,100 | 18.0% |
| 1986 | 16,975,200 | 17.5% |
| 1987 | 16,913,100 | 17.0% |
| 1988 | 17,001,700 | 16.8% |
| 1989 | 16,960,500 | 16.4% |
| 1990 | 16,776,000 | 16.0% |
| 1991 | 16,611,800 | 16.0% |
| 1992 | 16,418,200 | 15.7% |
| 1993 | 16,627,500 | 15.7% |
| 1994 | 16,740,300 | 15.5% |
| 1995 | 16,359,600 | 14.9% |
| 1996 | 16,269,400 | 14.5% |
| 1997 | 16,109,900 | 14.1% |
| 1998 | 16,211,400 | 13.9% |
| 1999 | 16,476,700 | 13.9% |
| 2000 | 16,258,200 | 13.5% |
| 2001 | 16,288,800 | 13.5% |
| 2002 | 15,978,700 | 13.3% |
| 2003 | 15,776,000 | 12.9% |
| 2004 | 15,471,600 | 12.5% |
| 2005 | 15,685,400 | 12.5% |
| 2006 | 15,359,100 | 12.0% |
| 2007 | 15,670,300 | 12.1% |
| 2008 | 16,097,500 | 12.4% |
| 2009 | 15,327,300 | 12.3% |
| 2010 | 14,715,100 | 11.9% |
| 2011 | 14,754,700 | 11.8% |
| 2012 | 14,349,400 | 11.2% |
| 2013 | 14,515,800 | 11.2% |
| 2014 | 14,569,900 | 11.1% |
| 2015 | 14,786,300 | 11.1% |
| 2016 | 14,549,600 | 10.7% |
| 2017 | 14,811,500 | 10.7% |
| 2018 | 14,740,200 | 10.5% |
| 2019 | 14,566,700 | 10.3% |
| 2020 | 14,250,200 | 10.8% |
| 2021 | 14,003,600 | 10.3% |
| 2022 | 14,280,100 | 10.1% |
| 2023 | 14,415,200 | 10.0% |
| 2024 | 14,245,500 | 9.9% |
Union membership in the United States has declined to its lowest point in decades. In 1979, unions represented 24.1% of the American workforce. By 2024, that share had fallen to just 9.9%, according to figures from the U.S. Bureau of Labor Statistics and UnionStats. In absolute terms, this represents a drop of roughly 6.7 million members—from a peak of 20.9 million in 1979 to around 14.2 million in 2024.
This contraction has reshaped the role of organized labor in the U.S. economy. While union presence remains relatively strong in certain public-sector roles and heavily unionized industries, much of the workforce now operates in environments where collective bargaining is less common. Yet despite their declining numbers, unionized workers continue to see notable advantages—particularly when it comes to wages and benefits—compared to their non-union counterparts.
Do Union Workers Earn More Than Non-Union Workers?
In 2024, union workers earned 17.5% more than non-union workers
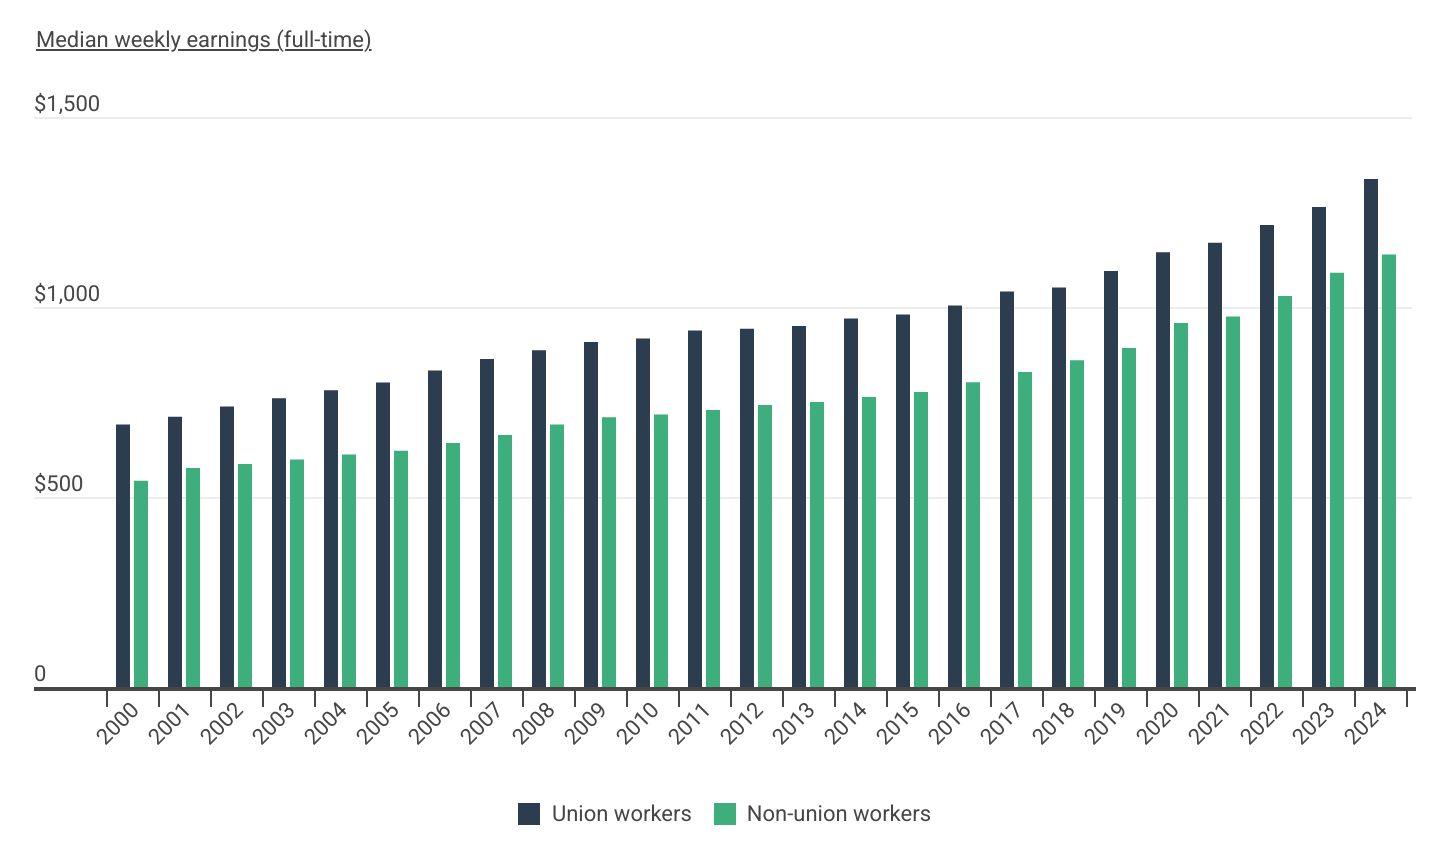
Data: Union Worker vs. Non-Union Worker Earnings Over Time
| Year | Union workers | Non-union workers |
|---|---|---|
| 2000 | $691 | $543 |
| 2001 | $711 | $576 |
| 2002 | $738 | $587 |
| 2003 | $760 | $599 |
| 2004 | $781 | $612 |
| 2005 | $801 | $622 |
| 2006 | $833 | $642 |
| 2007 | $863 | $663 |
| 2008 | $886 | $691 |
| 2009 | $908 | $710 |
| 2010 | $917 | $717 |
| 2011 | $938 | $729 |
| 2012 | $943 | $742 |
| 2013 | $950 | $750 |
| 2014 | $970 | $763 |
| 2015 | $980 | $776 |
| 2016 | $1,004 | $802 |
| 2017 | $1,041 | $829 |
| 2018 | $1,051 | $860 |
| 2019 | $1,095 | $892 |
| 2020 | $1,144 | $958 |
| 2021 | $1,169 | $975 |
| 2022 | $1,216 | $1,029 |
| 2023 | $1,263 | $1,090 |
| 2024 | $1,337 | $1,138 |
Despite their declining share of the workforce, unionized workers continue to enjoy a significant wage advantage over their non-union peers. According to data from the U.S. Bureau of Labor Statistics, full-time union workers earned a median of $1,337 per week in 2024. By contrast, full-time non-union workers earned $1,138 per week—a difference of approximately 17.5%. On an annual basis, this translates to more than $10,000 in additional earnings for the typical unionized worker.
This wage premium reflects the collective bargaining power that unions bring to the negotiating table. Rather than relying on individual discussions with employers, unionized employees are represented in contract negotiations that often result in better pay, more robust benefits, and stronger job protections. For many workers, union representation remains a key factor in achieving greater financial stability and upward mobility.
Regional Differences in Union Membership
Pacific and Northeastern states have the highest unionization rates
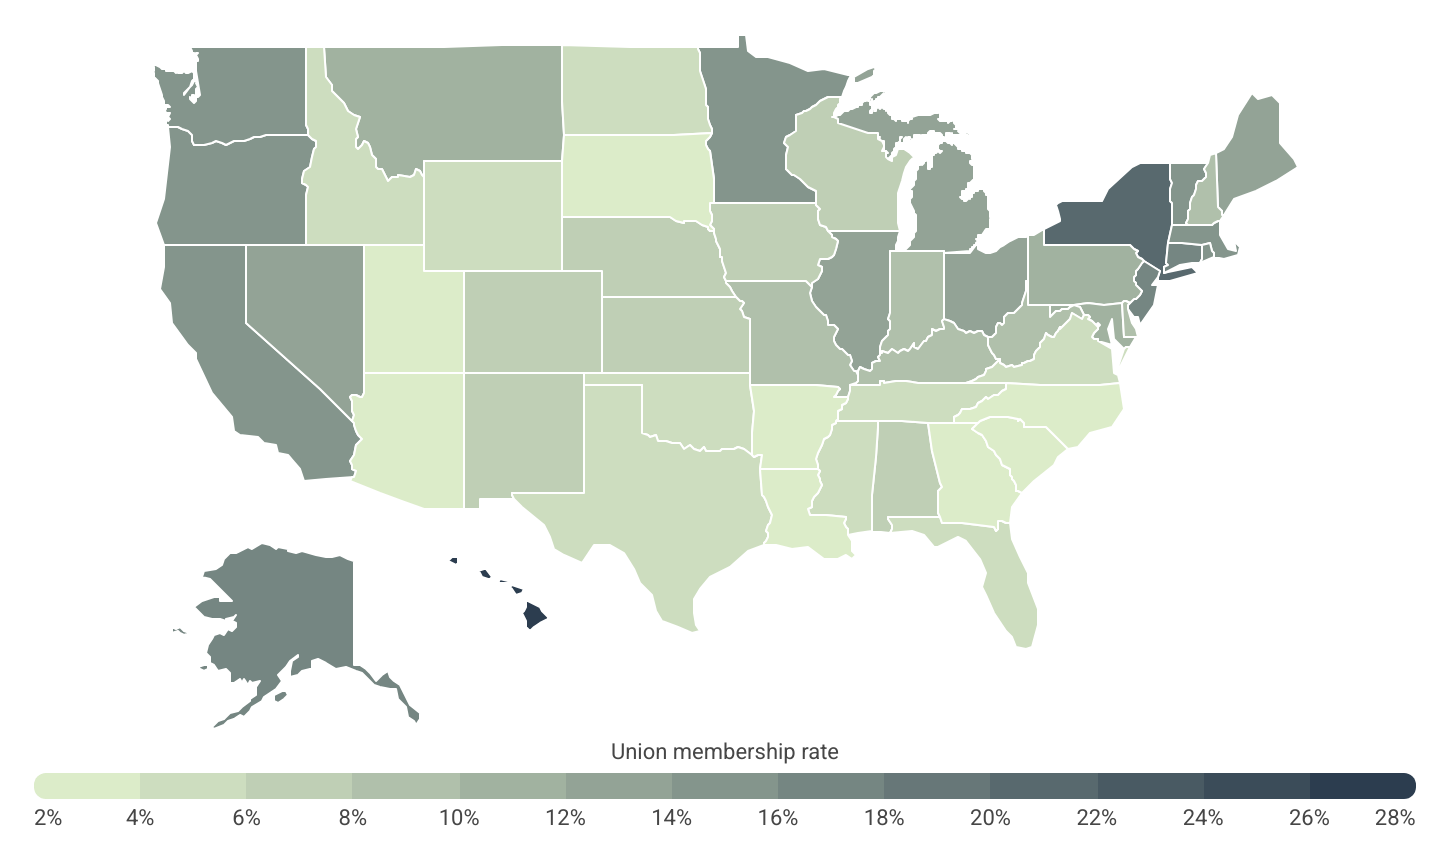
Data: Union Membership Rate by U.S. State
| State | Union membership rate |
|---|---|
| Hawaii | 26.6% |
| New York | 20.6% |
| Alaska | 17.6% |
| Connecticut | 16.5% |
| New Jersey | 16.2% |
| Oregon | 15.9% |
| Washington | 15.9% |
| Massachusetts | 14.6% |
| California | 14.5% |
| Rhode Island | 14.4% |
| Vermont | 14.3% |
| Minnesota | 14.1% |
| Michigan | 13.4% |
| Illinois | 13.1% |
| Maine | 13.1% |
| Nevada | 12.1% |
| Ohio | 12.1% |
| Montana | 11.9% |
| Pennsylvania | 11.7% |
| Maryland | 11.4% |
| New Hampshire | 9.2% |
| Indiana | 9.0% |
| Kentucky | 8.8% |
| West Virginia | 8.7% |
| Delaware | 8.6% |
| Missouri | 8.5% |
| Colorado | 7.7% |
| New Mexico | 7.5% |
| Nebraska | 6.8% |
| Alabama | 6.6% |
| Iowa | 6.4% |
| Kansas | 6.4% |
| Wisconsin | 6.4% |
| Wyoming | 5.6% |
| Oklahoma | 5.4% |
| Mississippi | 5.2% |
| Virginia | 5.2% |
| Florida | 5.1% |
| Idaho | 5.0% |
| North Dakota | 5.0% |
| Tennessee | 4.6% |
| Texas | 4.5% |
| Louisiana | 3.9% |
| Georgia | 3.8% |
| Arizona | 3.7% |
| Utah | 3.7% |
| Arkansas | 3.6% |
| South Carolina | 2.8% |
| South Dakota | 2.7% |
| North Carolina | 2.4% |
Are you an electrician in a union-heavy city?
In cities where union labor is strong, many licensed electricians also pursue independent work or launch their own businesses. Make sure you’re protected with the right coverage. Explore this guide to electrician insurance to learn more.
Union membership rates vary widely across the United States. States in the Pacific and Northeast regions consistently report the highest levels of unionization, while many Southern and Plains states have lower rates.
As of 2024, Hawaii led the nation with a union membership rate of 26.6%, followed by New York (20.6%) and Alaska (17.6%). Other high-ranking states included Connecticut (16.5%), New Jersey (16.2%), Oregon (15.9%), Washington (15.9%), and Massachusetts (14.6%). These states are characterized by more union-friendly labor laws, strong public-sector union representation, and in many cases, a historical legacy of organized labor in industries such as construction, education, and public administration.
In contrast, many of the states with the lowest unionization rates are concentrated in the South and parts of the Mountain West. North Carolina (2.4%), South Dakota (2.7%), and South Carolina (2.8%) had the lowest union membership rates in the country, followed by Arkansas (3.6%), Utah (3.7%), and Arizona (3.7%). These states are all governed by so-called “right-to-work” laws, which prohibit mandatory union membership or dues as a condition of employment. Currently, 28 states have enacted right-to-work legislation, including nearly all states in the South, as well as parts of the Midwest and West.
These laws tend to weaken unions’ financial stability and bargaining power, which labor advocates argue reduces their effectiveness and contributes to declining membership. Meanwhile, states without right-to-work laws tend to maintain stronger union representation and higher rates of membership.
Below is a complete breakdown of union membership rates across the top and bottom cities and states. The analysis was conducted by Construction Coverage using data from the U.S. Bureau of Labor Statistics and UnionStats. For more information, refer to the methodology section below.
Managing crews and timelines in union-dense regions?
In cities with strong labor representation and permitting oversight, project management software can help contractors stay on schedule, on budget, and in compliance. Compare the top construction project management tools.
Union Membership Rates by City
| Top Large Metros | Rate* |
|---|---|
| 1. New York-Newark-Jersey City, NY-NJ-PA | 20.2% |
| 2. Hartford-West Hartford-East Hartford, CT | 19.3% |
| 3. Riverside-San Bernardino-Ontario, CA | 17.8% |
| 4. Sacramento–Roseville–Arden-Arcade, CA | 17.3% |
| 5. Portland-Vancouver-Hillsboro, OR-WA | 16.5% |
| 6. Providence-Warwick, RI-MA | 15.7% |
| 7. San Francisco-Oakland-Hayward, CA | 15.4% |
| 8. Seattle-Tacoma-Bellevue, WA | 15.1% |
| 9. Rochester, NY | 14.9% |
| 10. Fresno, CA | 13.9% |
| 11. San Diego-Carlsbad, CA | 13.6% |
| 12. Detroit-Warren-Dearborn, MI | 13.3% |
| 13. Pittsburgh, PA | 13.3% |
| 14. Chicago-Naperville-Elgin, IL-IN-WI | 13.2% |
| 15. Buffalo-Cheektowaga-Niagara Falls, NY | 13.2% |
| Bottom Large Metros | Rate* |
|---|---|
| 1. Charlotte-Concord-Gastonia, NC-SC | 1.4% |
| 2. Nashville-Davidson–Murfreesboro–Franklin, TN | 3.2% |
| 3. Tampa-St. Petersburg-Clearwater, FL | 3.4% |
| 4. Tucson, AZ | 3.4% |
| 5. Dallas-Fort Worth-Arlington, TX | 3.6% |
| 6. Richmond, VA | 3.6% |
| 7. San Antonio-New Braunfels, TX | 4.0% |
| 8. Atlanta-Sandy Springs-Roswell, GA | 4.0% |
| 9. Phoenix-Mesa-Scottsdale, AZ | 4.0% |
| 10. Raleigh, NC | 4.0% |
| 11. Austin-Round Rock, TX | 4.1% |
| 12. Birmingham-Hoover, AL | 4.2% |
| 13. Virginia Beach-Norfolk-Newport News, VA-NC | 4.4% |
| 14. Tulsa, OK | 4.6% |
| 15. Miami-Fort Lauderdale-West Palm Beach, FL | 4.7% |
| Top Midsize Metros | Rate* |
|---|---|
| 1. Urban Honolulu, HI | 26.8% |
| 2. Albany-Schenectady-Troy, NY | 24.1% |
| 3. Stockton-Lodi, CA | 23.9% |
| 4. Flint, MI | 23.4% |
| 5. Atlantic City-Hammonton, NJ | 20.8% |
| 6. Lansing-East Lansing, MI | 20.1% |
| 7. Modesto, CA | 19.7% |
| 8. Springfield, MA | 19.6% |
| 9. Youngstown-Warren-Boardman, OH-PA | 18.0% |
| 10. Scranton–Wilkes-Barre–Hazleton, PA | 17.7% |
| 11. Worcester, MA-CT | 17.1% |
| 12. Syracuse, NY | 16.9% |
| 13. Ann Arbor, MI | 16.4% |
| 14. New Haven-Milford, CT | 16.2% |
| 15. Oxnard-Thousand Oaks-Ventura, CA | 16.1% |
| Bottom Midsize Metros | Rate* |
|---|---|
| 1. Spartanburg, SC | 0.0% |
| 2. Hickory-Lenoir-Morganton, NC | 1.1% |
| 3. Lubbock, TX | 1.1% |
| 4. Durham-Chapel Hill, NC | 1.2% |
| 5. Augusta-Richmond County, GA-SC | 1.4% |
| 6. Asheville, NC | 1.4% |
| 7. Columbia, SC | 1.6% |
| 8. Greenville-Anderson-Mauldin, SC | 1.6% |
| 9. Greensboro-High Point, NC | 1.7% |
| 10. Pensacola-Ferry Pass-Brent, FL | 1.7% |
| 11. Fayetteville, NC | 1.9% |
| 12. Ocala, FL | 2.1% |
| 13. Killeen-Temple, TX | 2.5% |
| 14. Little Rock-North Little Rock-Conway, AR | 2.6% |
| 15. Fayetteville-Springdale-Rogers, AR-MO | 2.7% |
| Top Small Metros | Rate* |
|---|---|
| 1. Kahului-Wailuku-Lahaina, HI | 29.4% |
| 2. Utica-Rome, NY | 23.6% |
| 3. Medford, OR | 23.5% |
| 4. Watertown-Fort Drum, NY | 23.4% |
| 5. Vineland-Bridgeton, NJ | 20.1% |
| 6. Santa Cruz-Watsonville, CA | 18.3% |
| 7. Mount Vernon-Anacortes, WA | 17.9% |
| 8. Barnstable Town, MA | 17.4% |
| 9. Norwich-New London, CT | 17.2% |
| 10. Muskegon, MI | 16.9% |
| 11. Lewiston-Auburn, ME | 16.7% |
| 12. Kennewick-Richland, WA | 16.1% |
| 13. Burlington-South Burlington, VT | 16.1% |
| 14. San Luis Obispo-Paso Robles-Arroyo Grande, CA | 15.4% |
| 15. Binghamton, NY | 14.8% |
| Bottom Small Metros | Rate* |
|---|---|
| 1. Oshkosh-Neenah, WI | 0.0% |
| 2. Columbus, GA-AL | 0.0% |
| 3. Goldsboro, NC | 0.0% |
| 4. Warner Robins, GA | 0.0% |
| 5. St. George, UT | 0.0% |
| 6. Burlington, NC | 0.9% |
| 7. Longview, TX | 1.0% |
| 8. Sherman-Denison, TX | 1.0% |
| 9. Monroe, LA | 1.0% |
| 10. Gainesville, GA | 1.8% |
| 11. Farmington, NM | 1.8% |
| 12. Roanoke, VA | 1.9% |
| 13. Athens-Clarke County, GA | 2.0% |
| 14. Hilton Head Island-Bluffton-Beaufort, SC | 2.0% |
| 15. Bloomington, IN | 2.1% |
Union Membership Rates by State
| Top States | Rate* |
|---|---|
| 1. Hawaii | 26.6% |
| 2. New York | 20.6% |
| 3. Alaska | 17.6% |
| 4. Connecticut | 16.5% |
| 5. New Jersey | 16.2% |
| 6. Washington | 15.9% |
| 7. Oregon | 15.9% |
| 8. Massachusetts | 14.6% |
| 9. California | 14.5% |
| 10. Rhode Island | 14.4% |
| 11. Vermont | 14.3% |
| 12. Minnesota | 14.1% |
| 13. Michigan | 13.4% |
| 14. Illinois | 13.1% |
| 15. Maine | 13.1% |
| Bottom States | Rate* |
|---|---|
| 1. North Carolina | 2.4% |
| 2. South Dakota | 2.7% |
| 3. South Carolina | 2.8% |
| 4. Arkansas | 3.6% |
| 5. Utah | 3.7% |
| 6. Arizona | 3.7% |
| 7. Georgia | 3.8% |
| 8. Louisiana | 3.9% |
| 9. Texas | 4.5% |
| 10. Tennessee | 4.6% |
| 11. North Dakota | 5.0% |
| 12. Idaho | 5.0% |
| 13. Florida | 5.1% |
| 14. Virginia | 5.2% |
| 15. Mississippi | 5.2% |
*Union membership rate
Full Results
Methodology
To determine the most unionized locations in the U.S., researchers at Construction Coverage analyzed data from UnionStats.com and the U.S. Bureau of Labor Statistics. The researchers ranked states and metropolitan statistical areas according to total union members as a percentage of total employment. In addition to union membership, the researchers also included statistics on union representation, which is the share of workers whose terms of work are collectively negotiated (whether or not they are union members).
Only metropolitan statistical areas with available data were included in the analysis. Additionally, metro areas were grouped into the following cohorts based on population size:
- Small metros: less than 350,000
- Midsize metros: 350,000-999,999
- Large metros: 1,000,000 or more
References
- Nagele-Piazza, J.D., L. (SHRM) (June 27, 2018). Supreme Court Bans Mandatory Union Fees for Public-Sector Workers. Society for Human Resource Management. https://www.shrm.org/topics-tools/employment-law-compliance/supreme-court-bans-mandatory-union-fees-public-sector-workers.
- Gallup (2025). Labor Unions. https://news.gallup.com/poll/12751/labor-unions.aspx.
- Starbucks Workers United (2025). Our Story. https://sbworkersunited.org/our-story/.
- U.S. Bureau of Labor Statistics (February 20, 2025). Work Stoppages, Work Stoppages Involving 1,000 or More Workers, 1993-Present. https://www.bls.gov/web/wkstp/monthly-listing.htm.
- The White House (March 27, 2025). Exclusions From Federal Labor-Management Relations Programs. https://www.whitehouse.gov/presidential-actions/2025/03/exclusions-from-federal-labor-management-relations-programs/.
- American Federation of Labor and Congress of Industrial Organizations (April 4, 2025). AFL-CIO Stands in Solidarity with Unions Challenging Trump Administration’s Attack on Labor in Court. https://aflcio.org/press/releases/afl-cio-stands-solidarity-unions-challenging-trump-administrations-attack-labor.
- U.S. Bureau of Labor Statistics (January 28, 2025). Economic News Release, Table 2. Median weekly earnings of full-time wage and salary workers by union affiliation and selected characteristics. https://www.bls.gov/news.release/union2.t02.htm.
- Farrell, K. (July 2023). Union Membership, Activity, and Compensation in 2022. U.S. Bureau of Labor Statistics. https://www.bls.gov/spotlight/2023/union-membership-activity-and-compensation-in-2022/.
- National Right to Work Legal Defense Foundation (2024). Right to Work States. https://www.nrtw.org/right-to-work-states/.
- UnionStats.com (February 28, 2025). Union Membership, Coverage, and Earnings from the CPS. https://unionstats.com/.
- U.S. Bureau of Labor Statistics (2025). https://www.bls.gov/.