U.S. Cities Building the Most Homes
Note: This is the most recent release of our U.S. Cities Building the Most Homes study. To see data from prior years, please visit the Full Results section below.
Rising real estate values and increasing rents have stretched budgets for homebuyers and renters since the onset of the COVID-19 pandemic. The median home sales price in the U.S. jumped by over $150,000 from the first quarter of 2020 to the fourth quarter of 2022 amid low interest rates and a stronger-than-expected pandemic economy. Rent prices, on the other hand, remained suppressed for much of 2020 with COVID-related renter protections and rental assistance programs in place, but accelerated in 2021 and into 2022.
Since the beginning of 2022, the U.S. Federal Reserve has raised interest rates in an effort to combat inflation throughout the economy. Between rising mortgage rates and the rapid run-up in home values, the residential real estate market has cooled down. As of Q2 2023, the median home sale price declined 13.2%—down from just over $479,000 in Q4 2022. But while a leveling-out in demand may have helped to slow down price growth, these measures cannot solve another fundamental challenge in the U.S. housing market: a major shortage of housing supply.
Available single-family homes for sale sit at 1.3 million units, a mere 8.1% above the all-time low in February 2022. And with millennials now comprising the largest generational segment of the homebuying market, a lack of affordable entry-level homes has driven competition for housing and kept larger numbers of young adults renting, contributing to the elevated home and rent prices alike.
RELATED TO RESIDENTIAL REAL ESTATE
Are you a landlord or property manager? Be sure to review our updated guides on the best property management software and the best landlord insurance companies.
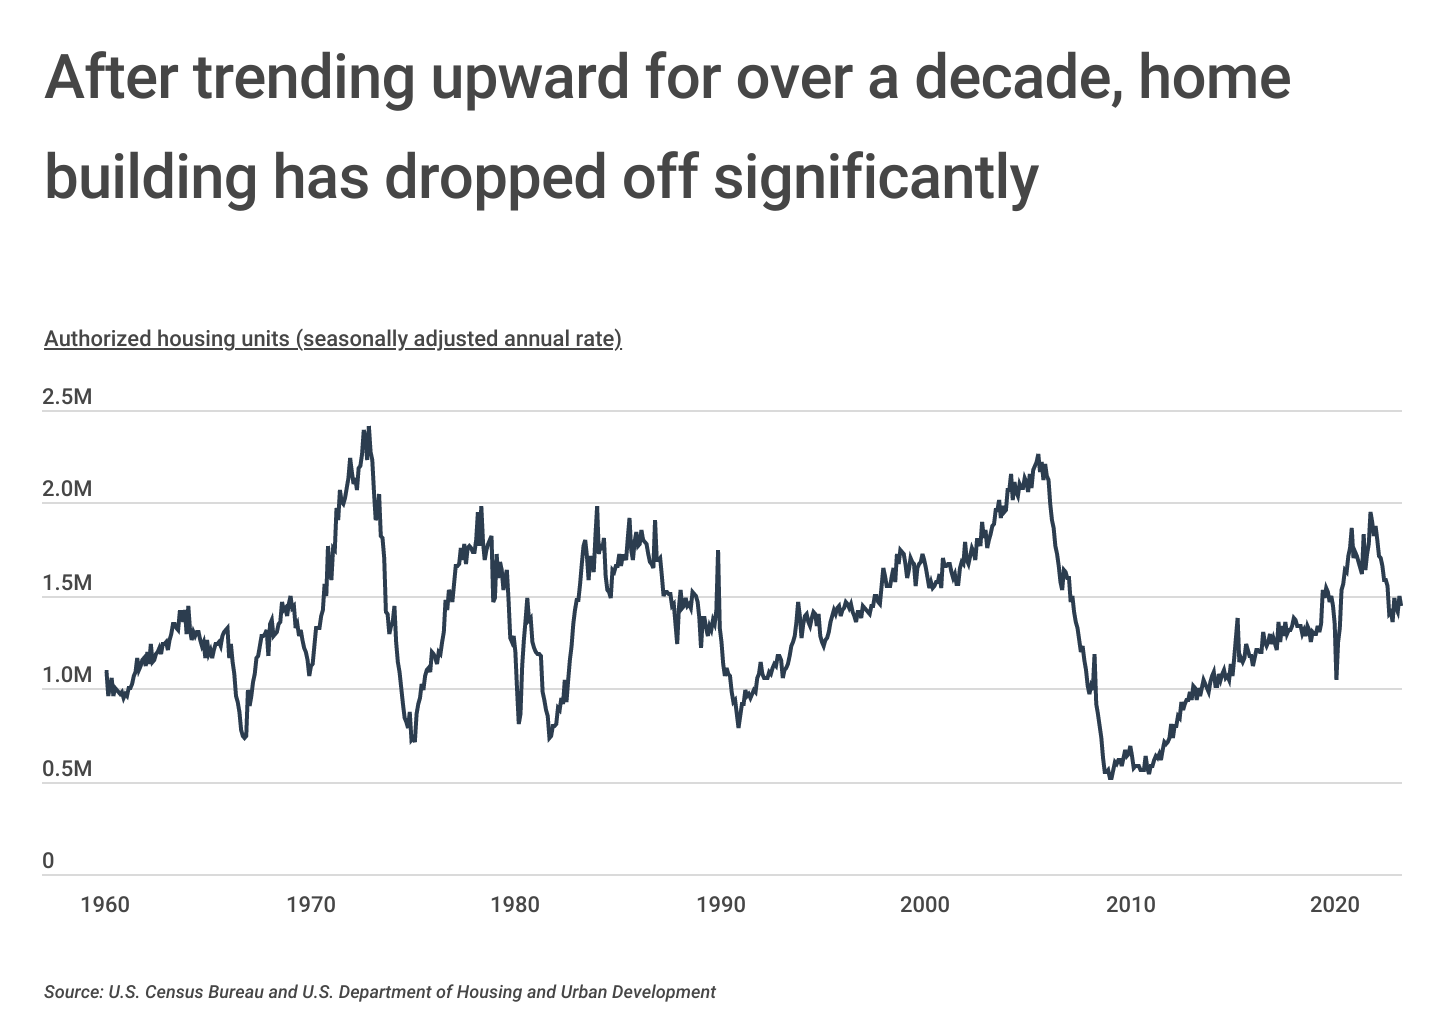
The lack of housing supply has been exacerbated by significant underinvestment in new housing since the Great Recession. New housing authorizations tend to fall temporarily during economic downturns, but the collapse of the housing market in the mid-2000s and ensuing recession sent authorizations to historic lows. The number of new residential units authorized has recovered slowly over the last decade, but as of June 2023, new authorizations declined 26% after peaking in December 2021. According to the National Association of Home Builders, persistently high inflation pushing up construction costs combined with elevated mortgage interest rates produced 12 straight monthly declines in builder confidence during 2022.
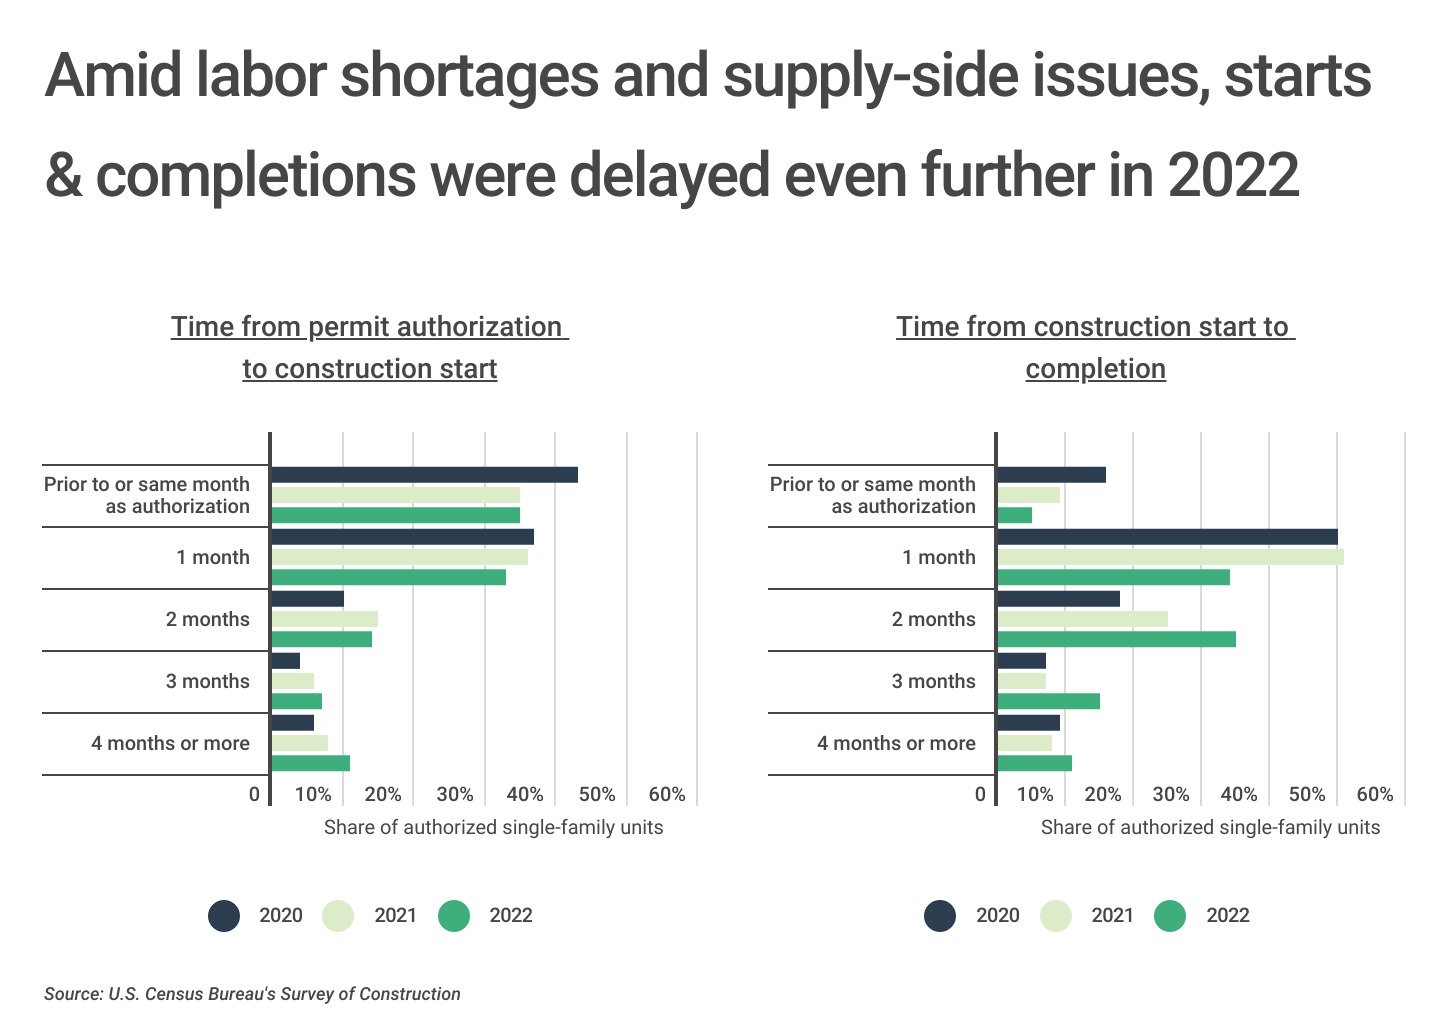
Despite a clear need for new housing supply, the construction industry struggled to keep up during the pandemic. COVID-related disruptions produced worker shortages and hindered supply chains, making it harder and more expensive to obtain building materials. As a result, more single-family units saw monthslong delays in the time it takes to start and complete construction when compared to years past.
The effects of these disruptions continue to linger in the residential housing industry. The share of authorized single-family units that took two months or longer to start construction after initial authorization increased from 29% in 2021 to 32% in 2022. These delays were even more prevalent when considering the time from construction start to completion, where 61% of authorizations took over two months to complete this phase compared to only 40% in 2021.
LEARN MORE
Two must-have products for large contractors are construction accounting software and construction project management software, both of which will increase productivity and help you grow your business.
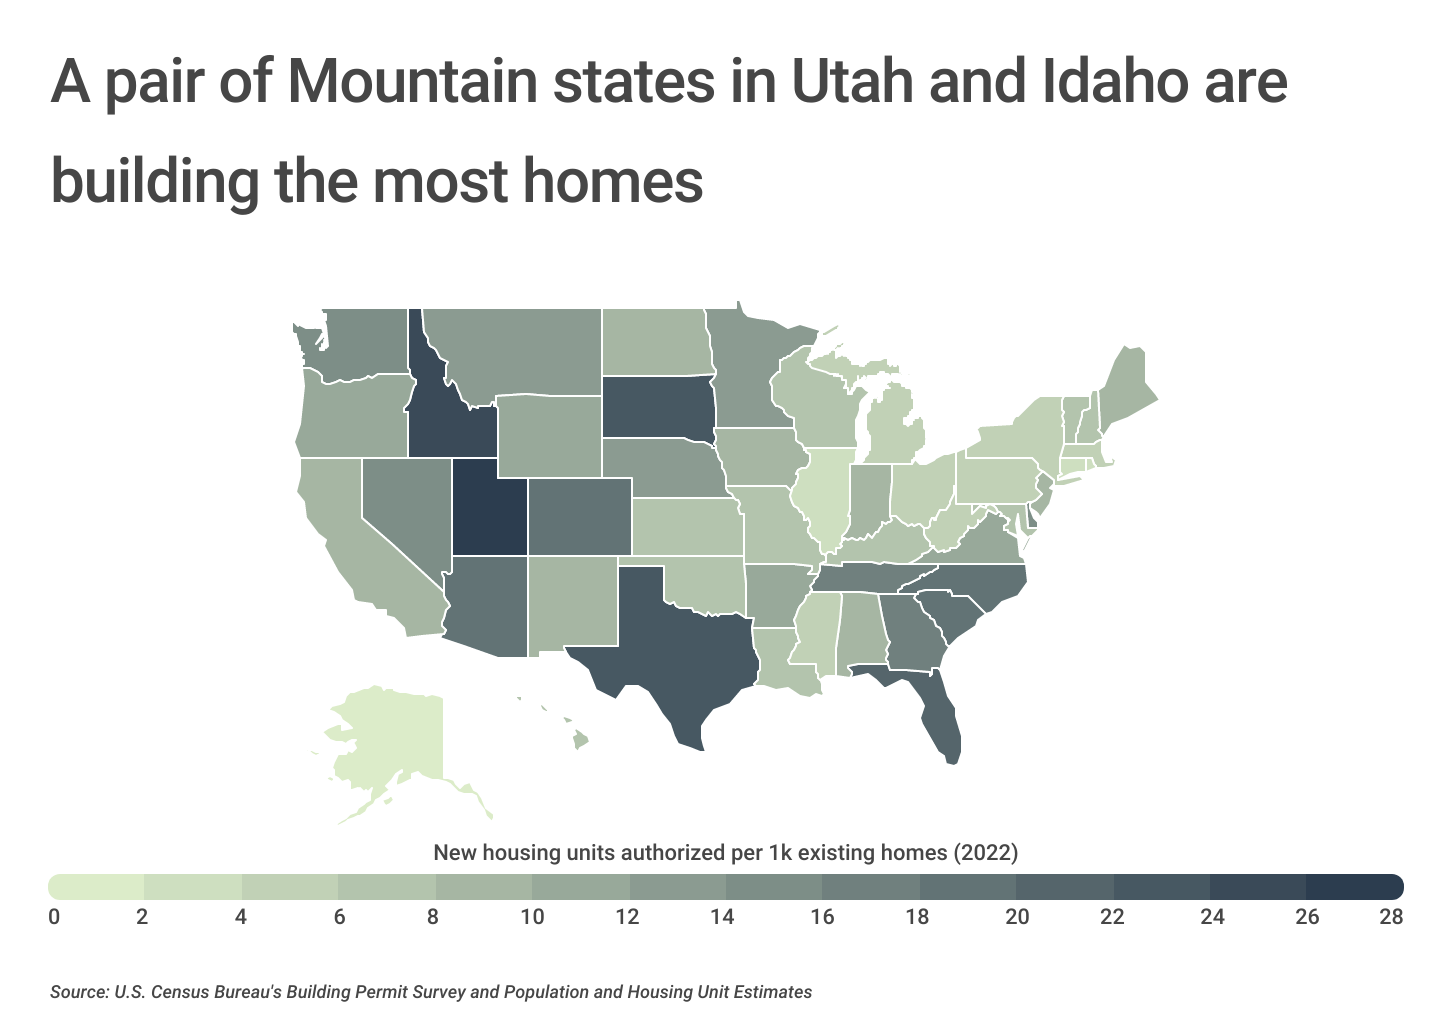
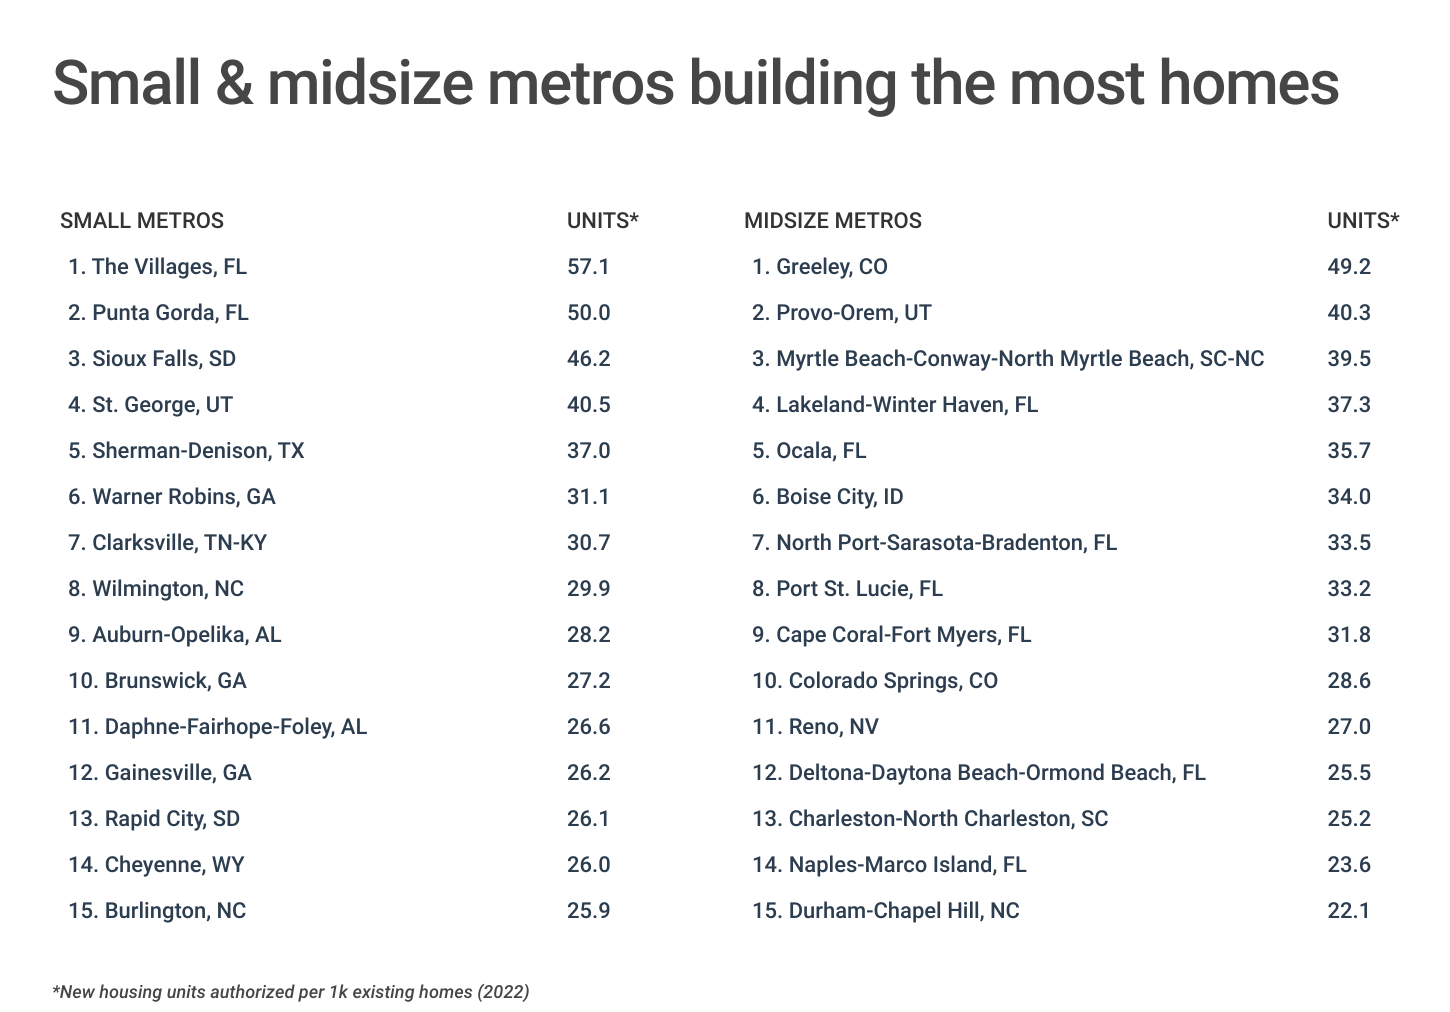
Although supply is a challenge across the U.S., some locations are moving faster than others in authorizing new construction. Fast-growing states in the Mountain West, like Utah, Idaho, and Colorado, along with Sun Belt destinations like Texas and Florida, lead the U.S. in the rate of new housing development. At the local level, major metros in these fast-growing states are also among those leading in new home construction.
To determine the metros building the most homes, researchers at Construction Coverage analyzed the latest data from the U.S. Census Bureau and Zillow. The researchers ranked metro areas according to the number of new housing units authorized per 1,000 existing homes in 2022. In the event of a tie, the metro with higher total new housing units authorized in 2022 was ranked higher.
Here are the U.S. metropolitan areas building the most homes.
Large Metros Building the Most Homes
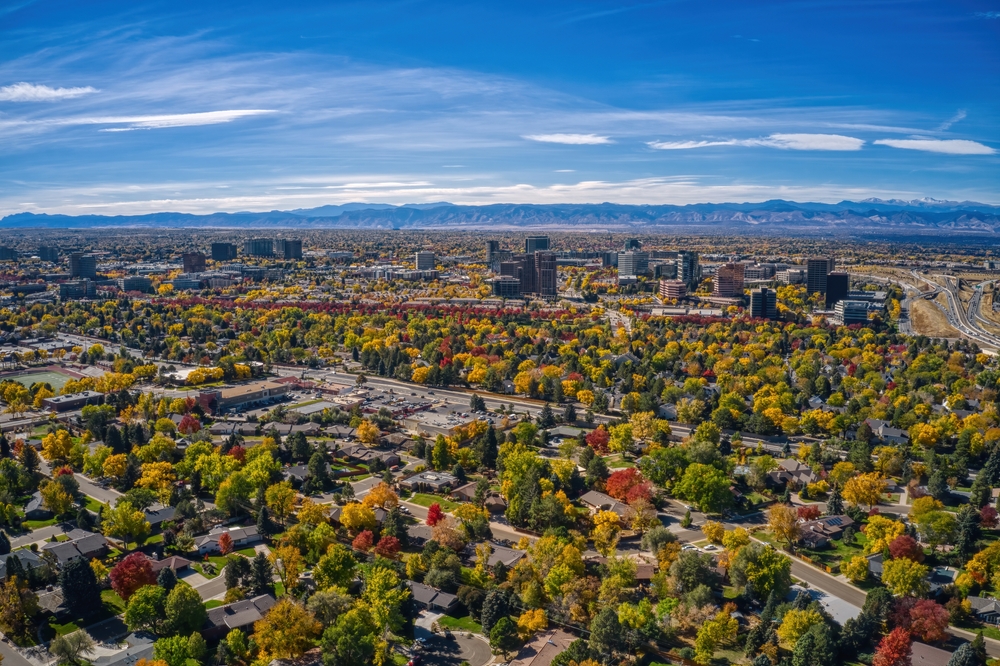
Photo Credit: Jacob Boomsma / Shutterstock
15. Denver-Aurora-Lakewood, CO
- New housing units authorized per 1k existing homes (2022): 18.5
- New housing units authorized per 1k existing homes (2020): 16.2
- Total new housing units authorized (2022): 23,476
- Total new housing units authorized (2020): 19,732
- Percentage change in housing units authorized (2020-2022): +19.0%
- Median home price: $584,714
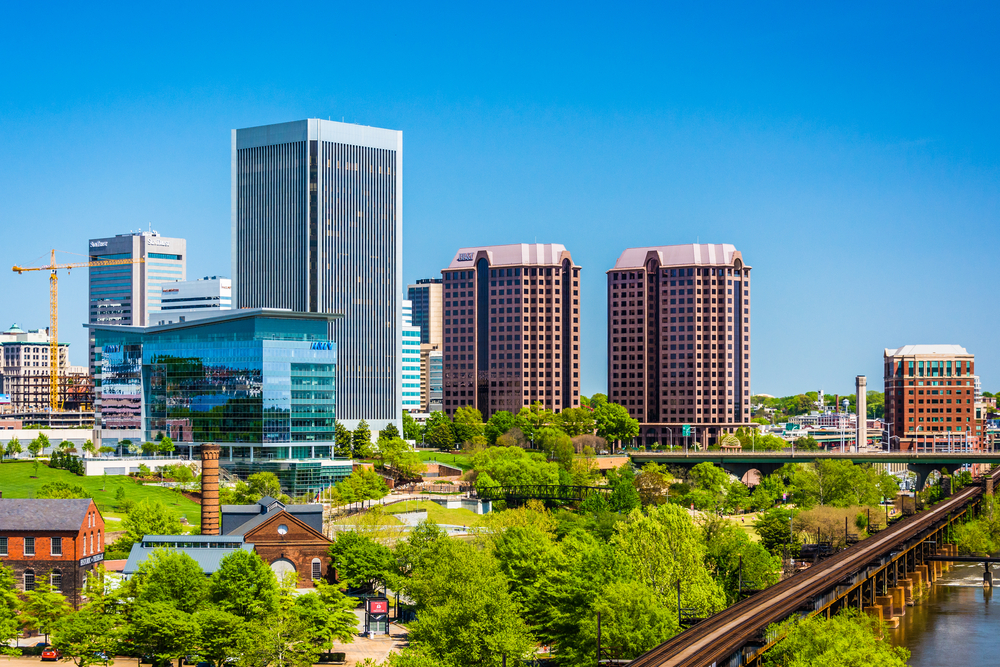
Photo Credit: ESB Professional / Shutterstock
14. Richmond, VA
- New housing units authorized per 1k existing homes (2022): 18.6
- New housing units authorized per 1k existing homes (2020): 15.4
- Total new housing units authorized (2022): 10,414
- Total new housing units authorized (2020): 8,190
- Percentage change in housing units authorized (2020-2022): +27.2%
- Median home price: $352,581
TRENDING
Many builders are underinsured. To protect your project, make sure to have builders risk insurance; to protect your employees, find the best workers comp insurance; to protect your vehicles, find the best business auto insurance.

Photo Credit: f11photo / Shutterstock
13. Atlanta-Sandy Springs-Alpharetta, GA
- New housing units authorized per 1k existing homes (2022): 19.6
- New housing units authorized per 1k existing homes (2020): 13.7
- Total new housing units authorized (2022): 48,107
- Total new housing units authorized (2020): 32,346
- Percentage change in housing units authorized (2020-2022): +48.7%
- Median home price: $374,047

Photo Credit: Henryk Sadura / Shutterstock
12. Tampa-St. Petersburg-Clearwater, FL
- New housing units authorized per 1k existing homes (2022): 20.1
- New housing units authorized per 1k existing homes (2020): 14.0
- Total new housing units authorized (2022): 29,969
- Total new housing units authorized (2020): 20,348
- Percentage change in housing units authorized (2020-2022): +47.3%
- Median home price: $375,313

Photo Credit: Andrew Zarivny / Shutterstock
11. Salt Lake City, UT
- New housing units authorized per 1k existing homes (2022): 21.7
- New housing units authorized per 1k existing homes (2020): 25.4
- Total new housing units authorized (2022): 10,102
- Total new housing units authorized (2020): 11,033
- Percentage change in housing units authorized (2020-2022): -8.4%
- Median home price: $533,606

Photo Credit: Gregory E. Clifford / Shutterstock
10. Phoenix-Mesa-Chandler, AZ
- New housing units authorized per 1k existing homes (2022): 23.3
- New housing units authorized per 1k existing homes (2020): 24.5
- Total new housing units authorized (2022): 47,267
- Total new housing units authorized (2020): 48,219
- Percentage change in housing units authorized (2020-2022): -2.0%
- Median home price: $446,110

Photo Credit: Sean Pavone / Shutterstock
9. San Antonio-New Braunfels, TX
- New housing units authorized per 1k existing homes (2022): 23.5
- New housing units authorized per 1k existing homes (2020): 18.3
- Total new housing units authorized (2022): 24,339
- Total new housing units authorized (2020): 16,697
- Percentage change in housing units authorized (2020-2022): +45.8%
- Median home price: $294,967

Photo Credit: Jon Bilous / Shutterstock
8. Charlotte-Concord-Gastonia, NC-SC
- New housing units authorized per 1k existing homes (2022): 23.9
- New housing units authorized per 1k existing homes (2020): 24.5
- Total new housing units authorized (2022): 27,212
- Total new housing units authorized (2020): 26,548
- Percentage change in housing units authorized (2020-2022): +2.5%
- Median home price: $369,590
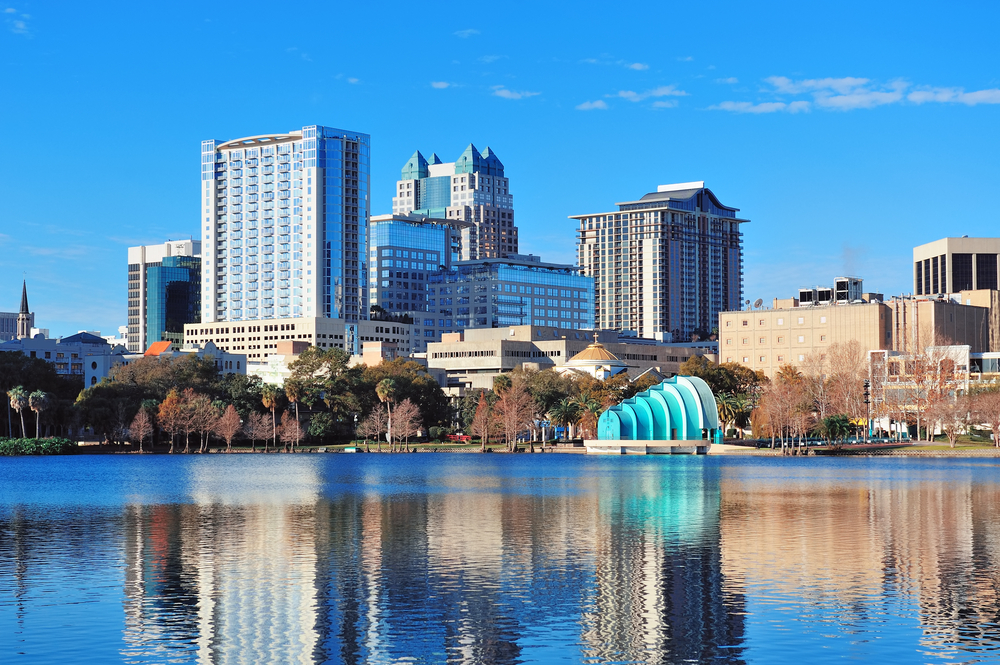
Photo Credit: Songquan Deng / Shutterstock
7. Orlando-Kissimmee-Sanford, FL
- New housing units authorized per 1k existing homes (2022): 25.7
- New housing units authorized per 1k existing homes (2020): 22.7
- Total new housing units authorized (2022): 28,683
- Total new housing units authorized (2020): 24,499
- Percentage change in housing units authorized (2020-2022): +17.1%
- Median home price: $388,191

Photo Credit: Francisco Sandoval Guate / Shutterstock
6. Dallas-Fort Worth-Arlington, TX
- New housing units authorized per 1k existing homes (2022): 25.8
- New housing units authorized per 1k existing homes (2020): 21.1
- Total new housing units authorized (2022): 77,894
- Total new housing units authorized (2020): 60,812
- Percentage change in housing units authorized (2020-2022): +28.1%
- Median home price: $376,026

Photo Credit: travelview / Shutterstock
5. Houston-The Woodlands-Sugar Land, TX
- New housing units authorized per 1k existing homes (2022): 26.8
- New housing units authorized per 1k existing homes (2020): 26.2
- Total new housing units authorized (2022): 75,728
- Total new housing units authorized (2020): 70,540
- Percentage change in housing units authorized (2020-2022): +7.4%
- Median home price: $306,423
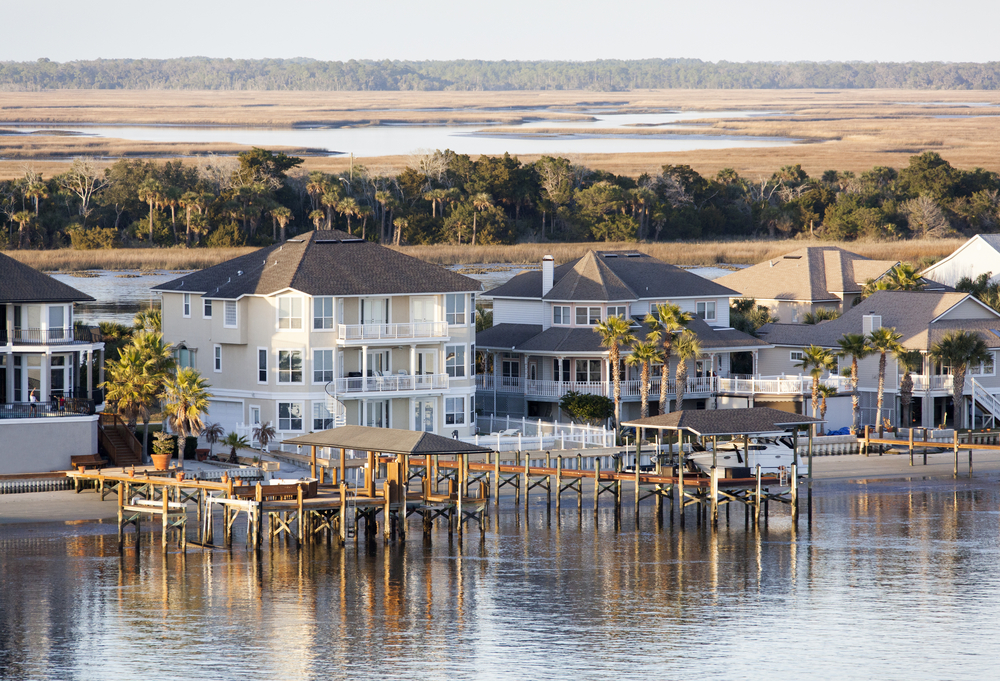
Photo Credit: Ramunas Bruzas / Shutterstock
4. Jacksonville, FL
- New housing units authorized per 1k existing homes (2022): 32.6
- New housing units authorized per 1k existing homes (2020): 25.8
- Total new housing units authorized (2022): 23,169
- Total new housing units authorized (2020): 17,246
- Percentage change in housing units authorized (2020-2022): +34.3%
- Median home price: $355,024

Photo Credit: Steve Heap / Shutterstock
3. Nashville-Davidson–Murfreesboro–Franklin, TN
- New housing units authorized per 1k existing homes (2022): 32.8
- New housing units authorized per 1k existing homes (2020): 33.7
- Total new housing units authorized (2022): 28,192
- Total new housing units authorized (2020): 27,158
- Percentage change in housing units authorized (2020-2022): +3.8%
- Median home price: $436,866

Photo Credit: Farid Sani / Shutterstock
2. Raleigh-Cary, NC
- New housing units authorized per 1k existing homes (2022): 36.2
- New housing units authorized per 1k existing homes (2020): 30.1
- Total new housing units authorized (2022): 21,568
- Total new housing units authorized (2020): 16,958
- Percentage change in housing units authorized (2020-2022): +27.2%
- Median home price: $433,469

Photo Credit: Roschetzky Photography / Shutterstock
1. Austin-Round Rock-Georgetown, TX
- New housing units authorized per 1k existing homes (2022): 42.5
- New housing units authorized per 1k existing homes (2020): 47.9
- Total new housing units authorized (2022): 42,364
- Total new housing units authorized (2020): 42,264
- Percentage change in housing units authorized (2020-2022): +0.2%
- Median home price: $487,537
Detailed Findings & Methodology
To determine the metros building the most homes, researchers at Construction Coverage analyzed the latest data from the U.S. Census Bureau’s Building Permit Survey and Zillow’s Zillow Home Value Index (ZHVI). The researchers ranked metro areas according to the number of new housing units authorized per 1,000 existing homes in 2022. In the event of a tie, the metro with higher total new housing units authorized in 2022 was ranked higher. Researchers also calculated the number of new housing units authorized per 1,000 existing homes in 2020, the total new housing units authorized in 2020, the percentage change in housing units authorized from 2020 to 2022, and the current median home price.
Only metropolitan areas with available data and with at least 100,000 people were included in the analysis. Additionally, metro areas were grouped into the following cohorts based on population size:
- Small metros: 100,000-349,999
- Midsize metros: 350,000-999,999
- Large metros: 1,000,000 or more
Full Results
Each company featured in our guides has been independently selected and reviewed by our research team. If you select one of these companies and click on a link, we may earn a commission.
By clicking on these links, you may be taken to one of our insurance partners. The specific company listed here may or may not be included in our partner’s network at this time.
