
U.S. States Investing Most in Manufactured Housing
Note: This is the most recent release of our U.S. States Investing Most in Manufactured Housing study. To see data from previous years, please visit the Full Results section below.
After years of elevated real estate prices, mortgage rates, and rents, the housing affordability crisis in the U.S. is more apparent than ever. Policymakers, economic experts, and everyday households continue to search for solutions to ease the financial burden of securing housing. One option gaining renewed attention is manufactured housing.
Manufactured housing includes homes that are prefabricated in a factory and then transported to their final locations. Due to their simplified designs and more cost-effective materials, manufactured homes are often significantly less expensive to produce than site-built homes. According to a recent report from the Manufactured Housing Institute, the average cost per square foot of a manufactured home is $87—nearly half the $166 per square foot cost of a traditional site-built home.
This affordability makes manufactured housing an increasingly attractive option for lower- and middle-income families. Today, more than 22 million Americans live in manufactured homes, which account for about one in every 10 new homes built nationwide each year. In addition to their lower cost, manufactured homes have improved in quality over time, offering better materials, energy efficiency, and more appealing designs.
To better understand the role of manufactured housing in addressing the U.S. housing crisis, researchers at Construction Coverage analyzed the latest Census Bureau data. The study examines how the popularity of manufactured housing has changed over time, how its costs compare to traditional single-family homes, and which states are investing most heavily in this type of housing.
Key Findings
- Manufactured home production is rebounding: After falling sharply in 2023, shipments of manufactured homes increased to 103,300 units in 2024. As of mid-2025, the annual shipment rate had climbed to 106,000—indicating a faster recovery than the broader site-built housing market.
- Manufactured homes remain significantly more affordable: In 2024, the average manufactured home sold for $123,300, while the median single-family home value reached $367,282. Despite rising prices in both segments, manufactured homes remain about 66% less expensive—though the comparison excludes land value.
- The South leads in manufactured housing investment: Southern states like Texas, Florida, and North Carolina had the highest total shipments in 2024, while states like Mississippi, Kentucky, and Louisiana had the highest share of manufactured homes among new single-family housing—often reflecting lower income levels and affordability needs.
- Policy shifts may be supporting growth: The recent uptick in manufactured home shipments may be driven by easing inflation, continued consumer demand for affordable housing, and state and local policy changes that have eased zoning restrictions and encouraged factory-built housing development.
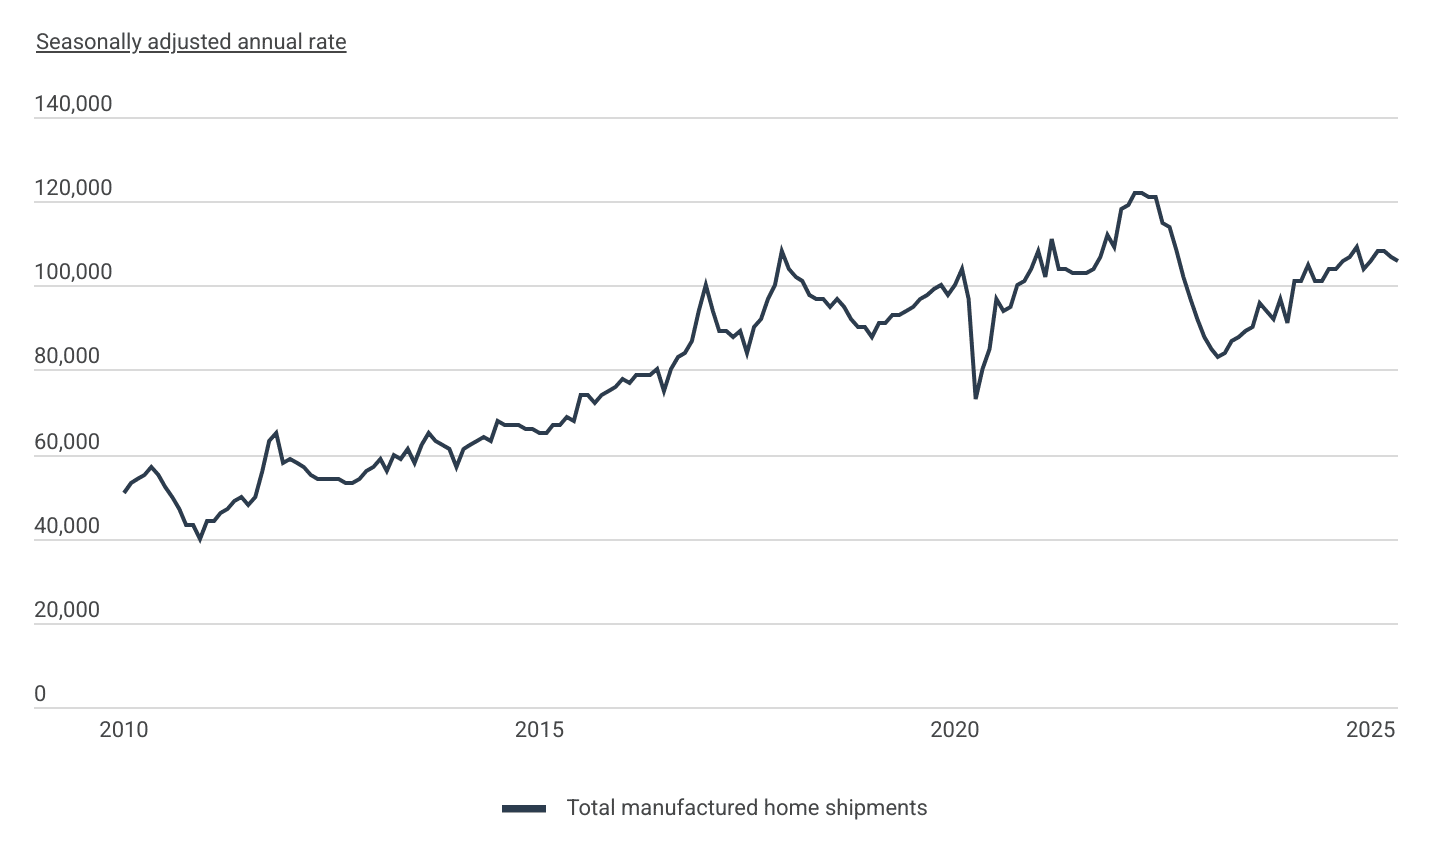
How Many Manufactured Homes Are Built in the U.S. Each Year?
Factories shipped 103,300 new manufactured homes in 2024, up from 89,169 the year prior
Data: Total Manufactured Home Shipments Over Time
| Date | Total manufactured home shipments |
|---|---|
| 1/1/2010 | 51,000 |
| 2/1/2010 | 53,000 |
| 3/1/2010 | 54,000 |
| 4/1/2010 | 55,000 |
| 5/1/2010 | 57,000 |
| 6/1/2010 | 55,000 |
| 7/1/2010 | 52,000 |
| 8/1/2010 | 50,000 |
| 9/1/2010 | 47,000 |
| 10/1/2010 | 43,000 |
| 11/1/2010 | 43,000 |
| 12/1/2010 | 40,000 |
| 1/1/2011 | 44,000 |
| 2/1/2011 | 44,000 |
| 3/1/2011 | 46,000 |
| 4/1/2011 | 47,000 |
| 5/1/2011 | 49,000 |
| 6/1/2011 | 50,000 |
| 7/1/2011 | 48,000 |
| 8/1/2011 | 50,000 |
| 9/1/2011 | 56,000 |
| 10/1/2011 | 63,000 |
| 11/1/2011 | 65,000 |
| 12/1/2011 | 58,000 |
| 1/1/2012 | 59,000 |
| 2/1/2012 | 58,000 |
| 3/1/2012 | 57,000 |
| 4/1/2012 | 55,000 |
| 5/1/2012 | 54,000 |
| 6/1/2012 | 54,000 |
| 7/1/2012 | 54,000 |
| 8/1/2012 | 54,000 |
| 9/1/2012 | 53,000 |
| 10/1/2012 | 53,000 |
| 11/1/2012 | 54,000 |
| 12/1/2012 | 56,000 |
| 1/1/2013 | 57,000 |
| 2/1/2013 | 59,000 |
| 3/1/2013 | 56,000 |
| 4/1/2013 | 60,000 |
| 5/1/2013 | 59,000 |
| 6/1/2013 | 61,000 |
| 7/1/2013 | 58,000 |
| 8/1/2013 | 62,000 |
| 9/1/2013 | 65,000 |
| 10/1/2013 | 63,000 |
| 11/1/2013 | 62,000 |
| 12/1/2013 | 61,000 |
| 1/1/2014 | 57,000 |
| 2/1/2014 | 61,000 |
| 3/1/2014 | 62,000 |
| 4/1/2014 | 63,000 |
| 5/1/2014 | 64,000 |
| 6/1/2014 | 63,000 |
| 7/1/2014 | 68,000 |
| 8/1/2014 | 67,000 |
| 9/1/2014 | 67,000 |
| 10/1/2014 | 67,000 |
| 11/1/2014 | 66,000 |
| 12/1/2014 | 66,000 |
| 1/1/2015 | 65,000 |
| 2/1/2015 | 65,000 |
| 3/1/2015 | 67,000 |
| 4/1/2015 | 67,000 |
| 5/1/2015 | 69,000 |
| 6/1/2015 | 68,000 |
| 7/1/2015 | 74,000 |
| 8/1/2015 | 74,000 |
| 9/1/2015 | 72,000 |
| 10/1/2015 | 74,000 |
| 11/1/2015 | 75,000 |
| 12/1/2015 | 76,000 |
| 1/1/2016 | 78,000 |
| 2/1/2016 | 77,000 |
| 3/1/2016 | 79,000 |
| 4/1/2016 | 79,000 |
| 5/1/2016 | 79,000 |
| 6/1/2016 | 80,000 |
| 7/1/2016 | 75,000 |
| 8/1/2016 | 80,000 |
| 9/1/2016 | 83,000 |
| 10/1/2016 | 84,000 |
| 11/1/2016 | 87,000 |
| 12/1/2016 | 94,000 |
| 1/1/2017 | 100,000 |
| 2/1/2017 | 94,000 |
| 3/1/2017 | 89,000 |
| 4/1/2017 | 89,000 |
| 5/1/2017 | 88,000 |
| 6/1/2017 | 89,000 |
| 7/1/2017 | 84,000 |
| 8/1/2017 | 90,000 |
| 9/1/2017 | 92,000 |
| 10/1/2017 | 97,000 |
| 11/1/2017 | 100,000 |
| 12/1/2017 | 108,000 |
| 1/1/2018 | 104,000 |
| 2/1/2018 | 102,000 |
| 3/1/2018 | 101,000 |
| 4/1/2018 | 98,000 |
| 5/1/2018 | 97,000 |
| 6/1/2018 | 97,000 |
| 7/1/2018 | 95,000 |
| 8/1/2018 | 97,000 |
| 9/1/2018 | 95,000 |
| 10/1/2018 | 92,000 |
| 11/1/2018 | 90,000 |
| 12/1/2018 | 90,000 |
| 1/1/2019 | 88,000 |
| 2/1/2019 | 91,000 |
| 3/1/2019 | 91,000 |
| 4/1/2019 | 93,000 |
| 5/1/2019 | 93,000 |
| 6/1/2019 | 94,000 |
| 7/1/2019 | 95,000 |
| 8/1/2019 | 97,000 |
| 9/1/2019 | 98,000 |
| 10/1/2019 | 99,000 |
| 11/1/2019 | 100,000 |
| 12/1/2019 | 98,000 |
| 1/1/2020 | 100,000 |
| 2/1/2020 | 104,000 |
| 3/1/2020 | 97,000 |
| 4/1/2020 | 73,000 |
| 5/1/2020 | 80,000 |
| 6/1/2020 | 85,000 |
| 7/1/2020 | 97,000 |
| 8/1/2020 | 94,000 |
| 9/1/2020 | 95,000 |
| 10/1/2020 | 100,000 |
| 11/1/2020 | 101,000 |
| 12/1/2020 | 104,000 |
| 1/1/2021 | 108,000 |
| 2/1/2021 | 102,000 |
| 3/1/2021 | 111,000 |
| 4/1/2021 | 104,000 |
| 5/1/2021 | 104,000 |
| 6/1/2021 | 103,000 |
| 7/1/2021 | 103,000 |
| 8/1/2021 | 103,000 |
| 9/1/2021 | 104,000 |
| 10/1/2021 | 107,000 |
| 11/1/2021 | 112,000 |
| 12/1/2021 | 109,000 |
| 1/1/2022 | 118,000 |
| 2/1/2022 | 119,000 |
| 3/1/2022 | 122,000 |
| 4/1/2022 | 122,000 |
| 5/1/2022 | 121,000 |
| 6/1/2022 | 121,000 |
| 7/1/2022 | 115,000 |
| 8/1/2022 | 114,000 |
| 9/1/2022 | 108,000 |
| 10/1/2022 | 102,000 |
| 11/1/2022 | 97,000 |
| 12/1/2022 | 92,000 |
| 1/1/2023 | 88,000 |
| 2/1/2023 | 85,000 |
| 3/1/2023 | 83,000 |
| 4/1/2023 | 84,000 |
| 5/1/2023 | 87,000 |
| 6/1/2023 | 88,000 |
| 7/1/2023 | 89,000 |
| 8/1/2023 | 90,000 |
| 9/1/2023 | 96,000 |
| 10/1/2023 | 94,000 |
| 11/1/2023 | 92,000 |
| 12/1/2023 | 97,000 |
| 1/1/2024 | 91,000 |
| 2/1/2024 | 101,000 |
| 3/1/2024 | 101,000 |
| 4/1/2024 | 105,000 |
| 5/1/2024 | 101,000 |
| 6/1/2024 | 101,000 |
| 7/1/2024 | 104,000 |
| 8/1/2024 | 104,000 |
| 9/1/2024 | 106,000 |
| 10/1/2024 | 107,000 |
| 11/1/2024 | 109,000 |
| 12/1/2024 | 104,000 |
| 1/1/2025 | 106,000 |
| 2/1/2025 | 108,000 |
| 3/1/2025 | 108,000 |
| 4/1/2025 | 107,000 |
| 5/1/2025 | 106,000 |
Manufactured home production in the U.S. has experienced significant fluctuations over the past decade, reflecting broader economic conditions. After falling sharply in the early months of the COVID-19 pandemic, shipments rebounded rapidly, peaking at an annual rate of approximately 122,000 units in March 2022. This marked a more than twofold increase from the early 2010s, when annualized shipment rates regularly hovered below 60,000.
However, that momentum was short-lived. As inflation accelerated and mortgage interest rates climbed to multi-decade highs in late 2022 and into 2023, demand for housing softened broadly. Manufactured home shipments fell sharply during this period, declining by nearly one-third by March 2023 compared to the previous year. This downturn mirrored a steep drop in traditional site-built housing starts, which also contracted significantly amid tighter financial conditions.
Recent data suggests the manufactured housing market is stabilizing—and even recovering—faster than the broader housing sector. Factories shipped approximately 103,300 new manufactured homes in 2024, up from 89,169 in 2023. By May 2025, the annual shipment rate had climbed to around 106,000—still about 13% below the March 2022 peak, but a clear rebound from the lows of early 2023. In contrast, site-built housing starts have remained low. The relative strength in manufactured housing may reflect easing inflation, sustained consumer interest in affordable homeownership, and recent policy changes at the state and local level that have expanded opportunities for manufactured home development.
After delivery to the homesite, manufactured housing projects are treated like other jobsites when it comes to risk. That’s why contractors depend on insurance to cover liability, property damage, and worker injuries. Explore the basics in our guide to construction insurance.
Manufactured vs. Site-Built Housing Costs
In 2024, manufactured homes sold for 66% less than all single-family homes
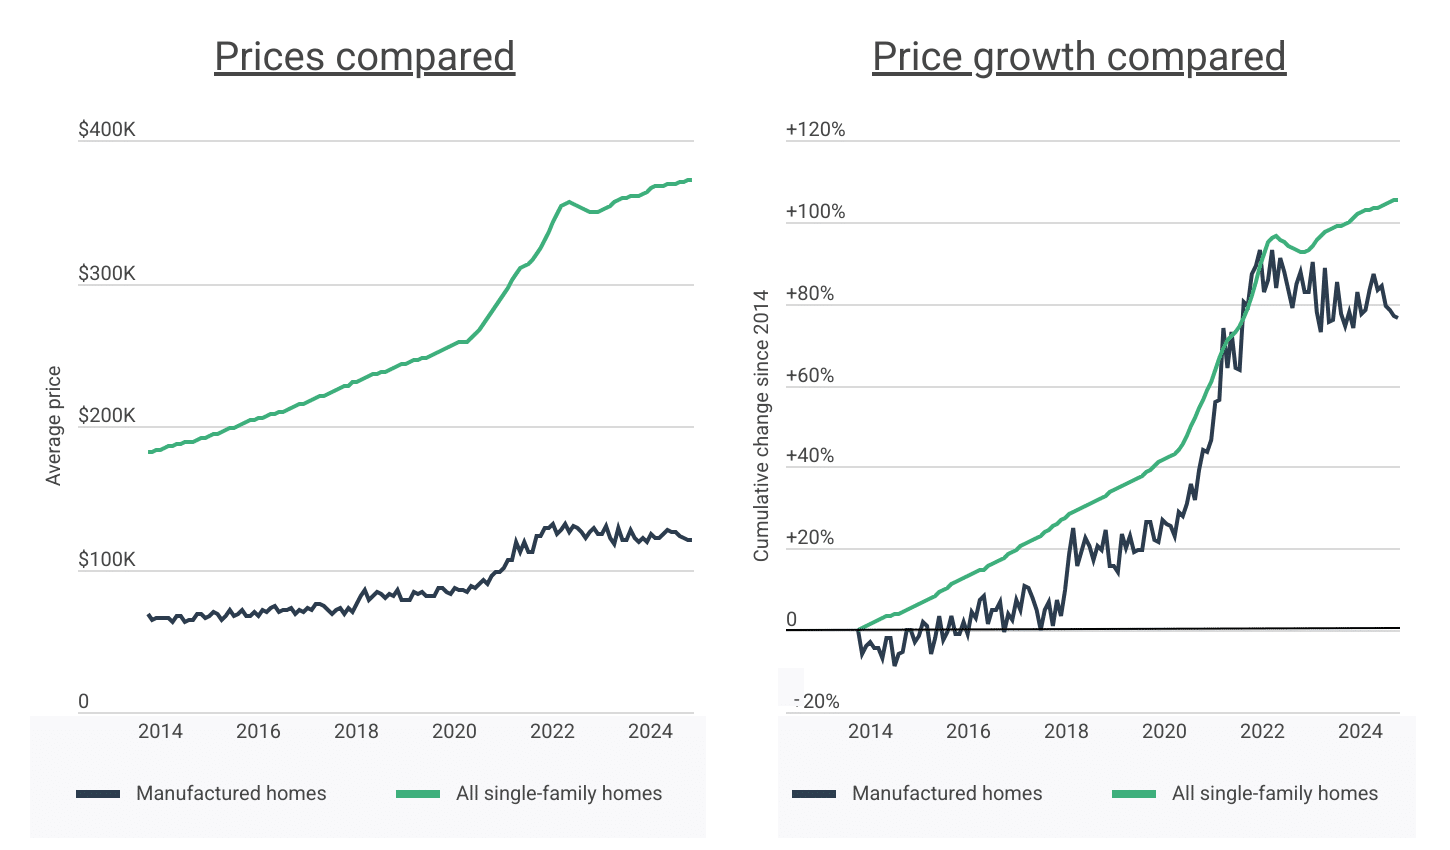
Data: Comparison of Manufactured and Site-Built Housing Costs Showing Total Ownership Costs and Average Price per Square Foot Over Time
| Date | Manufactured homes | All single-family |
|---|---|---|
| 1/1/2014 | $68,300 | $181,355 |
| 2/1/2014 | $64,300 | $182,204 |
| 3/1/2014 | $65,700 | $183,052 |
| 4/1/2014 | $66,400 | $183,899 |
| 5/1/2014 | $65,400 | $184,875 |
| 6/1/2014 | $65,200 | $185,747 |
| 7/1/2014 | $63,500 | $186,607 |
| 8/1/2014 | $67,100 | $187,267 |
| 9/1/2014 | $67,000 | $187,888 |
| 10/1/2014 | $62,400 | $188,294 |
| 11/1/2014 | $64,200 | $188,822 |
| 12/1/2014 | $64,800 | $189,472 |
| 1/1/2015 | $68,400 | $190,283 |
| 2/1/2015 | $68,300 | $191,102 |
| 3/1/2015 | $66,200 | $191,938 |
| 4/1/2015 | $67,400 | $192,856 |
| 5/1/2015 | $69,500 | $193,866 |
| 6/1/2015 | $69,100 | $194,845 |
| 7/1/2015 | $64,500 | $195,854 |
| 8/1/2015 | $67,000 | $196,911 |
| 9/1/2015 | $70,700 | $198,079 |
| 10/1/2015 | $66,800 | $199,299 |
| 11/1/2015 | $68,000 | $200,388 |
| 12/1/2015 | $70,800 | $201,467 |
| 1/1/2016 | $67,600 | $202,636 |
| 2/1/2016 | $67,600 | $203,804 |
| 3/1/2016 | $69,800 | $204,664 |
| 4/1/2016 | $67,800 | $205,443 |
| 5/1/2016 | $71,300 | $206,233 |
| 6/1/2016 | $70,500 | $207,196 |
| 7/1/2016 | $73,300 | $207,940 |
| 8/1/2016 | $74,200 | $208,644 |
| 9/1/2016 | $69,400 | $209,420 |
| 10/1/2016 | $71,600 | $210,384 |
| 11/1/2016 | $71,700 | $211,440 |
| 12/1/2016 | $73,100 | $212,556 |
| 1/1/2017 | $68,100 | $213,673 |
| 2/1/2017 | $71,000 | $214,830 |
| 3/1/2017 | $70,100 | $216,020 |
| 4/1/2017 | $73,300 | $217,326 |
| 5/1/2017 | $71,800 | $218,510 |
| 6/1/2017 | $75,600 | $219,617 |
| 7/1/2017 | $75,300 | $220,551 |
| 8/1/2017 | $73,800 | $221,494 |
| 9/1/2017 | $71,800 | $222,484 |
| 10/1/2017 | $68,300 | $223,615 |
| 11/1/2017 | $71,800 | $224,847 |
| 12/1/2017 | $72,900 | $226,133 |
| 1/1/2018 | $69,000 | $227,413 |
| 2/1/2018 | $73,400 | $228,647 |
| 3/1/2018 | $70,600 | $230,070 |
| 4/1/2018 | $74,900 | $231,361 |
| 5/1/2018 | $81,200 | $232,615 |
| 6/1/2018 | $85,400 | $233,536 |
| 7/1/2018 | $78,900 | $234,690 |
| 8/1/2018 | $81,500 | $235,794 |
| 9/1/2018 | $83,600 | $236,897 |
| 10/1/2018 | $82,400 | $237,648 |
| 11/1/2018 | $79,900 | $238,407 |
| 12/1/2018 | $82,400 | $239,226 |
| 1/1/2019 | $81,800 | $240,234 |
| 2/1/2019 | $85,000 | $241,423 |
| 3/1/2019 | $78,900 | $242,705 |
| 4/1/2019 | $78,900 | $243,860 |
| 5/1/2019 | $78,100 | $244,732 |
| 6/1/2019 | $84,400 | $245,499 |
| 7/1/2019 | $82,000 | $246,207 |
| 8/1/2019 | $84,100 | $246,976 |
| 9/1/2019 | $81,500 | $247,650 |
| 10/1/2019 | $81,700 | $248,574 |
| 11/1/2019 | $81,600 | $249,810 |
| 12/1/2019 | $86,400 | $251,250 |
| 1/1/2020 | $86,400 | $252,802 |
| 2/1/2020 | $83,400 | $254,320 |
| 3/1/2020 | $82,900 | $255,915 |
| 4/1/2020 | $86,900 | $257,309 |
| 5/1/2020 | $85,900 | $258,109 |
| 6/1/2020 | $85,600 | $258,582 |
| 7/1/2020 | $84,200 | $259,352 |
| 8/1/2020 | $88,200 | $261,126 |
| 9/1/2020 | $87,300 | $264,123 |
| 10/1/2020 | $89,400 | $267,744 |
| 11/1/2020 | $92,600 | $271,815 |
| 12/1/2020 | $90,200 | $275,767 |
| 1/1/2021 | $95,000 | $279,586 |
| 2/1/2021 | $98,300 | $283,503 |
| 3/1/2021 | $98,100 | $287,581 |
| 4/1/2021 | $100,200 | $292,009 |
| 5/1/2021 | $106,500 | $296,882 |
| 6/1/2021 | $106,800 | $302,108 |
| 7/1/2021 | $118,700 | $306,754 |
| 8/1/2021 | $112,000 | $309,990 |
| 9/1/2021 | $118,300 | $311,885 |
| 10/1/2021 | $112,000 | $313,751 |
| 11/1/2021 | $111,900 | $316,365 |
| 12/1/2021 | $123,200 | $319,636 |
| 1/1/2022 | $122,500 | $324,230 |
| 2/1/2022 | $128,000 | $329,772 |
| 3/1/2022 | $129,200 | $336,291 |
| 4/1/2022 | $132,000 | $342,753 |
| 5/1/2022 | $124,900 | $348,498 |
| 6/1/2022 | $126,900 | $353,277 |
| 7/1/2022 | $131,800 | $355,780 |
| 8/1/2022 | $125,700 | $356,150 |
| 9/1/2022 | $130,400 | $354,828 |
| 10/1/2022 | $128,300 | $353,539 |
| 11/1/2022 | $125,200 | $352,445 |
| 12/1/2022 | $122,100 | $351,452 |
| 1/1/2023 | $126,100 | $350,218 |
| 2/1/2023 | $128,100 | $349,375 |
| 3/1/2023 | $124,700 | $349,418 |
| 4/1/2023 | $125,000 | $350,507 |
| 5/1/2023 | $129,900 | $352,263 |
| 6/1/2023 | $121,400 | $354,303 |
| 7/1/2023 | $118,000 | $356,122 |
| 8/1/2023 | $128,800 | $357,773 |
| 9/1/2023 | $119,700 | $358,993 |
| 10/1/2023 | $120,000 | $359,905 |
| 11/1/2023 | $126,600 | $360,566 |
| 12/1/2023 | $121,300 | $361,050 |
| 1/1/2024 | $119,200 | $361,512 |
| 2/1/2024 | $121,600 | $362,364 |
| 3/1/2024 | $118,800 | $363,974 |
| 4/1/2024 | $125,000 | $365,954 |
| 5/1/2024 | $121,000 | $367,505 |
| 6/1/2024 | $121,900 | $368,175 |
| 7/1/2024 | $125,100 | $368,396 |
| 8/1/2024 | $127,800 | $368,692 |
| 9/1/2024 | $125,200 | $369,198 |
| 10/1/2024 | $125,800 | $369,866 |
| 11/1/2024 | $122,700 | $370,462 |
| 12/1/2024 | $121,700 | $371,290 |
| 1/1/2025 | $120,900 | $372,002 |
| 2/1/2025 | $120,400 | $372,517 |
| Date | Manufactured homes | All single-family |
|---|---|---|
| 1/1/2014 | 0% | 0% |
| 2/1/2014 | -5.9% | +0.5% |
| 3/1/2014 | -3.8% | +0.9% |
| 4/1/2014 | -2.8% | +1.4% |
| 5/1/2014 | -4.2% | +1.9% |
| 6/1/2014 | -4.5% | +2.4% |
| 7/1/2014 | -7.0% | +2.9% |
| 8/1/2014 | -1.8% | +3.3% |
| 9/1/2014 | -1.9% | +3.6% |
| 10/1/2014 | -8.6% | +3.8% |
| 11/1/2014 | -6.0% | +4.1% |
| 12/1/2014 | -5.1% | +4.5% |
| 1/1/2015 | +0.1% | +4.9% |
| 2/1/2015 | 0% | +5.4% |
| 3/1/2015 | -3.1% | +5.8% |
| 4/1/2015 | -1.3% | +6.3% |
| 5/1/2015 | +1.8% | +6.9% |
| 6/1/2015 | +1.2% | +7.4% |
| 7/1/2015 | -5.6% | +8.0% |
| 8/1/2015 | -1.9% | +8.6% |
| 9/1/2015 | +3.5% | +9.2% |
| 10/1/2015 | -2.2% | +9.9% |
| 11/1/2015 | -0.4% | +10.5% |
| 12/1/2015 | +3.7% | +11.1% |
| 1/1/2016 | -1.0% | +11.7% |
| 2/1/2016 | -1.0% | +12.4% |
| 3/1/2016 | +2.2% | +12.9% |
| 4/1/2016 | -0.7% | +13.3% |
| 5/1/2016 | +4.4% | +13.7% |
| 6/1/2016 | +3.2% | +14.2% |
| 7/1/2016 | +7.3% | +14.7% |
| 8/1/2016 | +8.6% | +15.0% |
| 9/1/2016 | +1.6% | +15.5% |
| 10/1/2016 | +4.8% | +16.0% |
| 11/1/2016 | +5.0% | +16.6% |
| 12/1/2016 | +7.0% | +17.2% |
| 1/1/2017 | -0.3% | +17.8% |
| 2/1/2017 | +4.0% | +18.5% |
| 3/1/2017 | +2.6% | +19.1% |
| 4/1/2017 | +7.3% | +19.8% |
| 5/1/2017 | +5.1% | +20.5% |
| 6/1/2017 | +10.7% | +21.1% |
| 7/1/2017 | +10.2% | +21.6% |
| 8/1/2017 | +8.1% | +22.1% |
| 9/1/2017 | +5.1% | +22.7% |
| 10/1/2017 | 0% | +23.3% |
| 11/1/2017 | +5.1% | +24.0% |
| 12/1/2017 | +6.7% | +24.7% |
| 1/1/2018 | +1.0% | +25.4% |
| 2/1/2018 | +7.5% | +26.1% |
| 3/1/2018 | +3.4% | +26.9% |
| 4/1/2018 | +9.7% | +27.6% |
| 5/1/2018 | +18.9% | +28.3% |
| 6/1/2018 | +25.0% | +28.8% |
| 7/1/2018 | +15.5% | +29.4% |
| 8/1/2018 | +19.3% | +30.0% |
| 9/1/2018 | +22.4% | +30.6% |
| 10/1/2018 | +20.6% | +31.0% |
| 11/1/2018 | +17.0% | +31.5% |
| 12/1/2018 | +20.6% | +31.9% |
| 1/1/2019 | +19.8% | +32.5% |
| 2/1/2019 | +24.5% | +33.1% |
| 3/1/2019 | +15.5% | +33.8% |
| 4/1/2019 | +15.5% | +34.5% |
| 5/1/2019 | +14.3% | +34.9% |
| 6/1/2019 | +23.6% | +35.4% |
| 7/1/2019 | +20.1% | +35.8% |
| 8/1/2019 | +23.1% | +36.2% |
| 9/1/2019 | +19.3% | +36.6% |
| 10/1/2019 | +19.6% | +37.1% |
| 11/1/2019 | +19.5% | +37.7% |
| 12/1/2019 | +26.5% | +38.5% |
| 1/1/2020 | +26.5% | +39.4% |
| 2/1/2020 | +22.1% | +40.2% |
| 3/1/2020 | +21.4% | +41.1% |
| 4/1/2020 | +27.2% | +41.9% |
| 5/1/2020 | +25.8% | +42.3% |
| 6/1/2020 | +25.3% | +42.6% |
| 7/1/2020 | +23.3% | +43.0% |
| 8/1/2020 | +29.1% | +44.0% |
| 9/1/2020 | +27.8% | +45.6% |
| 10/1/2020 | +30.9% | +47.6% |
| 11/1/2020 | +35.6% | +49.9% |
| 12/1/2020 | +32.1% | +52.1% |
| 1/1/2021 | +39.1% | +54.2% |
| 2/1/2021 | +43.9% | +56.3% |
| 3/1/2021 | +43.6% | +58.6% |
| 4/1/2021 | +46.7% | +61.0% |
| 5/1/2021 | +55.9% | +63.7% |
| 6/1/2021 | +56.4% | +66.6% |
| 7/1/2021 | +73.8% | +69.1% |
| 8/1/2021 | +64.0% | +70.9% |
| 9/1/2021 | +73.2% | +72.0% |
| 10/1/2021 | +64.0% | +73.0% |
| 11/1/2021 | +63.8% | +74.4% |
| 12/1/2021 | +80.4% | +76.2% |
| 1/1/2022 | +79.4% | +78.8% |
| 2/1/2022 | +87.4% | +81.8% |
| 3/1/2022 | +89.2% | +85.4% |
| 4/1/2022 | +93.3% | +89.0% |
| 5/1/2022 | +82.9% | +92.2% |
| 6/1/2022 | +85.8% | +94.8% |
| 7/1/2022 | +93.0% | +96.2% |
| 8/1/2022 | +84.0% | +96.4% |
| 9/1/2022 | +90.9% | +95.7% |
| 10/1/2022 | +87.8% | +94.9% |
| 11/1/2022 | +83.3% | +94.3% |
| 12/1/2022 | +78.8% | +93.8% |
| 1/1/2023 | +84.6% | +93.1% |
| 2/1/2023 | +87.6% | +92.6% |
| 3/1/2023 | +82.6% | +92.7% |
| 4/1/2023 | +83.0% | +93.3% |
| 5/1/2023 | +90.2% | +94.2% |
| 6/1/2023 | +77.7% | +95.4% |
| 7/1/2023 | +72.8% | +96.4% |
| 8/1/2023 | +88.6% | +97.3% |
| 9/1/2023 | +75.3% | +98.0% |
| 10/1/2023 | +75.7% | +98.5% |
| 11/1/2023 | +85.4% | +98.8% |
| 12/1/2023 | +77.6% | +99.1% |
| 1/1/2024 | +74.5% | +99.3% |
| 2/1/2024 | +78.0% | +99.8% |
| 3/1/2024 | +73.9% | +100.7% |
| 4/1/2024 | +83.0% | +101.8% |
| 5/1/2024 | +77.2% | +102.6% |
| 6/1/2024 | +78.5% | +103.0% |
| 7/1/2024 | +83.2% | +103.1% |
| 8/1/2024 | +87.1% | +103.3% |
| 9/1/2024 | +83.3% | +103.6% |
| 10/1/2024 | +84.2% | +103.9% |
| 11/1/2024 | +79.6% | +104.3% |
| 12/1/2024 | +78.2% | +104.7% |
| 1/1/2025 | +77.0% | +105.1% |
| 2/1/2025 | +76.3% | +105.4% |
The average sale price of a manufactured home in 2024 was $123,300, while the median value of a single-family home was $367,282, according to Zillow. It’s important to note that the manufactured home price reflects the cost of the home itself and excludes the value of land, whereas the single-family home figure—based on the Zillow Home Value Index (ZHVI)—includes both the home and the land. Despite this distinction, the data highlights the significant affordability advantage of manufactured housing.
While manufactured homes continue to offer a lower-cost alternative to site-built housing, rising demand has pushed prices higher in both segments. Since 2014, the average price of a manufactured home has increased by 76.3%, while single-family home values have surged by 105.4%. Most of this growth occurred during 2020 and 2021, fueled by low interest rates and intense housing demand. Although prices for both types of homes leveled off in 2022 amid rising interest rates, single-family home values have continued to climb, while manufactured home prices have stabilized—widening the cost gap even further.
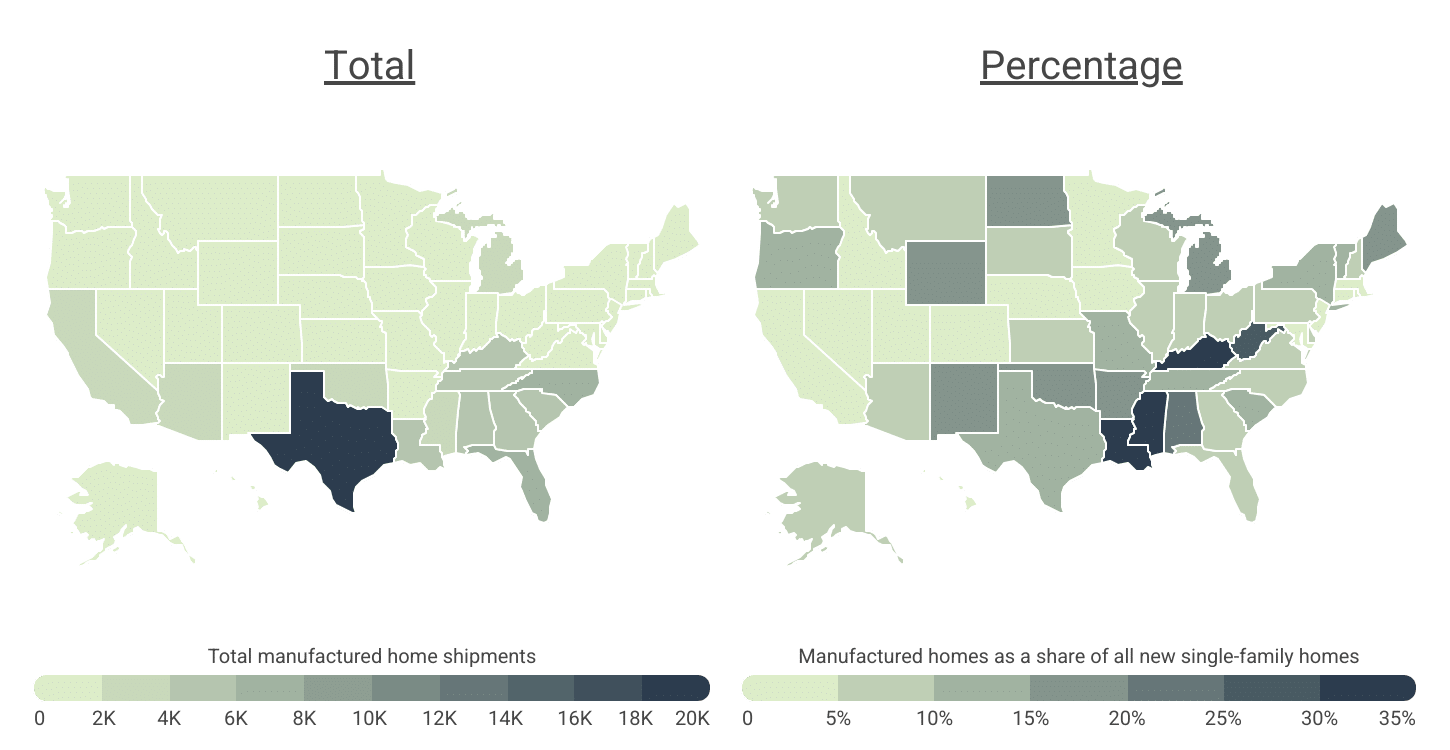
Manufactured Housing Shipments by State
Manufactured housing is most popular in the South, accounting for more than 30% of new housing stock in certain states
Data: Manufactured Housing Shipments by State
| State | Manufactured home share |
|---|---|
| Mississippi | 34.3% |
| Kentucky | 31.6% |
| Louisiana | 30.4% |
| West Virginia | 25.8% |
| Alabama | 24.8% |
| New Mexico | 19.6% |
| Oklahoma | 18.6% |
| North Dakota | 18.2% |
| Michigan | 17.2% |
| Wyoming | 16.4% |
| Arkansas | 15.9% |
| Maine | 15.2% |
| New York | 13.4% |
| Missouri | 12.1% |
| South Carolina | 11.7% |
| Oregon | 11.3% |
| Tennessee | 11.2% |
| Vermont | 10.6% |
| Texas | 10.4% |
| Montana | 9.8% |
| Ohio | 9.4% |
| South Dakota | 9.4% |
| Pennsylvania | 9.3% |
| Indiana | 8.9% |
| North Carolina | 8.8% |
| Georgia | 8.7% |
| New Hampshire | 8.7% |
| Illinois | 8.3% |
| Kansas | 7.4% |
| Wisconsin | 7.3% |
| Washington | 6.6% |
| Virginia | 6.0% |
| Florida | 5.7% |
| Alaska | 5.3% |
| Delaware | 5.1% |
| Arizona | 5.0% |
| Minnesota | 4.9% |
| Iowa | 4.7% |
| Connecticut | 4.6% |
| California | 4.4% |
| Nebraska | 3.9% |
| Colorado | 3.4% |
| Nevada | 2.8% |
| Idaho | 2.8% |
| Massachusetts | 2.6% |
| Rhode Island | 2.5% |
| New Jersey | 2.0% |
| Maryland | 1.8% |
| Utah | 1.5% |
| Hawaii | 0.0% |
| State | Total manufactured homes |
|---|---|
| Mississippi | 3,929 |
| Kentucky | 4,118 |
| Louisiana | 5,302 |
| West Virginia | 1,221 |
| Alabama | 5,744 |
| New Mexico | 1,581 |
| Oklahoma | 2,491 |
| North Dakota | 368 |
| Michigan | 3,135 |
| Wyoming | 320 |
| Arkansas | 1,855 |
| Maine | 835 |
| New York | 1,616 |
| Missouri | 1,590 |
| South Carolina | 5,397 |
| Oregon | 1,244 |
| Tennessee | 4,120 |
| Vermont | 166 |
| Texas | 18,343 |
| Montana | 331 |
| Ohio | 1,845 |
| South Dakota | 338 |
| Pennsylvania | 1,681 |
| Indiana | 1,951 |
| North Carolina | 6,768 |
| Georgia | 4,601 |
| New Hampshire | 277 |
| Illinois | 932 |
| Kansas | 447 |
| Wisconsin | 1,020 |
| Washington | 1,342 |
| Virginia | 1,447 |
| Florida | 7,405 |
| Alaska | 25 |
| Delaware | 336 |
| Arizona | 2,192 |
| Minnesota | 692 |
| Iowa | 386 |
| Connecticut | 103 |
| California | 2,813 |
| Nebraska | 229 |
| Colorado | 729 |
| Nevada | 447 |
| Idaho | 433 |
| Massachusetts | 150 |
| Rhode Island | 21 |
| New Jersey | 299 |
| Maryland | 204 |
| Utah | 276 |
| Hawaii | 0 |
Manufactured housing varies in popularity across the U.S., but the South stands out for its affinity for manufactured homes. High-growth, high-population states like Texas (18,343 shipments in 2024), Florida (7,405), and North Carolina (6,768) lead the nation in total shipments, reflecting both population pressures and a favorable regulatory climate for factory-built housing.
Every manufactured home requires electrical hookups and inspection. Licensed electricians often need proof of insurance before taking on these jobs, and coverage helps protect against liability and equipment loss. See what’s included in our electrician insurance guide.
However, when looking at manufactured homes as a share of all new single-family housing, the top states tend to be lower-income and more rural. Mississippi (34.3%), Kentucky (31.6%), Louisiana (30.4%), and West Virginia (25.8%) all rank at the top by this measure, suggesting that affordability plays a larger role in these markets. In these states, manufactured housing serves as a critical alternative for residents priced out of conventional site-built homes.
Alabama is a notable case, ranking fourth in total shipments and fifth in share, making it one of the few states that performs highly on both metrics. Many of the states with the highest shares of manufactured housing also rank near the bottom in overall housing construction, highlighting the role manufactured homes play in supplementing limited traditional housing supply.
The tables below provide a more detailed look at how states compare. For more information on data sources and methods, see the methodology section below.
States With the Most New Manufactured Homes
| Top States | Total* |
|---|---|
| 1. Texas | 18,343 |
| 2. Florida | 7,405 |
| 3. North Carolina | 6,768 |
| 4. Alabama | 5,744 |
| 5. South Carolina | 5,397 |
| 6. Louisiana | 5,302 |
| 7. Georgia | 4,601 |
| 8. Tennessee | 4,120 |
| 9. Kentucky | 4,118 |
| 10. Mississippi | 3,929 |
| 11. Michigan | 3,135 |
| 12. California | 2,813 |
| 13. Oklahoma | 2,491 |
| 14. Arizona | 2,192 |
| 15. Indiana | 1,951 |
| Bottom States | Total* |
|---|---|
| 1. Hawaii | 0 |
| 2. Rhode Island | 21 |
| 3. Alaska | 25 |
| 4. Connecticut | 103 |
| 5. Massachusetts | 150 |
| 6. Vermont | 166 |
| 7. Maryland | 204 |
| 8. Nebraska | 229 |
| 9. Utah | 276 |
| 10. New Hampshire | 277 |
| 11. New Jersey | 299 |
| 12. Wyoming | 320 |
| 13. Montana | 331 |
| 14. Delaware | 336 |
| 15. South Dakota | 338 |
*Total manufactured home shipments
States With the Highest Percentage of New Manufactured Homes
| Top States | Share** |
|---|---|
| 1. Mississippi | 34.3% |
| 2. Kentucky | 31.6% |
| 3. Louisiana | 30.4% |
| 4. West Virginia | 25.8% |
| 5. Alabama | 24.8% |
| 6. New Mexico | 19.6% |
| 7. Oklahoma | 18.6% |
| 8. North Dakota | 18.2% |
| 9. Michigan | 17.2% |
| 10. Wyoming | 16.4% |
| 11. Arkansas | 15.9% |
| 12. Maine | 15.2% |
| 13. New York | 13.4% |
| 14. Missouri | 12.1% |
| 15. South Carolina | 11.7% |
| Bottom States | Share** |
|---|---|
| 1. Hawaii | 0.0% |
| 2. Utah | 1.5% |
| 3. Maryland | 1.8% |
| 4. New Jersey | 2.0% |
| 5. Rhode Island | 2.5% |
| 6. Massachusetts | 2.6% |
| 7. Idaho | 2.8% |
| 8. Nevada | 2.8% |
| 9. Colorado | 3.4% |
| 10. Nebraska | 3.9% |
| 11. California | 4.4% |
| 12. Connecticut | 4.6% |
| 13. Iowa | 4.7% |
| 14. Minnesota | 4.9% |
| 15. Arizona | 5.0% |
**Manufactured homes as a share of all new single-family homes
Full Results
Methodology
The data used in this analysis is from the U.S. Census Bureau’s Manufactured Housing Survey (MHS), the U.S. Census Bureau’s Building Permits Survey, and Zillow’s Home Value Index (ZHVI). To determine the states investing most in manufactured housing, researchers at Construction Coverage calculated the total manufactured home shipments as a share of all new single-family homes in 2024 (the sum of manufactured home shipments and single-family housing units authorized by building permits). In the event of a tie, the state with the greater total manufactured home shipments was ranked higher. The 2024 average sale price for manufactured homes reflects units of all sizes and excludes land costs, while the median price for single-family homes is based on the ZHVI, which includes both the home and the underlying land.
References
- U.S. Census Bureau and U.S. Department of Housing and Urban Development (July 24, 2025). Average Sales Price of Houses Sold for the United States. https://fred.stlouisfed.org/series/ASPUS.
- Freddie Mac (August 14, 2025). 30-Year Fixed Rate Mortgage Average in the United States. https://fred.stlouisfed.org/series/MORTGAGE30US.
- U.S. Bureau of Labor Statistics (August 12, 2025). Consumer Price Index for All Urban Consumers: Rent of Primary Residence in U.S. City Average. https://fred.stlouisfed.org/series/CUUR0000SEHA.
- Manufactured Housing Institute (2025). About Manufactured Homes. https://www.manufacturedhousing.org/about-manufactured-homes/.
- Manufactured Housing Institute (2025). Research & Data, General Industry Information. https://www.manufacturedhousing.org/home/research-data/.
- The Council of State Governments (May 30, 2024). States Loosen Manufactured Housing Restrictions. https://www.csg.org/2024/05/30/states-loosen-manufactured-housing-restrictions-2/.
- U.S. Census Bureau (2025). Manufactured Housing Survey. https://www.census.gov/programs-surveys/mhs.html.
- U.S. Census Bureau (2025). Building Permits Survey. https://www.census.gov/construction/bps/index.html.
- Zillow (2025). Home Value Index. https://www.zillow.com/research/data/.