The Most Expensive Neighborhood in Every State
Choosing the right neighborhood can make all the difference when it comes to quality of life. It’s also one of the most important factors that dictate price.
According to the Zillow Home Price Index, the median home price in the U.S. is $226,700. However, real estate prices vary widely depending on location. At a macro level, home values in the U.S. tend to be highest in the Northeast and on the West Coast. The South and the Midwest generally have the lowest median home values.
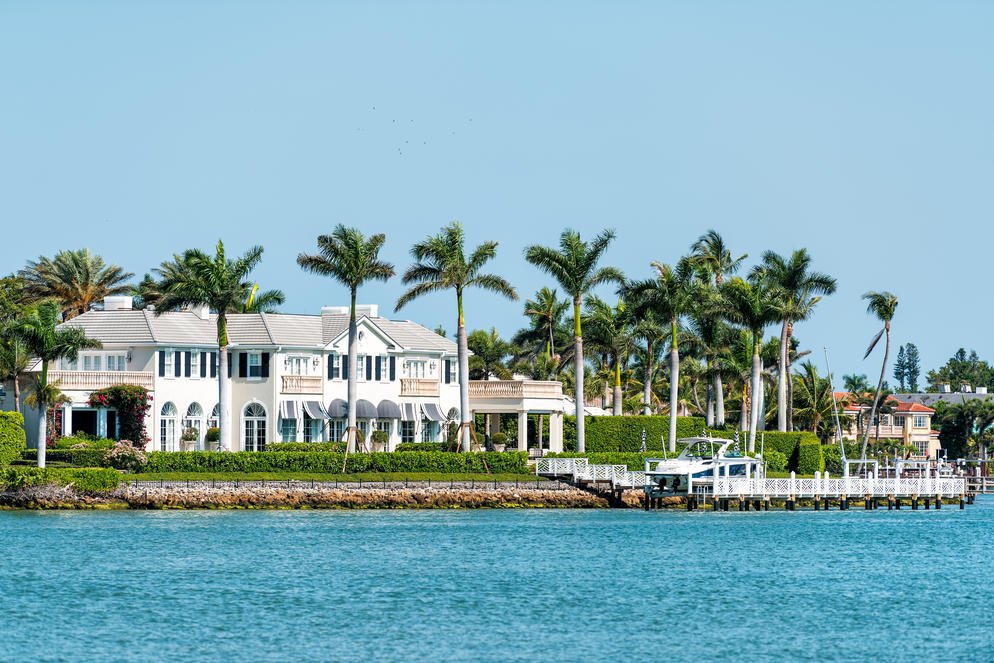
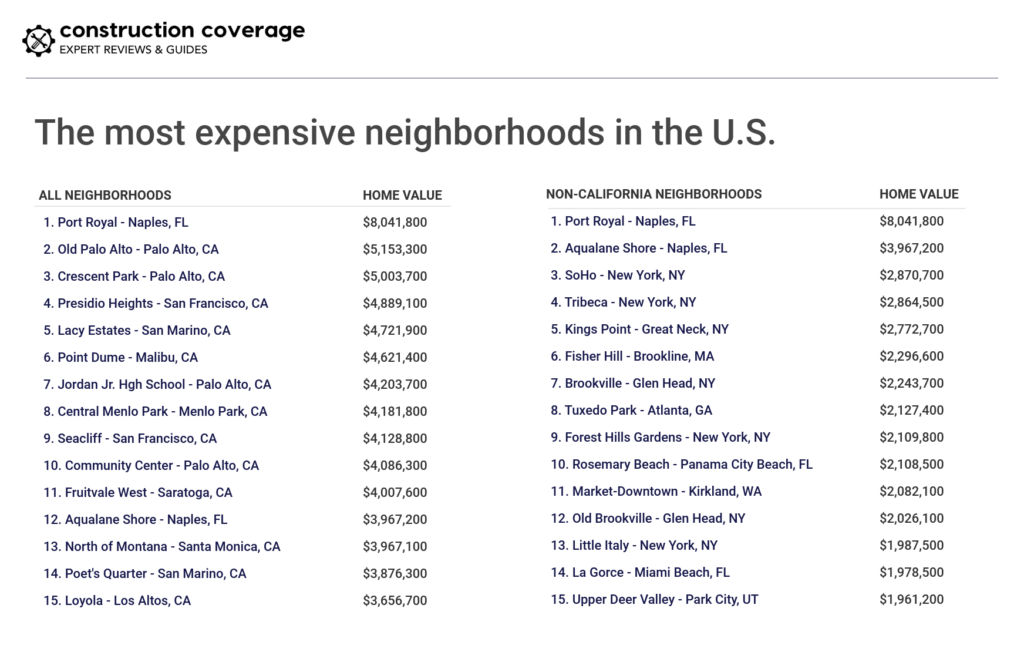
At a micro level, however, homes located just a short drive (or walk) apart can also have extremely different price tags. Within many cities and their surrounding suburbs, the gap in home values between the most expensive and least expensive neighborhood is striking. For example, in the Port Royal neighborhood in Naples, Florida, the median home value is $8,041,800, making it the most expensive neighborhood in the U.S. to buy a home. By contrast, the median home value in Naples Park, a neighborhood about half an hour north of Port Royal, is $393,600, roughly 20 times less.
“Prior to the 21st century, the most desirable areas were located in the suburbs while the inner city was often the least desirable. With the inner city revitalization projects completed or underway all over the country, urban areas are now in hot demand with suburbs being more affordable than ever before,” explained Dave Mele, President of Homes.com. At the same time, according to Mele, “The distinction between suburb and city is getting less clear as smaller areas of both high- and low-income properties dot these areas interchangeably.”
Disparities in home prices and how prices have changed over time vary widely by city and neighborhood. While gentrification in certain cities and neighborhoods has increased home prices, it hasn’t necessarily closed the home price gap between the wealthiest and poorest neighborhoods.
Chief Economist at Realtor.com, Danielle Hale, explained, “A 10 percent increase in price on a $200,000 house is the same dollar amount as a 2 percent increase on a million-dollar home. Thus, gaps in the value of homes can persist even if the rates of increase are higher among less expensive homes.”
This concept was reiterated by Compass real estate broker Grigor Licul: “Emerging neighborhoods have a lower value baseline, and they may have a higher percentage return on the dollar. But the most expensive neighborhoods are top performers in absolute dollar amounts and are far more resilient to downturns.”
According to Licul, the most desirable neighborhoods offer more than just housing. They offer good infrastructure, school districts, and transportation, among other desirable characteristics. The result, he explained, is that: “Developers follow the demand and develop a higher end product within these neighborhoods, further stratifying the market. It is a reinforcing loop which causes the neighborhoods with a higher price baseline to maintain their pricing advantage [and] remain more resilient to potential downturns.”
While Port Royal earns the title of “Most Expensive Neighborhood in America,” an overwhelming majority (roughly 85 percent) of America’s 100 most expensive neighborhoods are located in California, especially concentrated near Silicon Valley.
“California has been an attractive place to live for decades because of its moderate climate and strong economy,” explained Hale. Even in the wake of rising prices and extreme weather events, she suspects, “The strong California economy powered by creativity is likely to continue to attract residents and home buyers. While secondary tech hubs are developing in cities like Seattle, Portland, Austin, and Denver, the Bay Area remains central to the tech industry, which will keep the state top of mind for entrepreneurs and innovators.”
Mele is less certain. “There are no easy solutions when it comes to the future real estate market for California, where home prices are more than double what they are elsewhere. What we do know is that California is deeply impacted by environmental issues. Ranked second by FEMA for states that have suffered the most natural disasters, California is definitely an area that should closely monitor how climate change (and the state’s position on it) affects the real estate industry,” he said.
Outside of California, the most expensive neighborhoods tend to be located on the East Coast, particularly in Florida and New York.
To find the most expensive neighborhoods in every state, Construction Coverage analyzed median home values from the most recent Zillow Home Value Index for the 7,439 most popular neighborhoods for which Zillow collects data. Construction Coverage also looked at how home values in these neighborhoods have changed over time. Here’s what they found:
Takeaways
- With just a few exceptions, the most expensive neighborhood in every state is typically found within or in close proximity to one of the largest cities in that state.
- While some of the most expensive neighborhoods in every state are located in the heart of their respective cities—for example, SoHo in New York or Filter Square in Philadelphia—the majority are residential communities outside of their urban city centers.
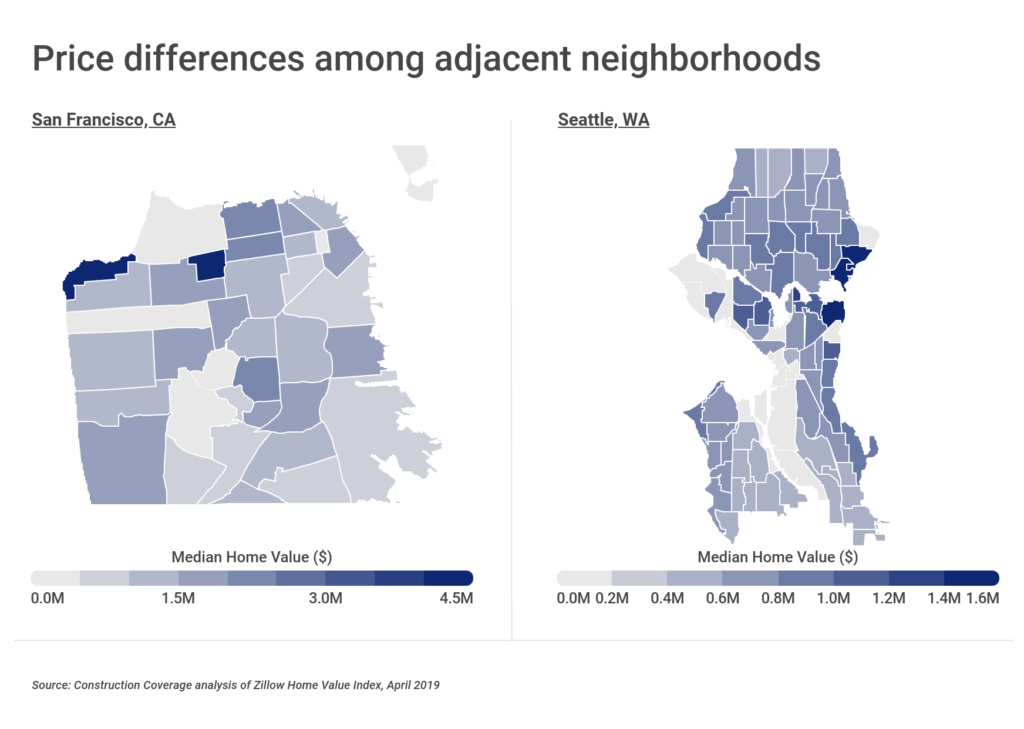
- Stark differences in price exist among nearby neighborhoods as a result of schools, views, proximity to commercial/recreational interests, taxes, safety, and a host of other factors. In San Francisco, there is more than a 6x difference in price between the most expensive and least expensive neighborhood. In Seattle, that number is 4x and in Los Angeles, it’s almost 9x.
- Price differences among the states is striking. There are more than 1,000 neighborhoods in California that are more expensive than the most expensive neighborhoods in the bottom 20 percent of states.
The most expensive neighborhood in each state ranges from a high of $8,041,800 to a low of $169,000. Here are the most expensive neighborhoods in every state.
America’s Most Expensive Neighborhoods
Alabama
- Most expensive neighborhood: Country Club
- City: Mobile
- Metro: Mobile
- Median home value: $454,400
- Peak home value: $454,400 (2019-Q1)
- 1-year change in value: 2.0%
- 5-year change in value: 4.0%
- 10-year change in value: 0.8%
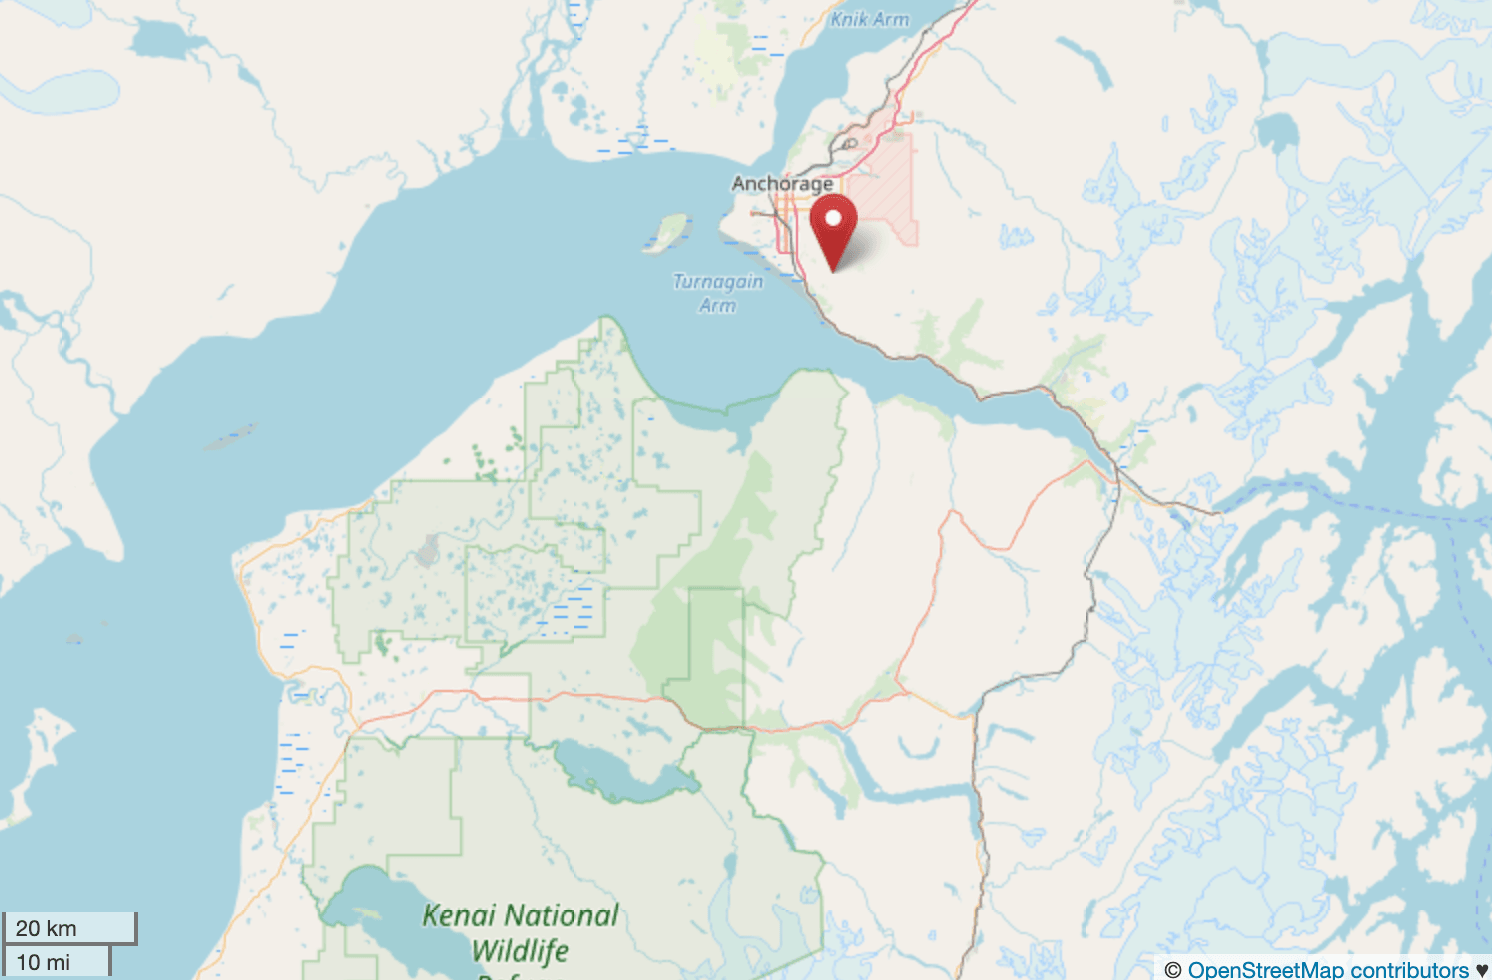
Alaska
- Most expensive neighborhood: Rabbit Creek
- City: Anchorage
- Metro: Anchorage
- Median home value: $576,100
- Peak home value: $590,500 (2017-Q1)
- 1-year change in value: 0.6%
- 5-year change in value: 0.9%
- 10-year change in value: 0.3%
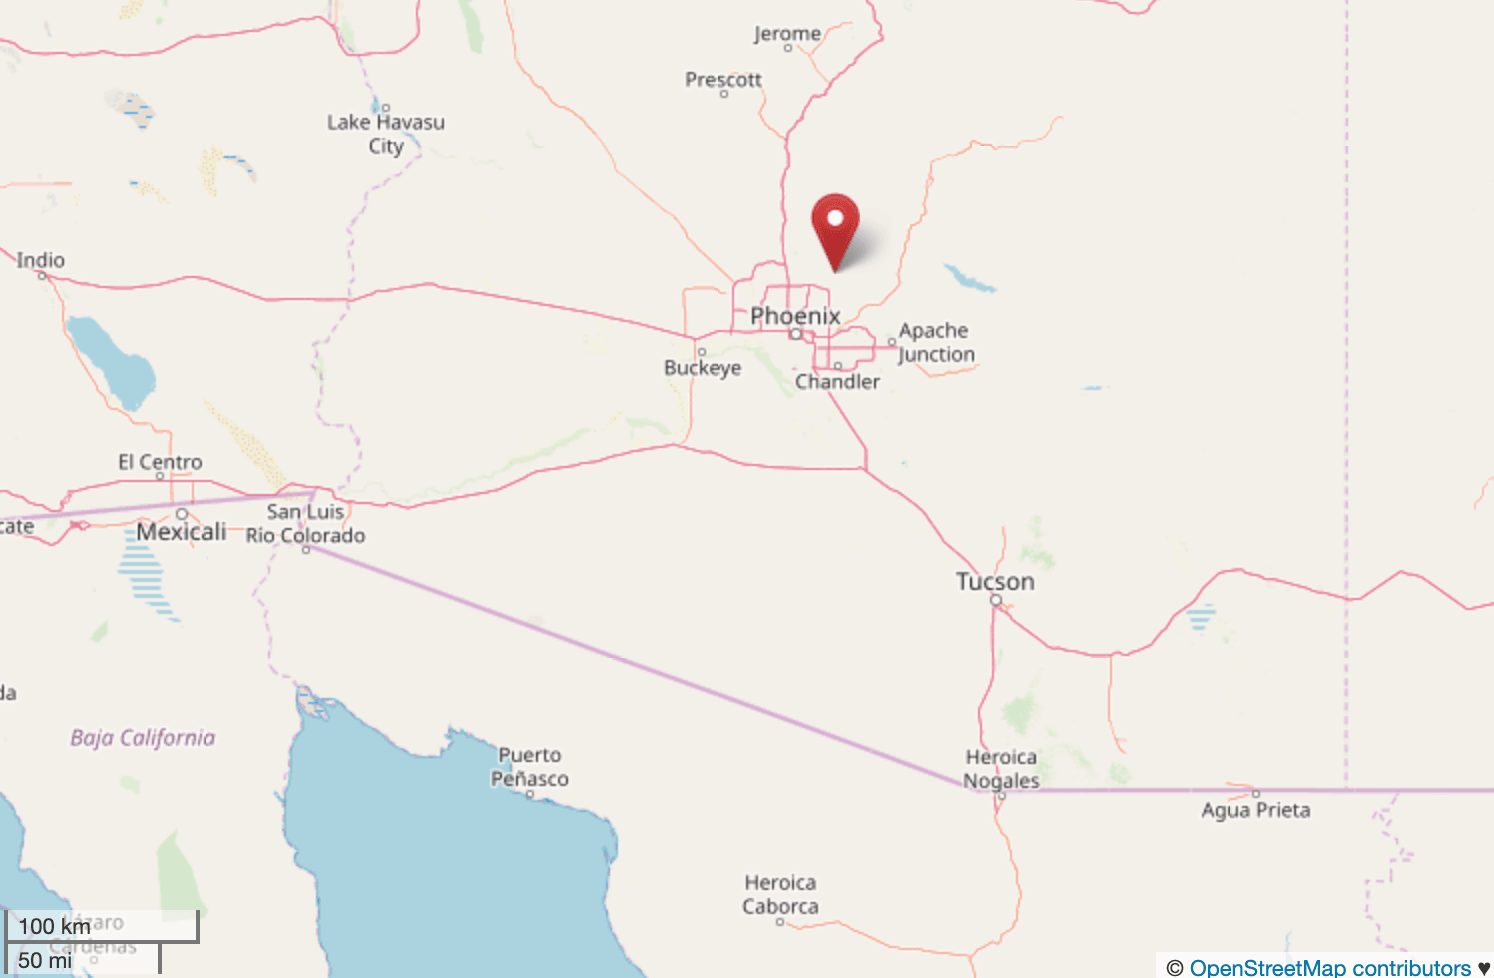
Arizona
- Most expensive neighborhood: Pinnacle Peak
- City: Scottsdale
- Metro: Phoenix-Mesa-Scottsdale
- Median home value: $823,400
- Peak home value: $1,011,900 (2006-Q1)
- 1-year change in value: -0.8%
- 5-year change in value: 2.3%
- 10-year change in value: 1.8%
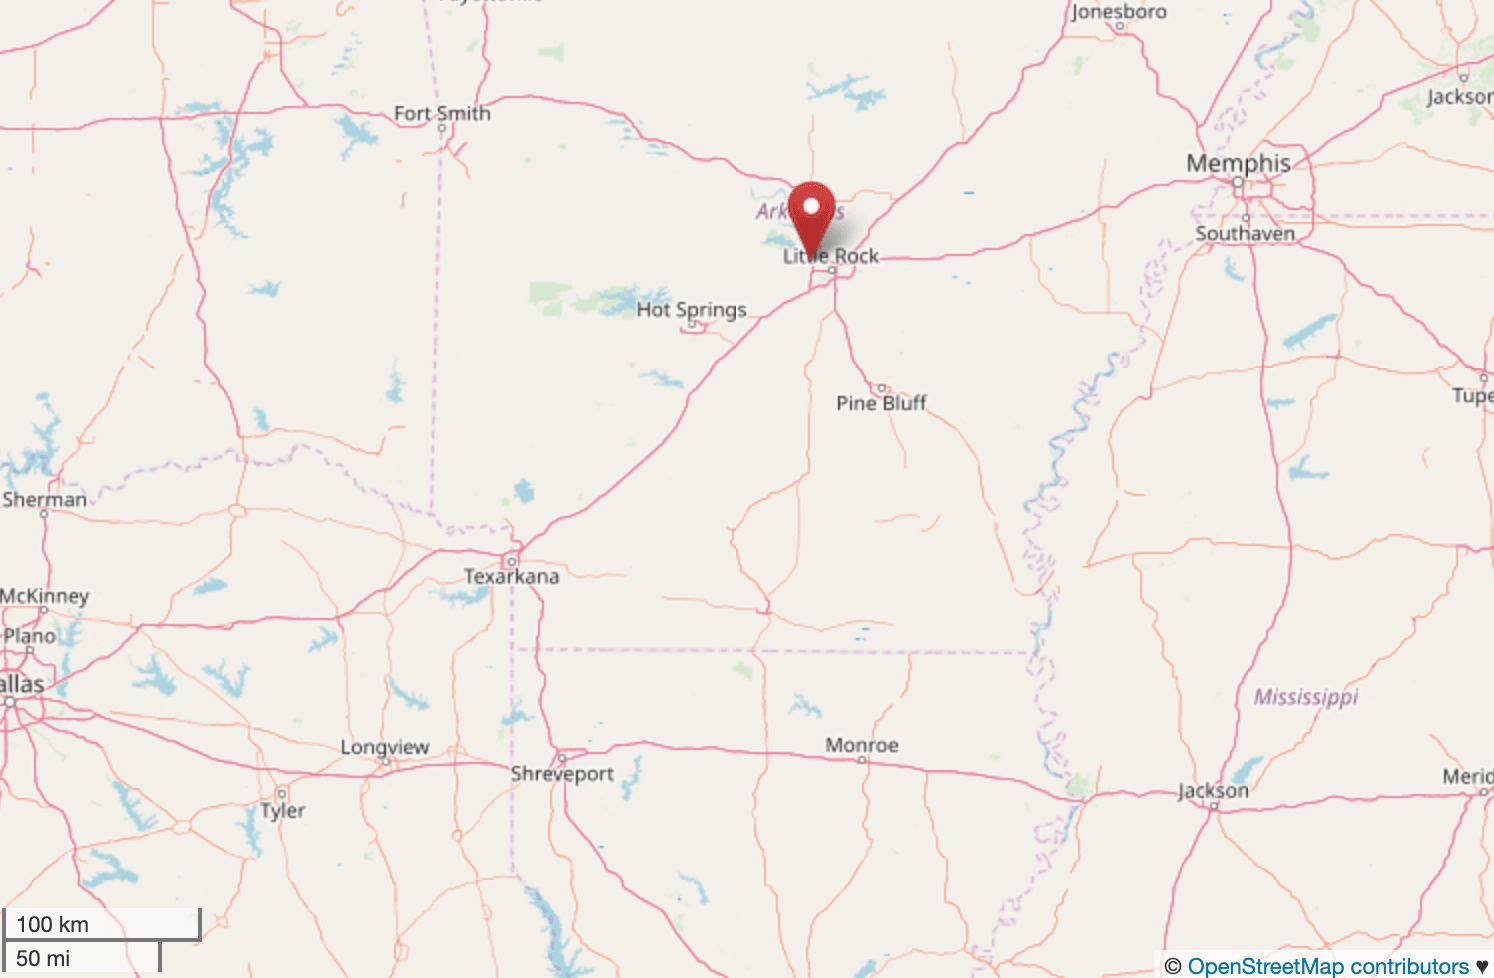
Arkansas
- Most expensive neighborhood: Heights
- City: Little Rock
- Metro: Little Rock-North Little Rock-Conway
- Median home value: $539,800
- Peak home value: $539,800 (2019-Q1)
- 1-year change in value: 12.7%
- 5-year change in value: 7.0%
- 10-year change in value: 2.8%
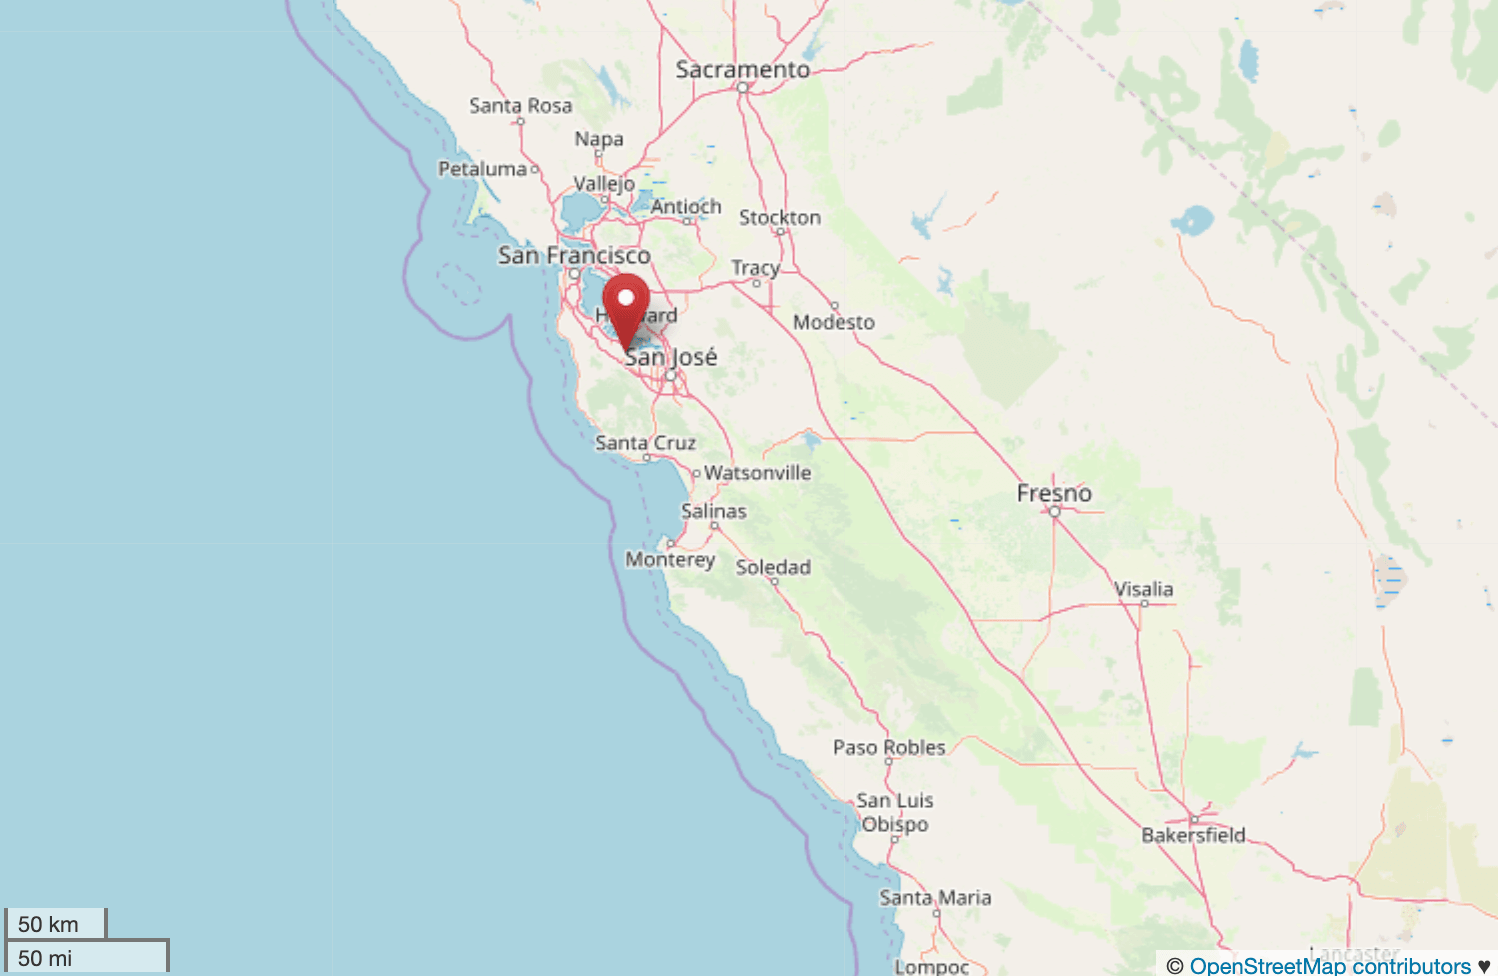
California
- Most expensive neighborhood: Old Palo Alto
- City: Palo Alto
- Metro: San Jose-Sunnyvale-Santa Clara
- Median home value: $5,153,300
- Peak home value: $5,402,100 (2018-Q2)
- 1-year change in value: -2.5%
- 5-year change in value: 9.7%
- 10-year change in value: 10.7%
Colorado
- Most expensive neighborhood: Grant
- City: Boulder
- Metro: Boulder
- Median home value: $1,669,900
- Peak home value: $1,694,500 (2018-Q4)
- 1-year change in value: 2.1%
- 5-year change in value: 9.2%
- 10-year change in value: 5.5%
Connecticut
- Most expensive neighborhood: Silvermine
- City: Wilton
- Metro: Bridgeport-Stamford-Norwalk
- Median home value: $744,400
- Peak home value: $1,011,900 (2005-Q3)
- 1-year change in value: -2.9%
- 5-year change in value: -1.5%
- 10-year change in value: -1.0%
Delaware
- Most expensive neighborhood: Forty Acres
- City: Wilmington
- Metro: Philadelphia-Camden-Wilmington
- Median home value: $272,600
- Peak home value: $314,000 (2006-Q4)
- 1-year change in value: -3.3%
- 5-year change in value: 0.2%
- 10-year change in value: -0.3%
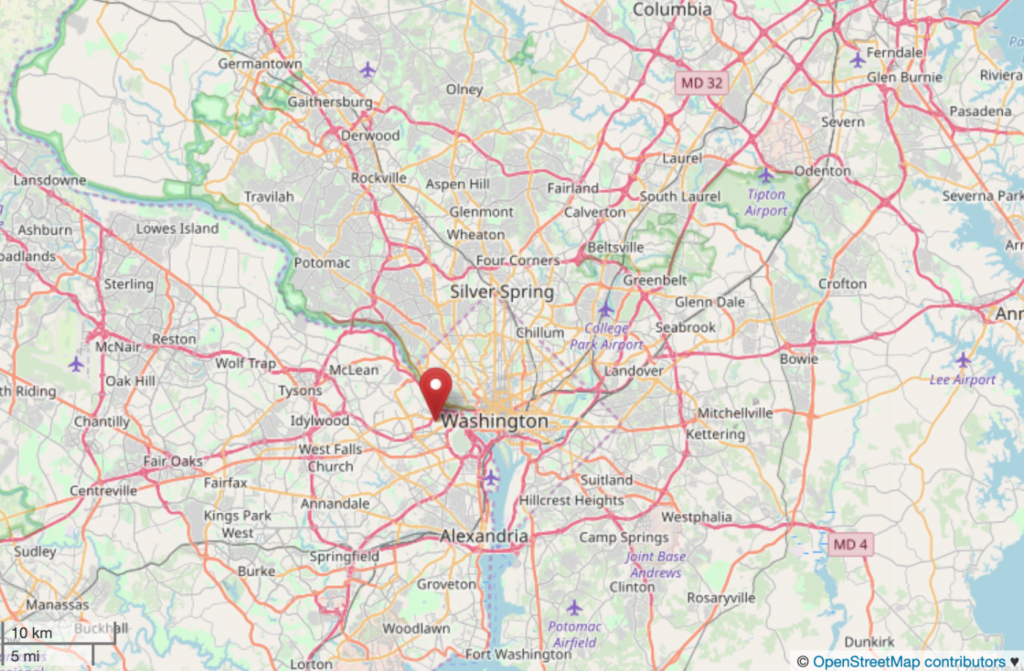
District of Columbia
- Most expensive neighborhood: Berkley
- City: Washington
- Metro: Washington-Arlington-Alexandria
- Median home value: $1,712,000
- Peak home value: $1,807,800 (2018-Q1)
- 1-year change in value: -4.9%
- 5-year change in value: 2.0%
- 10-year change in value: 1.1%
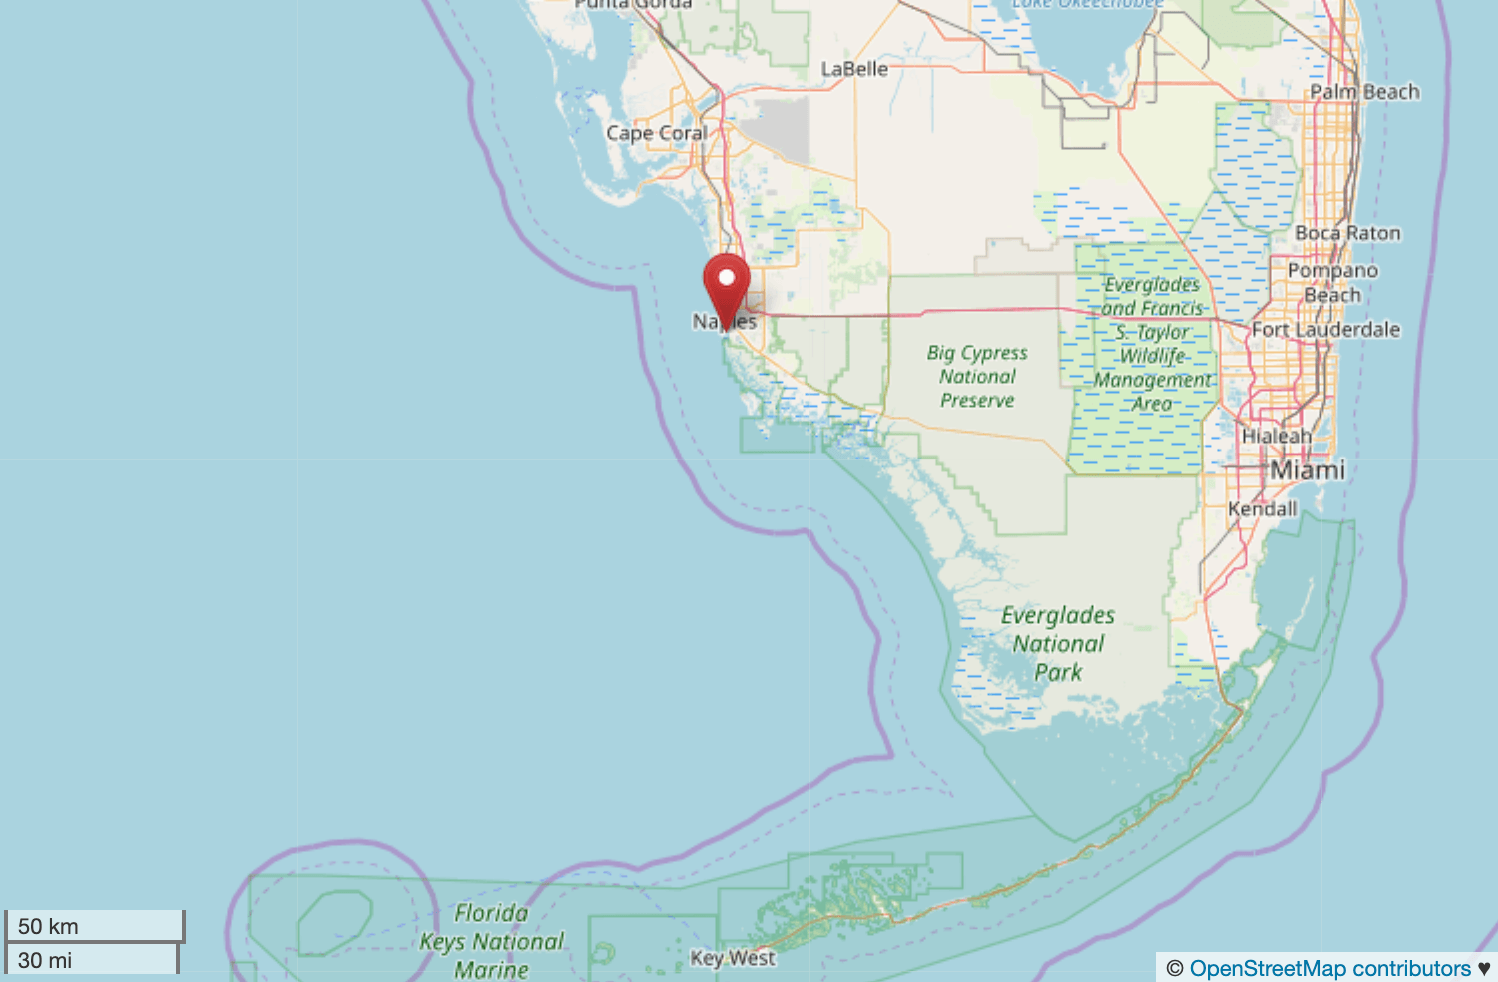
Florida
- Most expensive neighborhood: Port Royal
- City: Naples
- Metro: Naples-Immokalee-Marco Island
- Median home value: $8,041,800
- Peak home value: $8,043,400 (2019-Q1)
- 1-year change in value: 12.6%
- 5-year change in value: 9.1%
- 10-year change in value: 6.3%
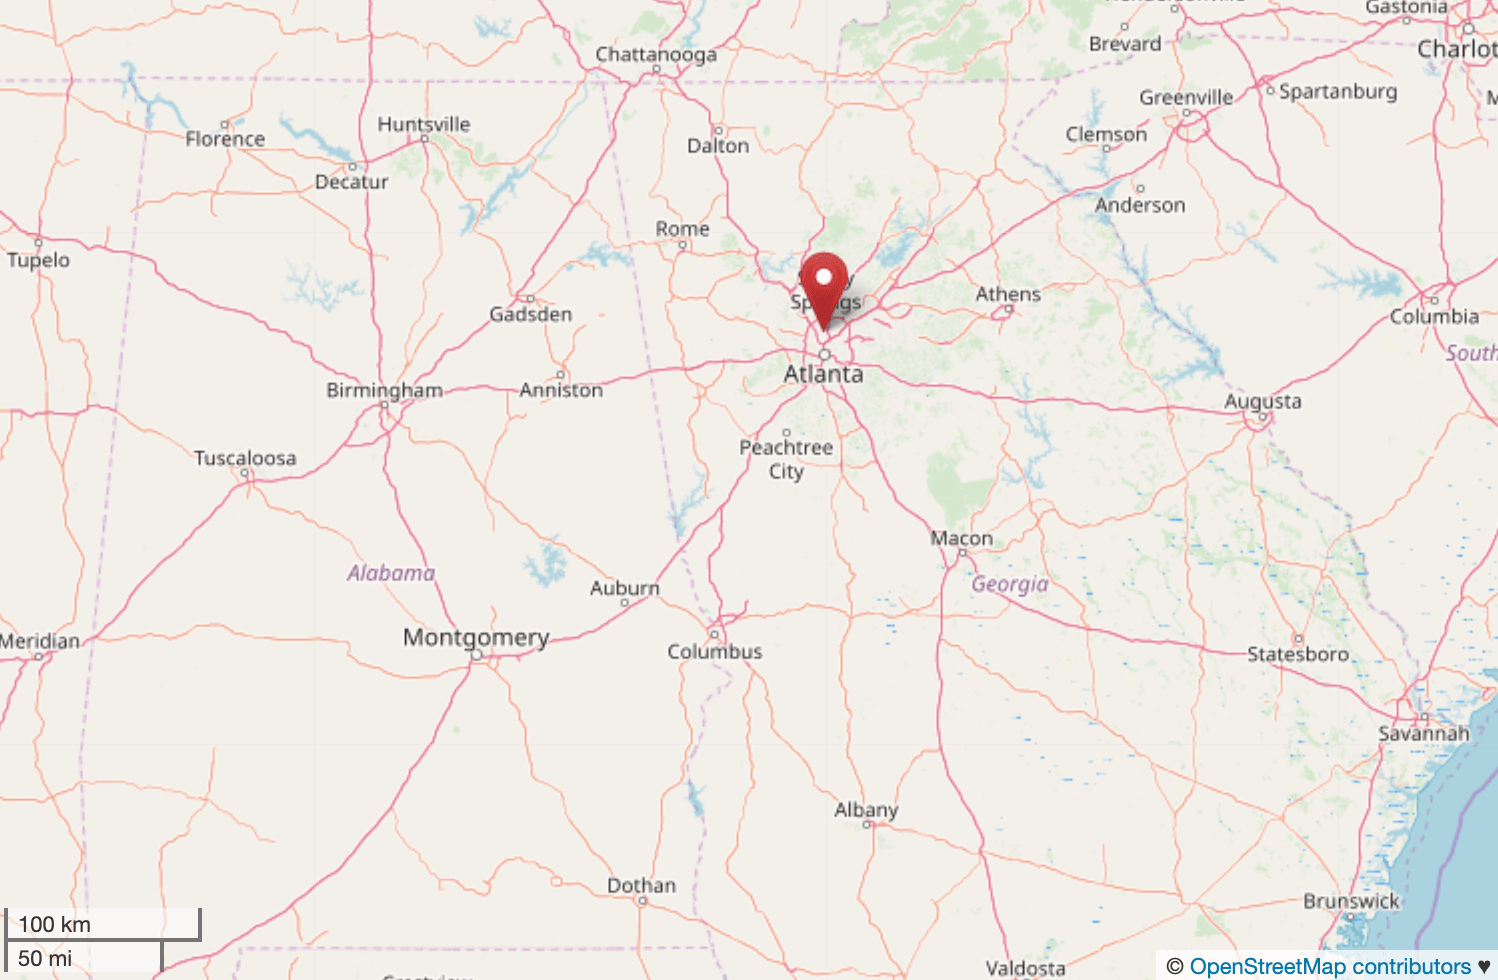
Georgia
- Most expensive neighborhood: Tuxedo Park
- City: Atlanta
- Metro: Atlanta-Sandy Springs-Roswell
- Median home value: $2,127,400
- Peak home value: $2,127,400 (2019-Q1)
- 1-year change in value: 5.6%
- 5-year change in value: 6.9%
- 10-year change in value: 3.6%
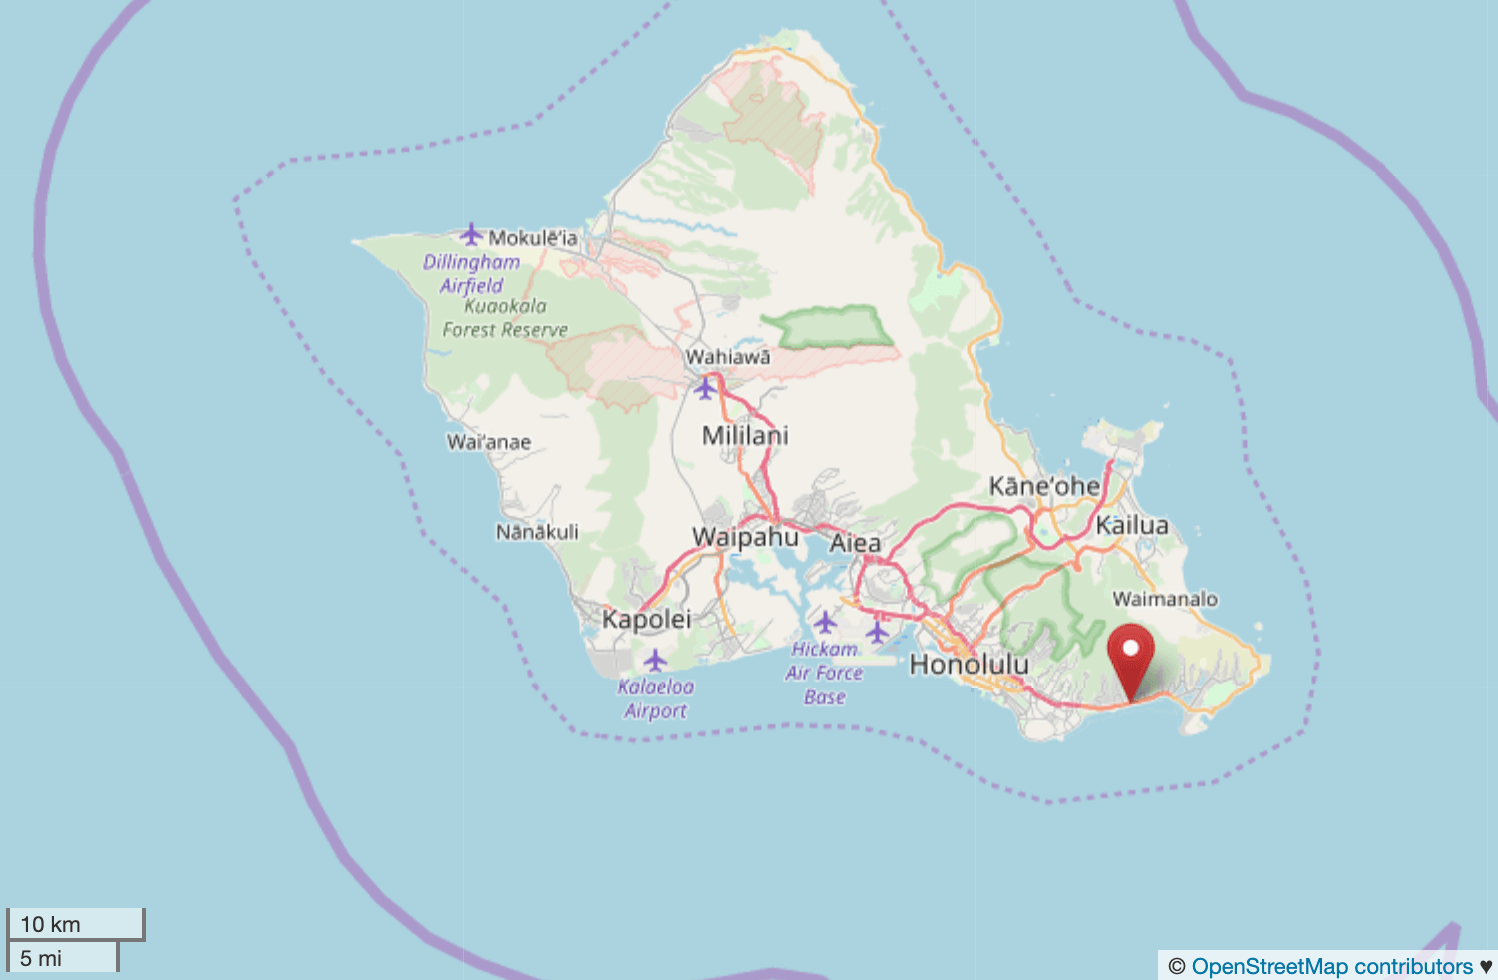
Hawaii
- Most expensive neighborhood: Kuliouou-Kalani Iki
- City: Honolulu
- Metro: Urban Honolulu
- Median home value: $1,439,200
- Peak home value: $1,443,200 (2019-Q1)
- 1-year change in value: 6.8%
- 5-year change in value: 5.6%
- 10-year change in value: 5.1%
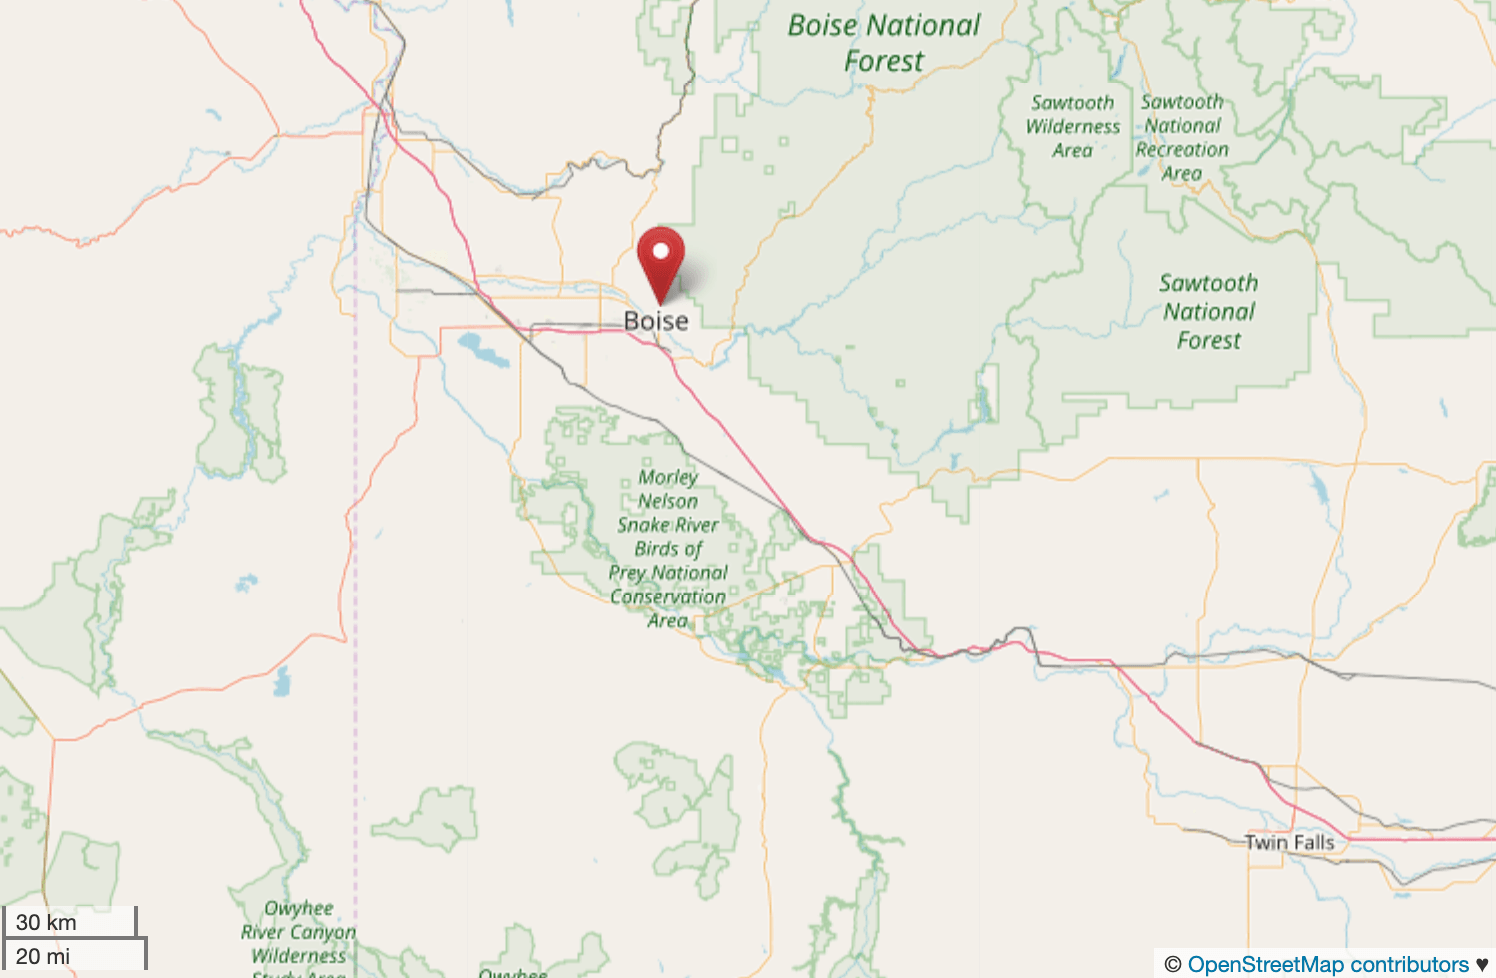
Idaho
- Most expensive neighborhood: Highlands
- City: Boise
- Metro: Boise City
- Median home value: $544,900
- Peak home value: $544,900 (2019-Q1)
- 1-year change in value: 12.4%
- 5-year change in value: 5.8%
- 10-year change in value: 2.6%
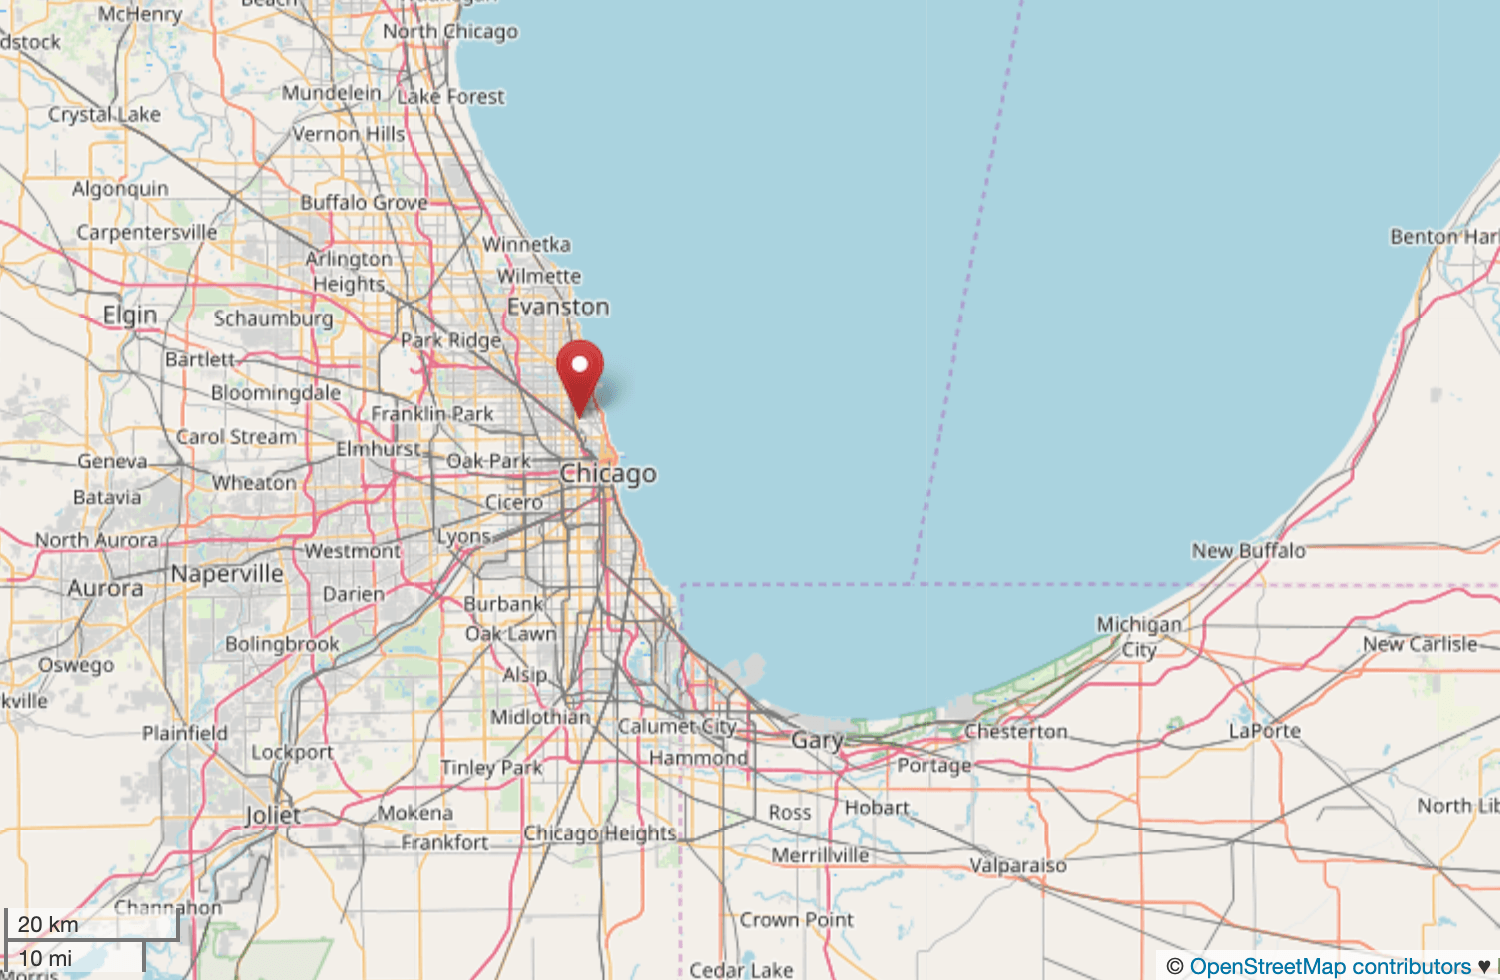
Illinois
- Most expensive neighborhood: West De Paul
- City: Chicago
- Metro: Chicago-Naperville-Elgin
- Median home value: $671,600
- Peak home value: $677,100 (2018-Q4)
- 1-year change in value: 1.1%
- 5-year change in value: 2.9%
- 10-year change in value: 2.3%
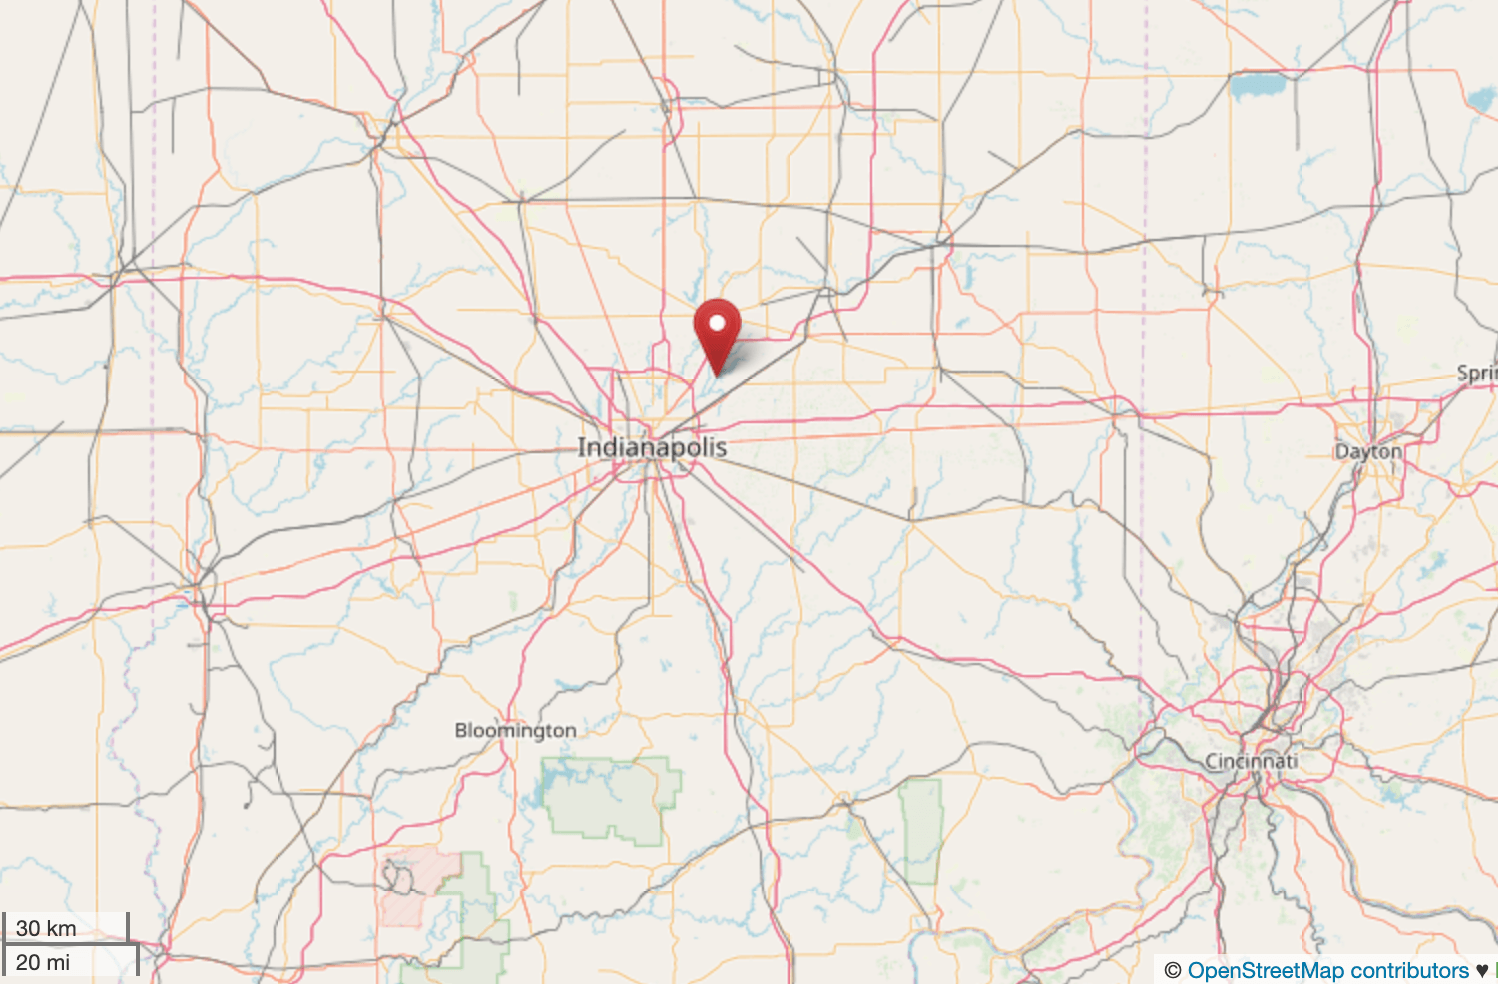
Indiana
- Most expensive neighborhood: Geist
- City: Indianapolis
- Metro: Indianapolis-Carmel-Anderson
- Median home value: $359,700
- Peak home value: $359,700 (2019-Q1)
- 1-year change in value: 9.7%
- 5-year change in value: 4.7%
- 10-year change in value: 1.8%
DID YOU KNOW?
An owner-controlled insurance program, OCIP insurance for short, is a type of construction insurance that combines many different policies. Learn more about owner-controlled insurance programs or about builders risk insurance (one of the most popular types of policies).
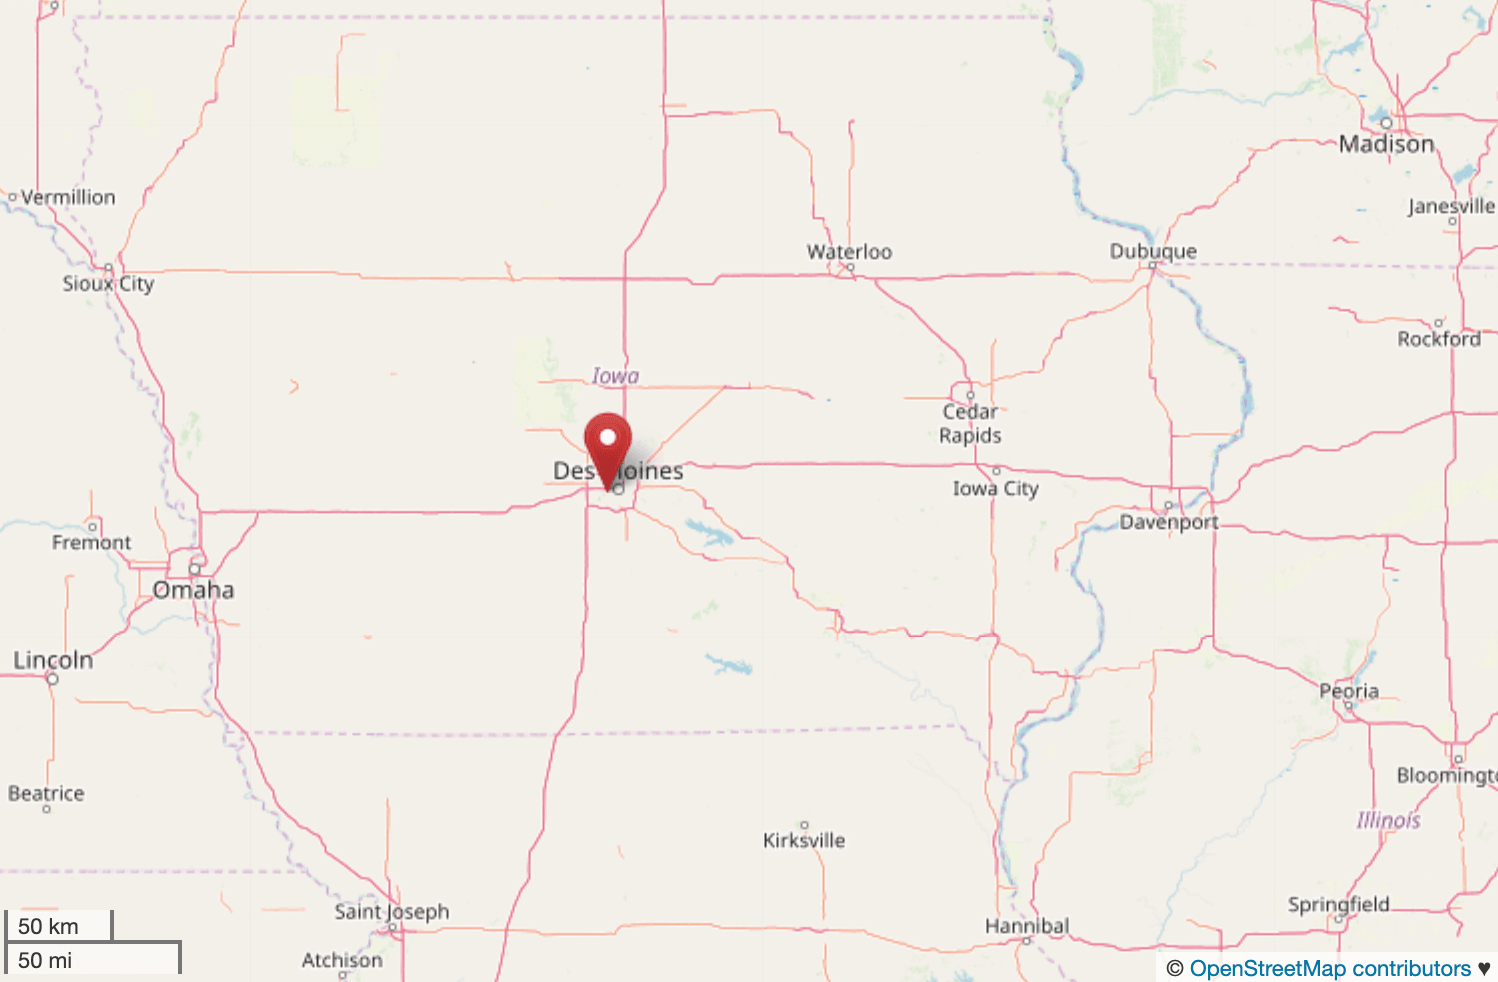
Iowa
- Most expensive neighborhood: Salisbury Oaks
- City: Des Moines
- Metro: Des Moines-West Des Moines
- Median home value: $342,000
- Peak home value: $342,000 (2019-Q1)
- 1-year change in value: 6.7%
- 5-year change in value: 7.0%
- 10-year change in value: 3.6%
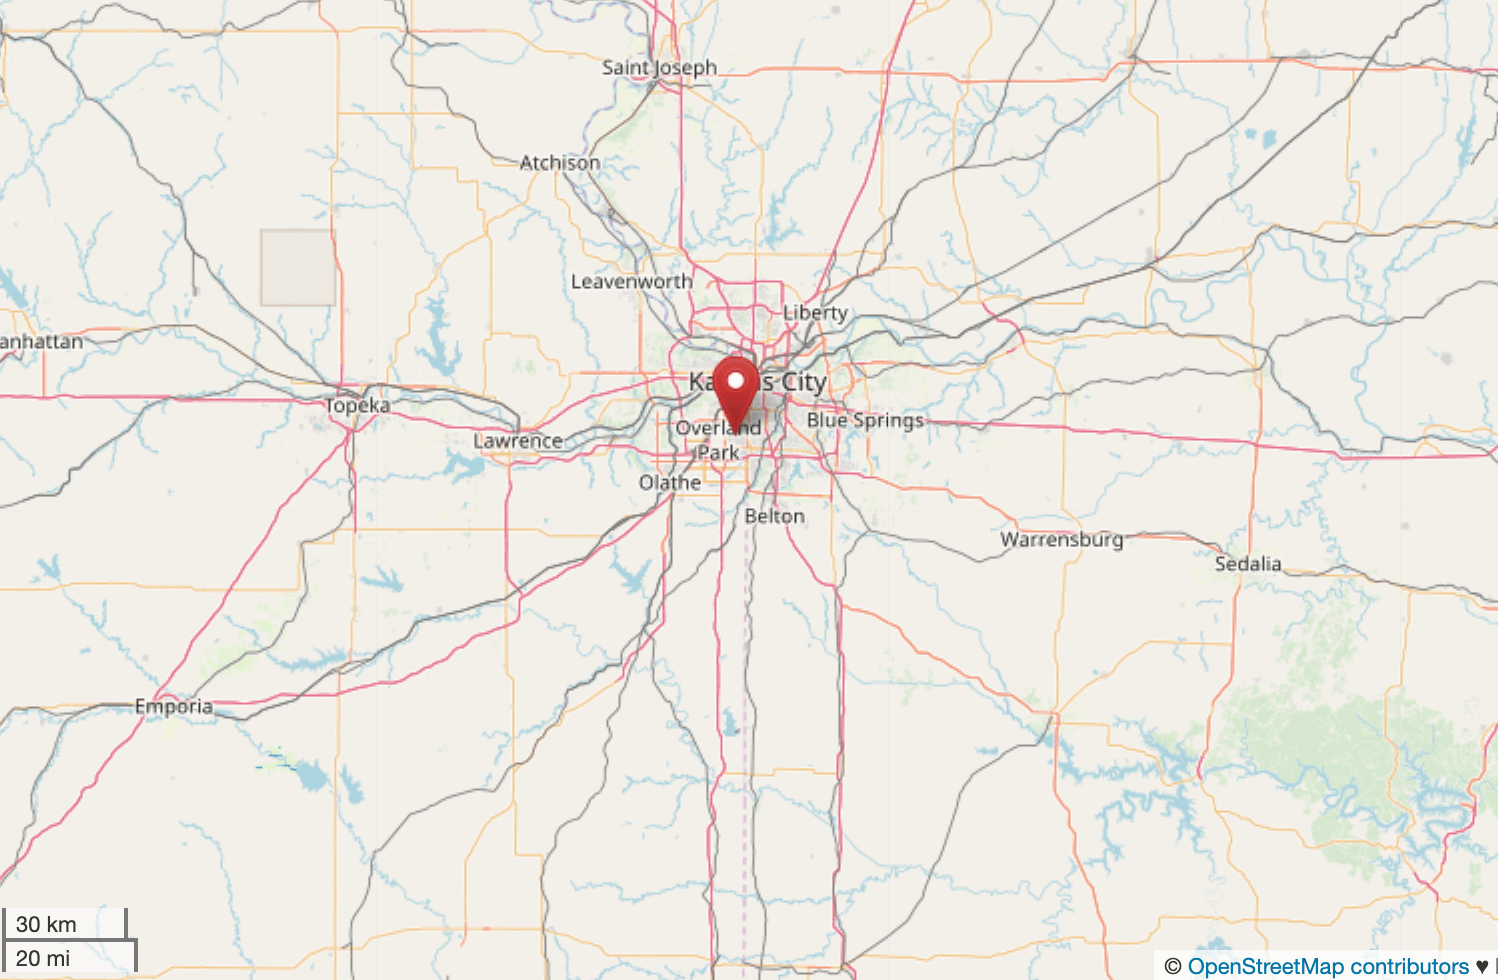
Kansas
- Most expensive neighborhood: Corinth Hills
- City: Prairie Village
- Metro: Kansas City
- Median home value: $448,700
- Peak home value: $451,500 (2018-Q4)
- 1-year change in value: 5.1%
- 5-year change in value: 10.1%
- 10-year change in value: 5.4%
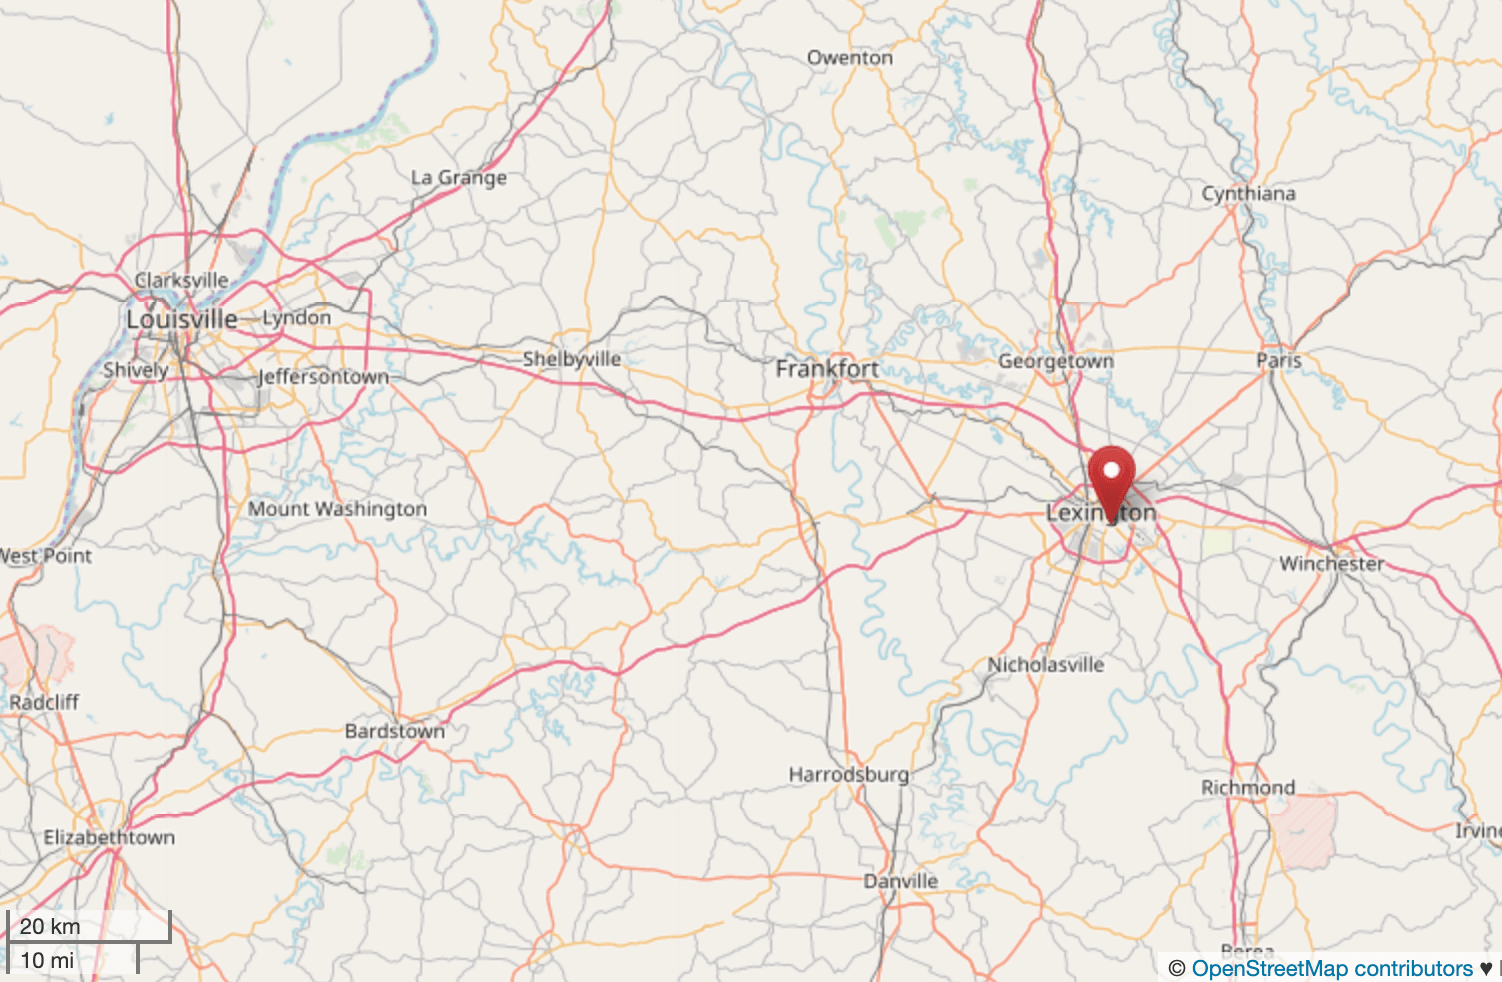
Kentucky
- Most expensive neighborhood: Chevy Chase-Ashland Park
- City: Lexington
- Metro: Lexington-Fayette
- Median home value: $509,100
- Peak home value: $509,100 (2019-Q1)
- 1-year change in value: 7.8%
- 5-year change in value: 8.0%
- 10-year change in value: 3.8%
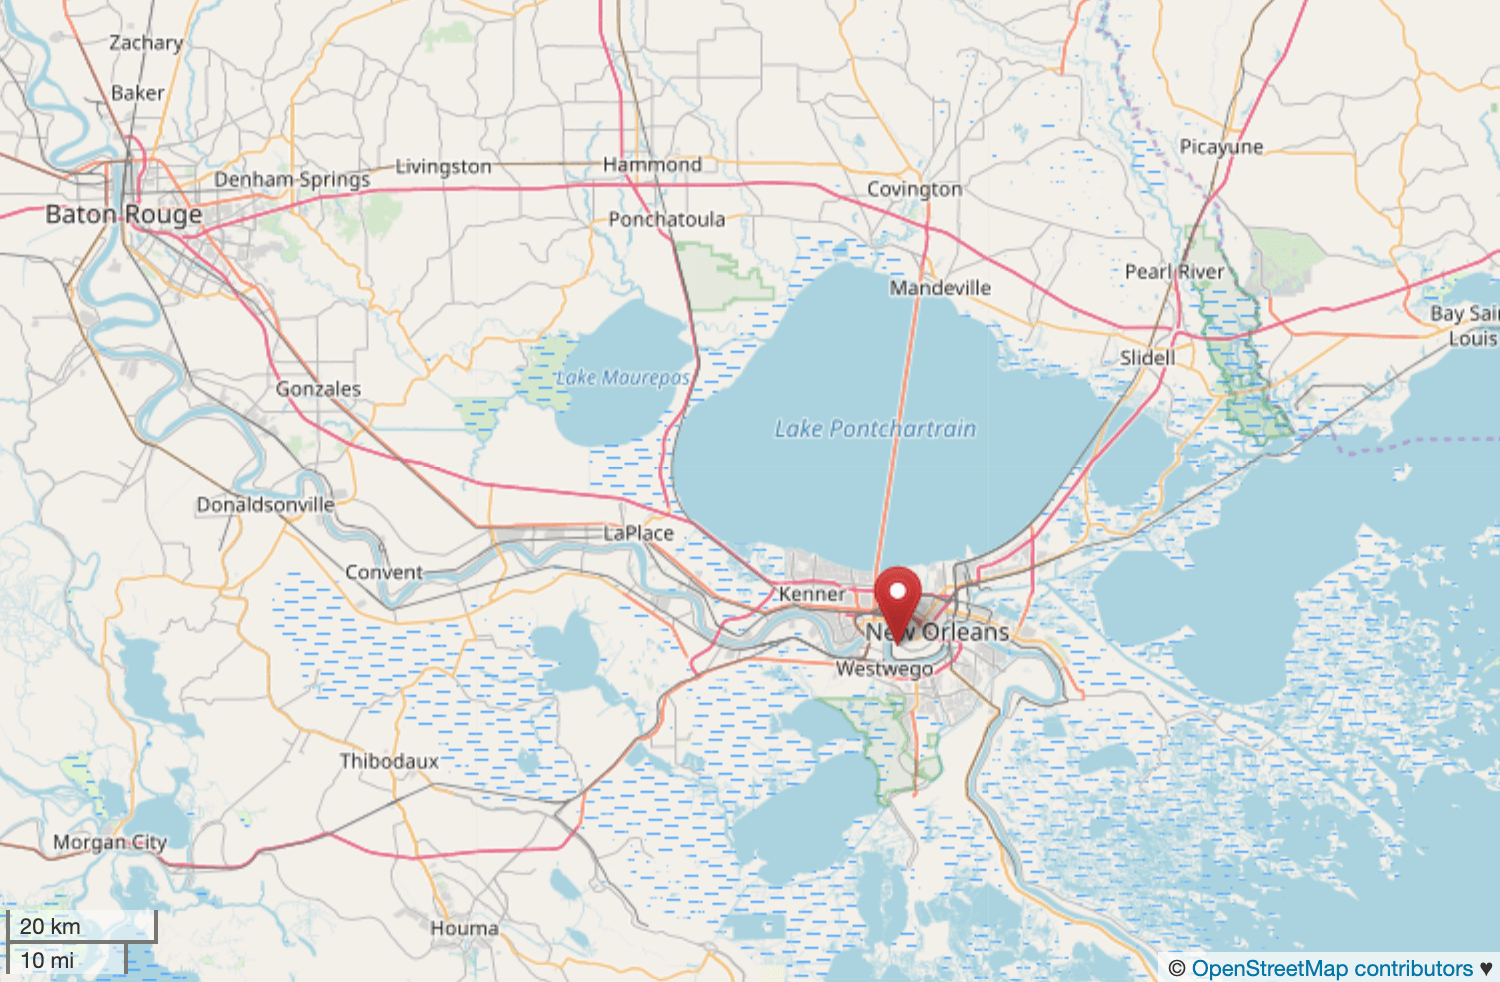
Louisiana
- Most expensive neighborhood: Audubon
- City: New Orleans
- Metro: New Orleans-Metairie
- Median home value: $830,000
- Peak home value: $928,600 (2018-Q2)
- 1-year change in value: -8.8%
- 5-year change in value: 7.1%
- 10-year change in value: 3.5%
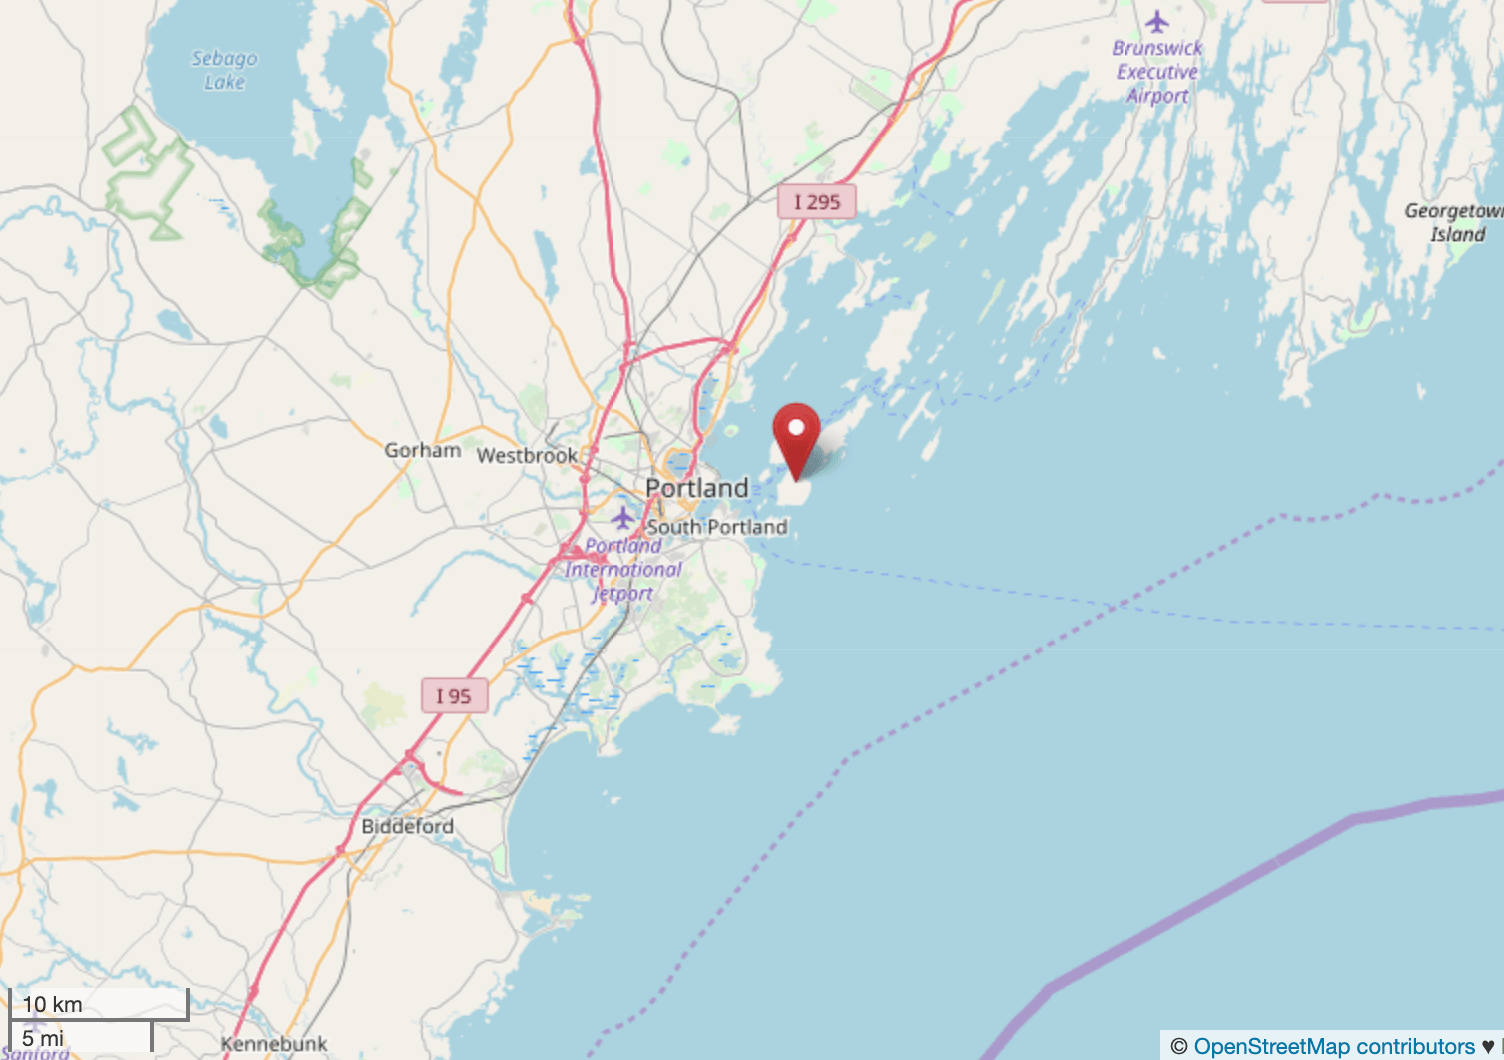
Maine
- Most expensive neighborhood: Peaks Island
- City: Portland
- Metro: Portland-South Portland
- Median home value: $459,500
- Peak home value: $461,000 (2019-Q1)
- 1-year change in value: 14.7%
- 5-year change in value: 8.5%
- 10-year change in value: 4.4%
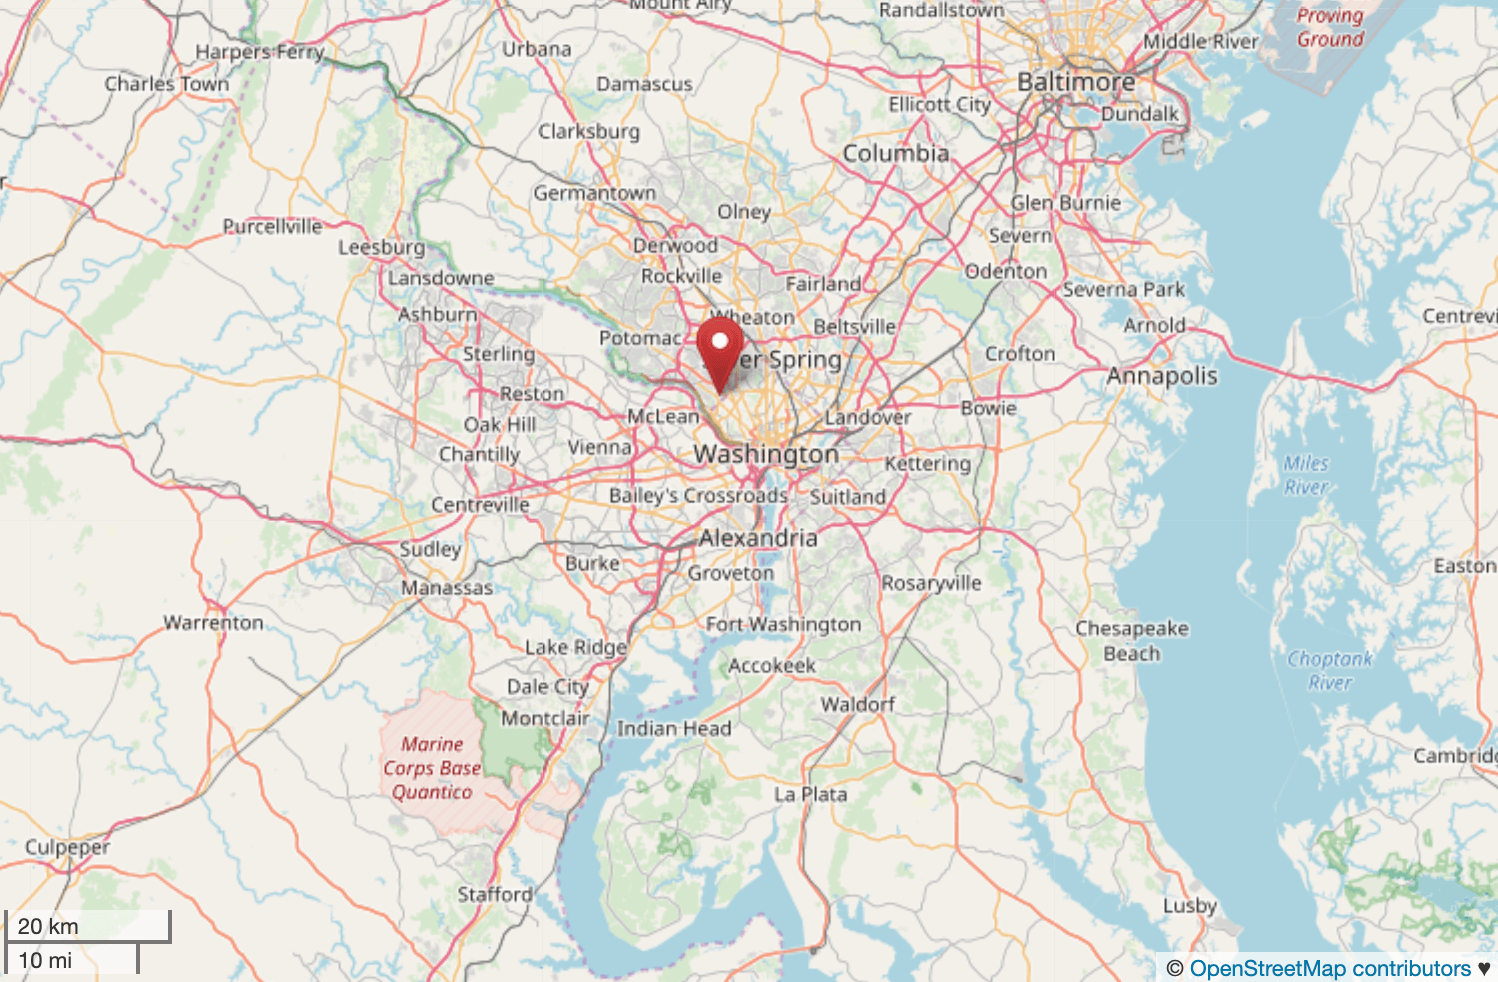
Maryland
- Most expensive neighborhood: Westgate
- City: Bethesda
- Metro: Washington-Arlington-Alexandria
- Median home value: $1,078,100
- Peak home value: $1,078,100 (2019-Q1)
- 1-year change in value: 2.4%
- 5-year change in value: 3.4%
- 10-year change in value: 2.9%
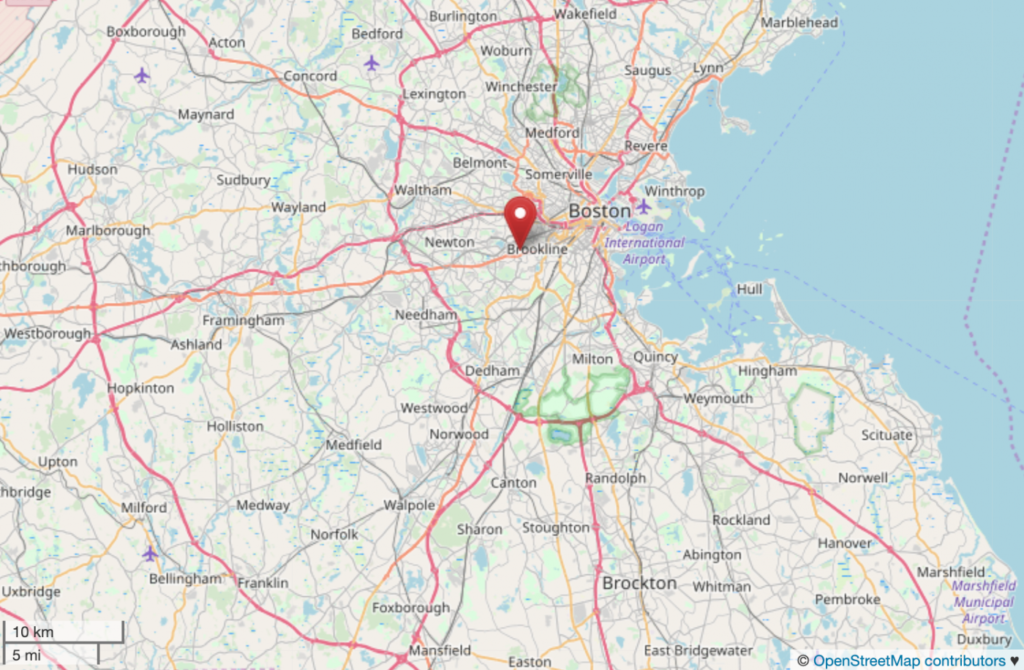
Massachusetts
- Most expensive neighborhood: Fisher Hill
- City: Brookline
- Metro: Boston-Cambridge-Newton
- Median home value: $2,296,600
- Peak home value: $2,296,600 (2019-Q1)
- 1-year change in value: 2.6%
- 5-year change in value: 5.4%
- 10-year change in value: 5.4%
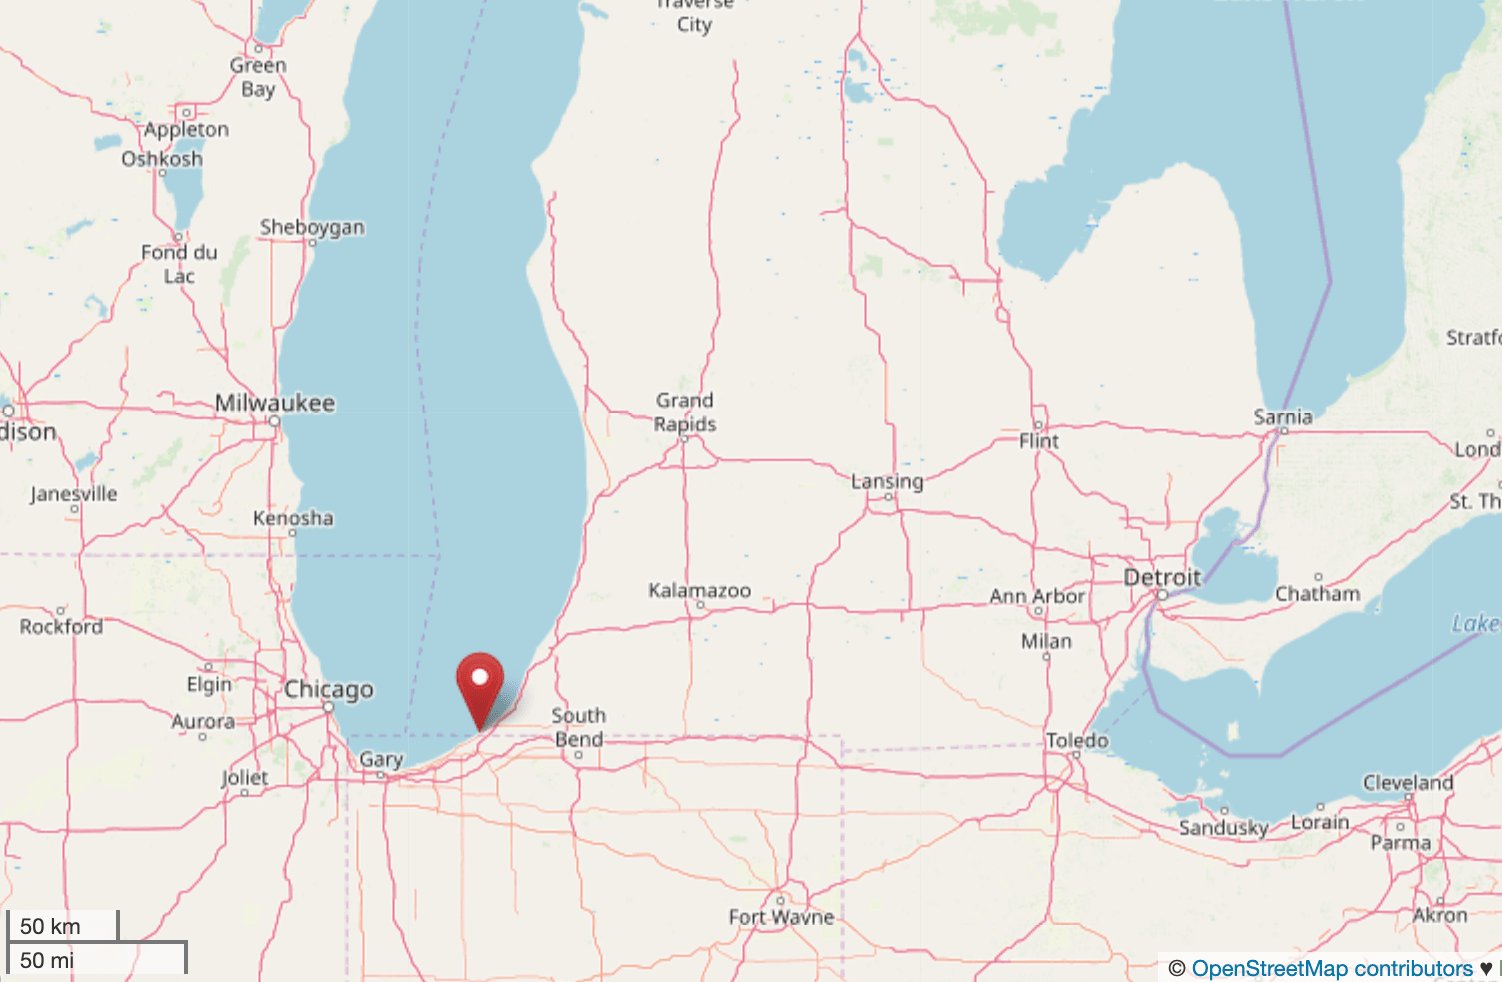
Michigan
- Most expensive neighborhood: Grand Beach
- City: New Buffalo
- Metro: Niles-Benton Harbor
- Median home value: $533,400
- Peak home value: $659,200 (2007-Q4)
- 1-year change in value: 10.0%
- 5-year change in value: 5.8%
- 10-year change in value: -0.4%
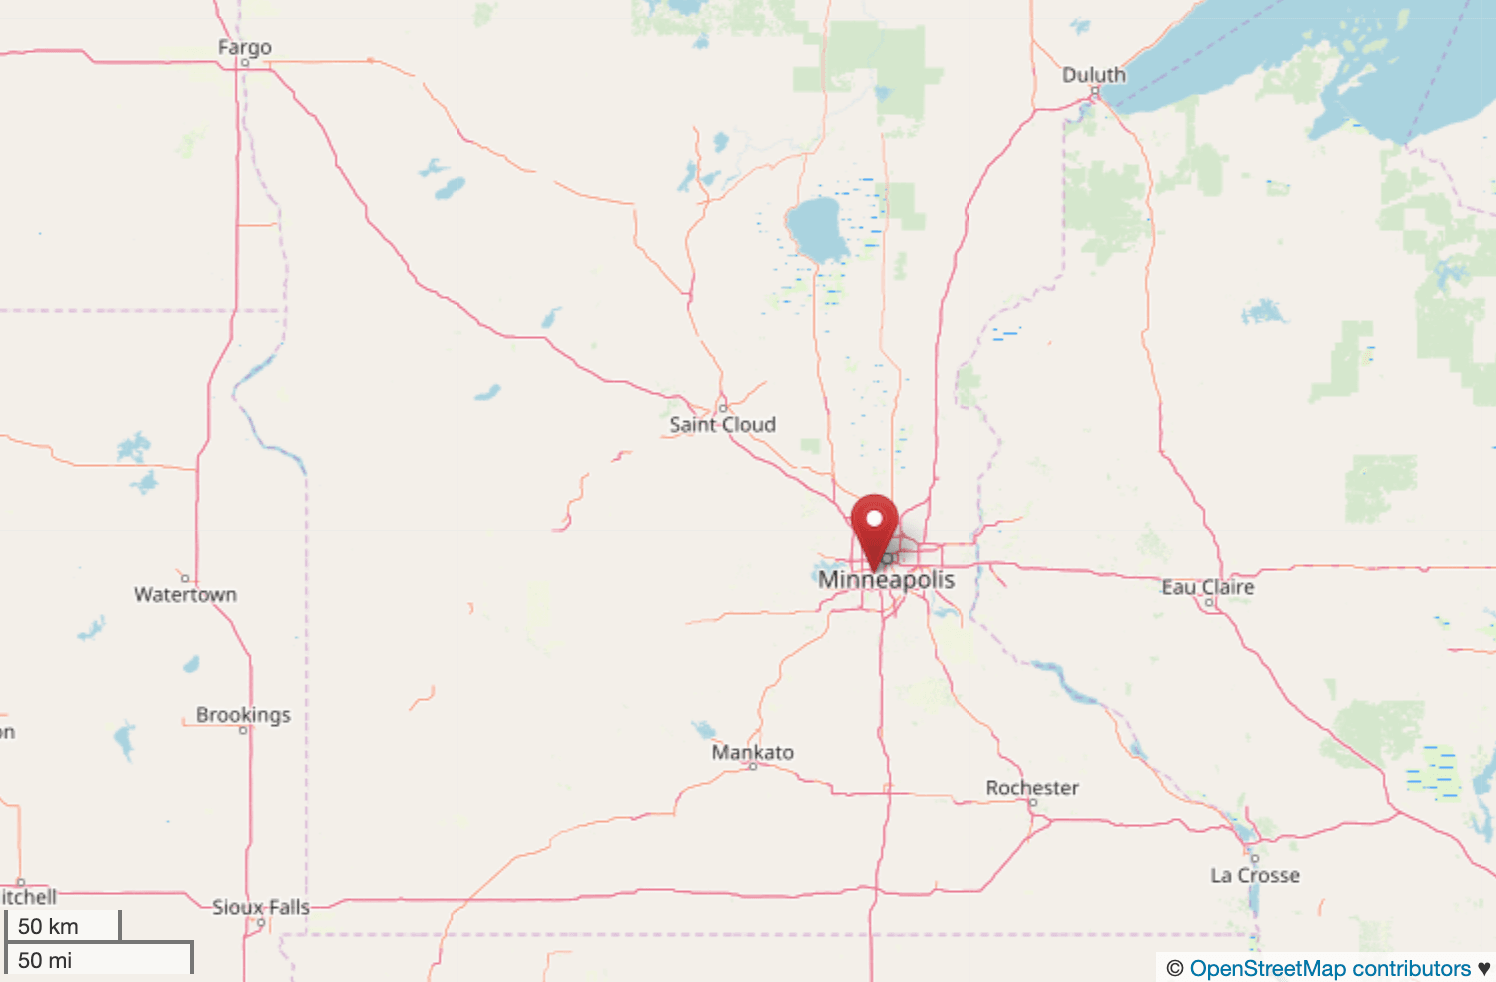
Minnesota
- Most expensive neighborhood: Country Club
- City: Edina
- Metro: Minneapolis-St. Paul-Bloomington
- Median home value: $1,084,100
- Peak home value: $1,084,100 (2019-Q1)
- 1-year change in value: 3.8%
- 5-year change in value: 1.7%
- 10-year change in value: 1.9%
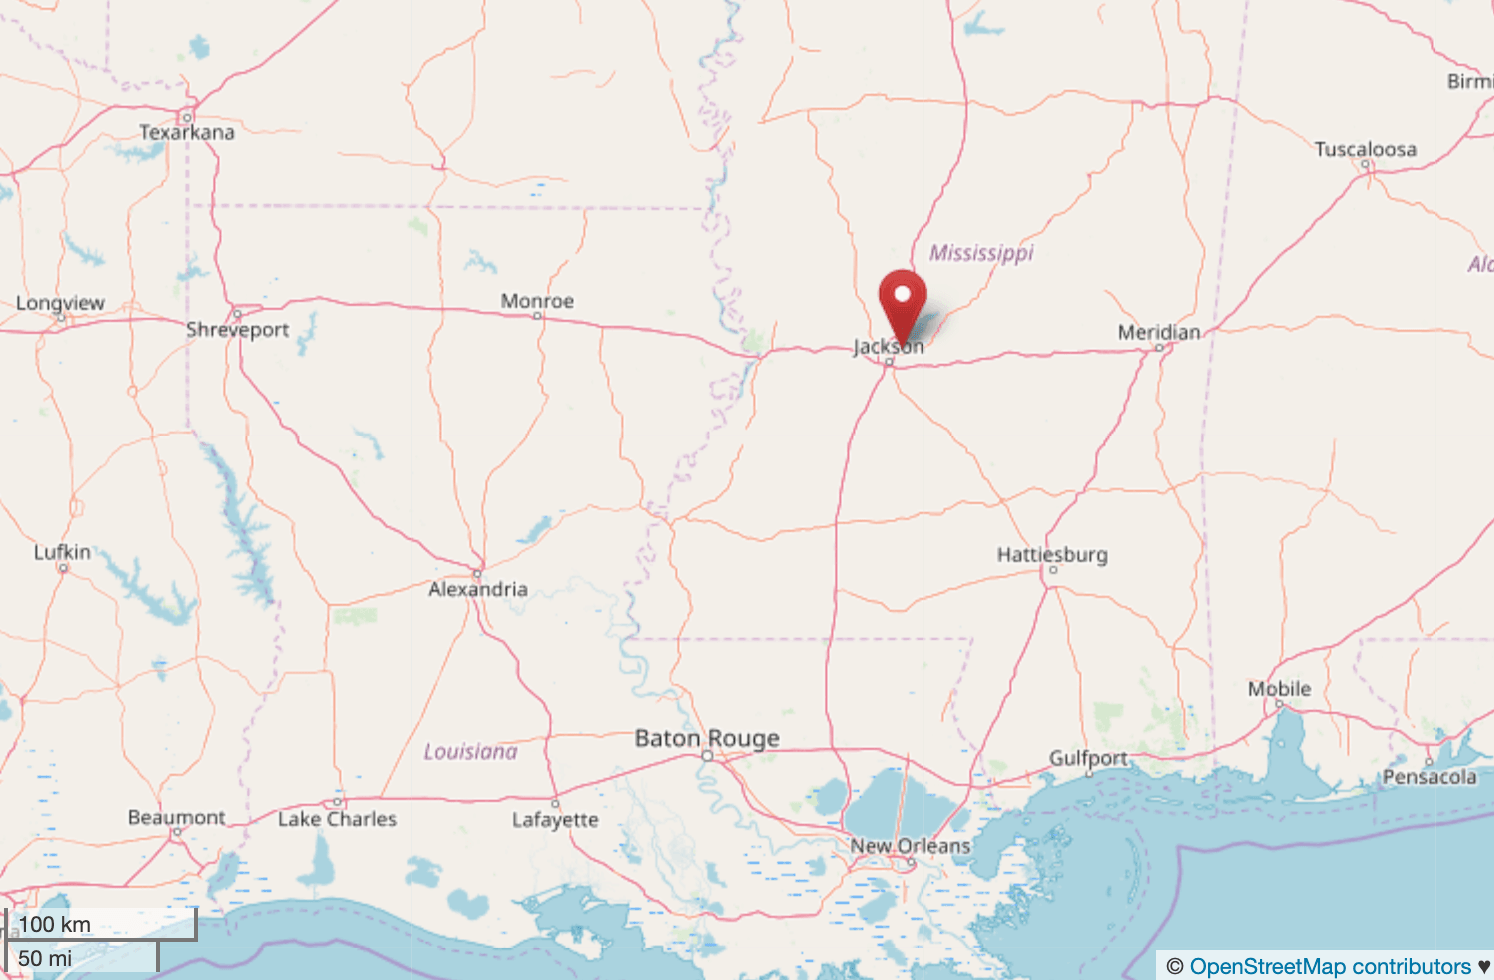
Mississippi
- Most expensive neighborhood: Sherwood-Audubon Area
- City: Jackson
- Metro: Jackson
- Median home value: $288,200
- Peak home value: $288,200 (2019-Q1)
- 1-year change in value: 18.9%
- 5-year change in value: 8.0%
- 10-year change in value: 5.6%
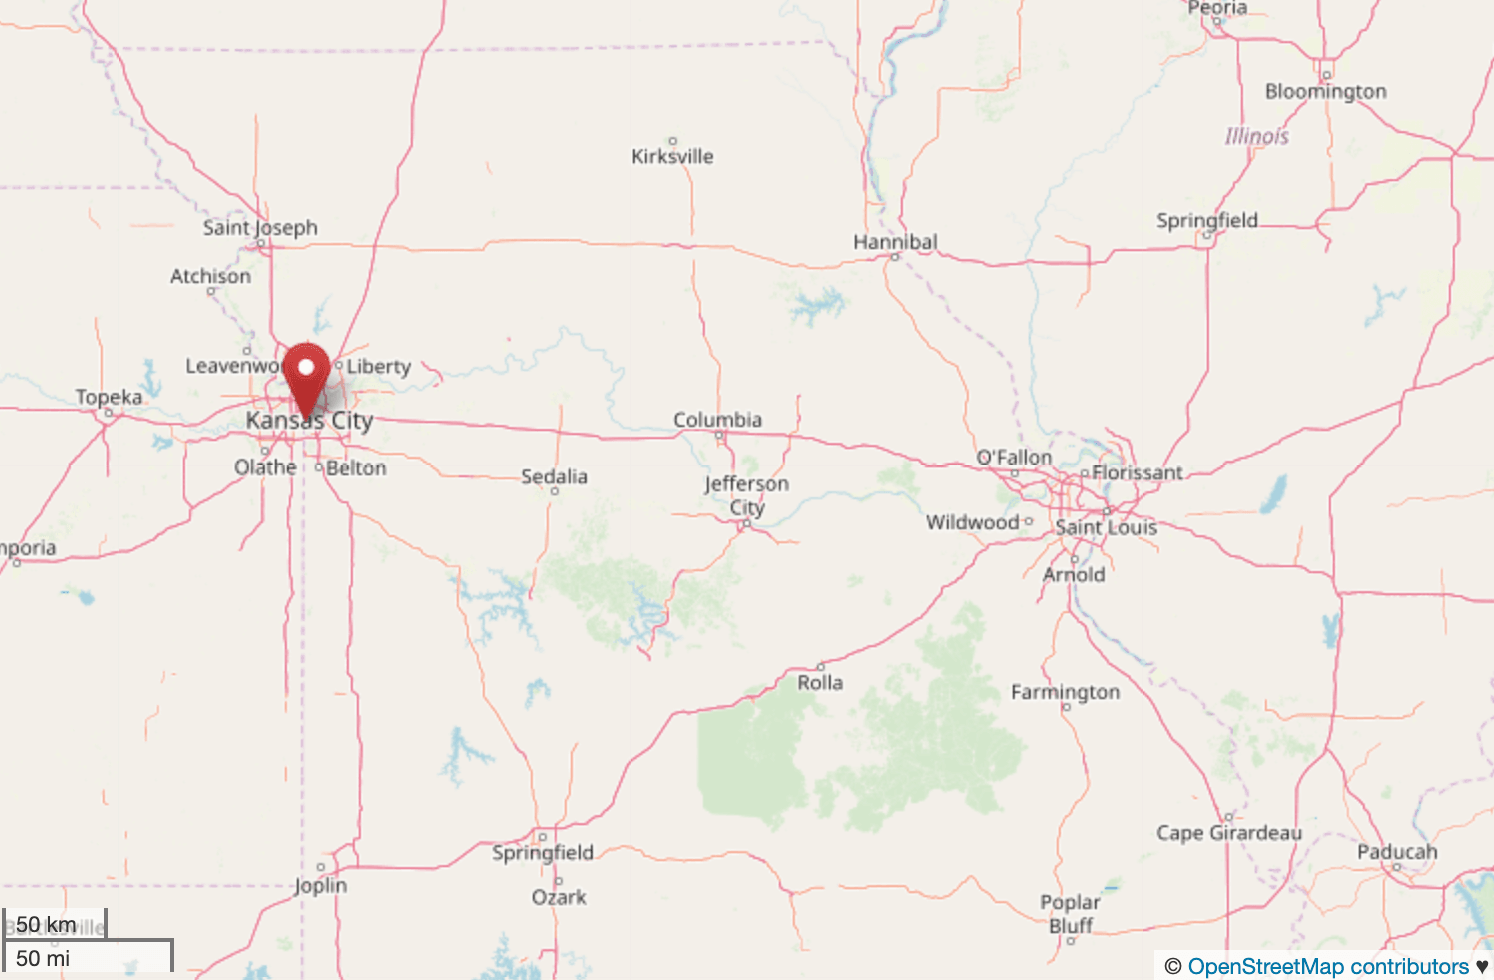
Missouri
- Most expensive neighborhood: Armour Fields
- City: Kansas City
- Metro: Kansas City
- Median home value: $544,900
- Peak home value: $544,900 (2019-Q1)
- 1-year change in value: 5.1%
- 5-year change in value: 3.3%
- 10-year change in value: 2.5%
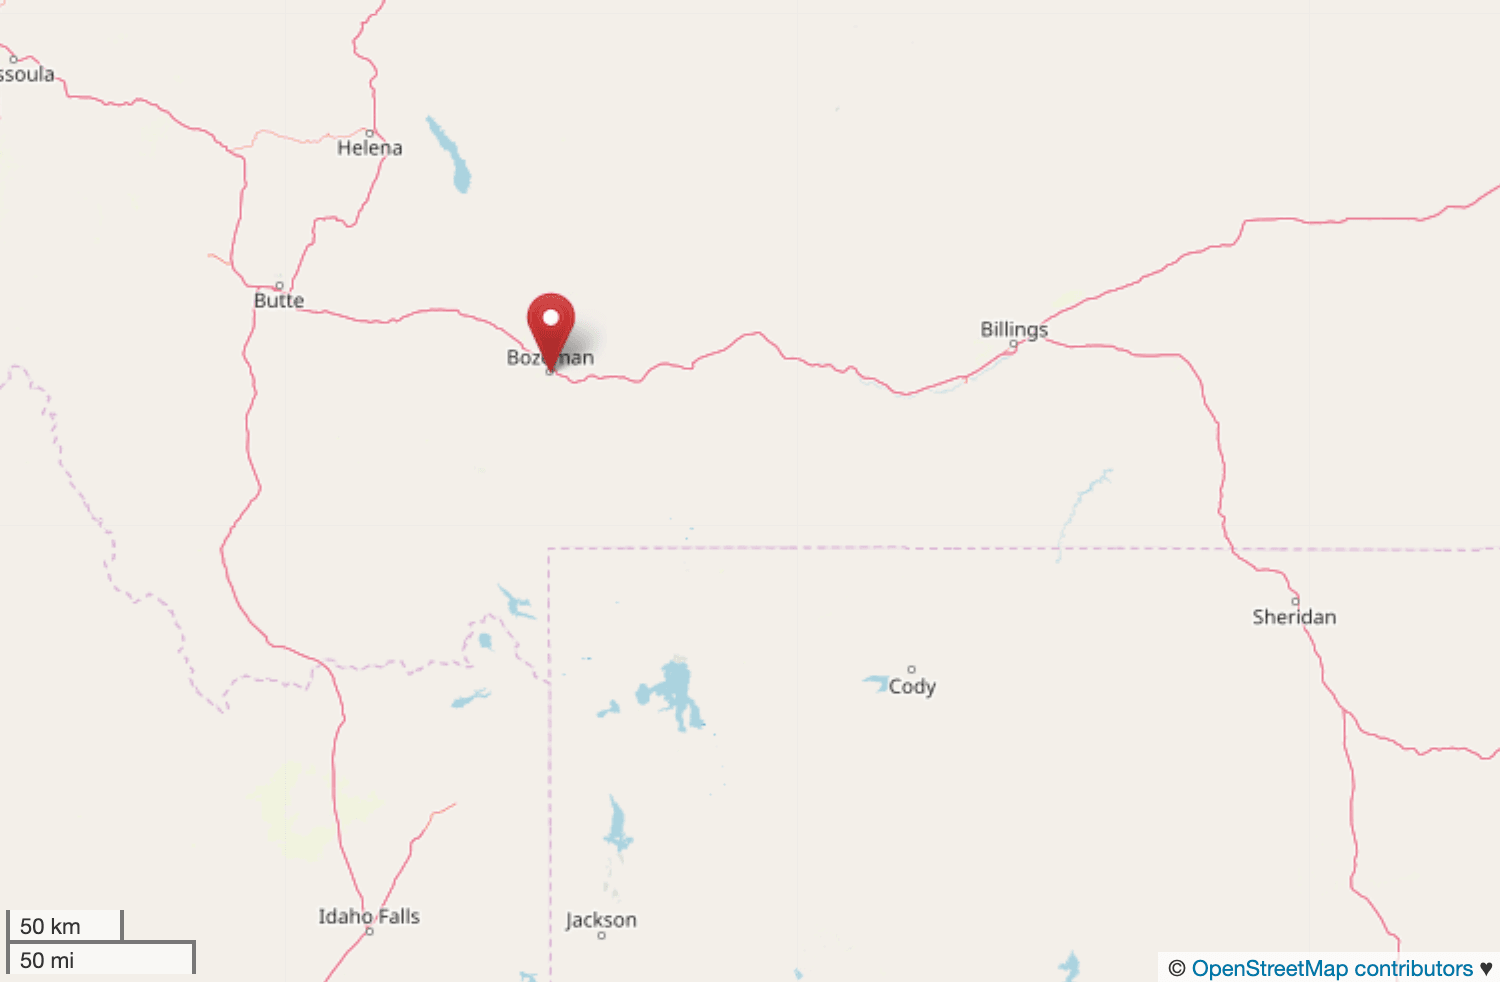
Montana
- Most expensive neighborhood: Cooper Park
- City: Bozeman
- Metro: Bozeman
- Median home value: $529,400
- Peak home value: $529,400 (2019-Q1)
- 1-year change in value: 17.0%
- 5-year change in value: 11.5%
- 10-year change in value: 4.4%
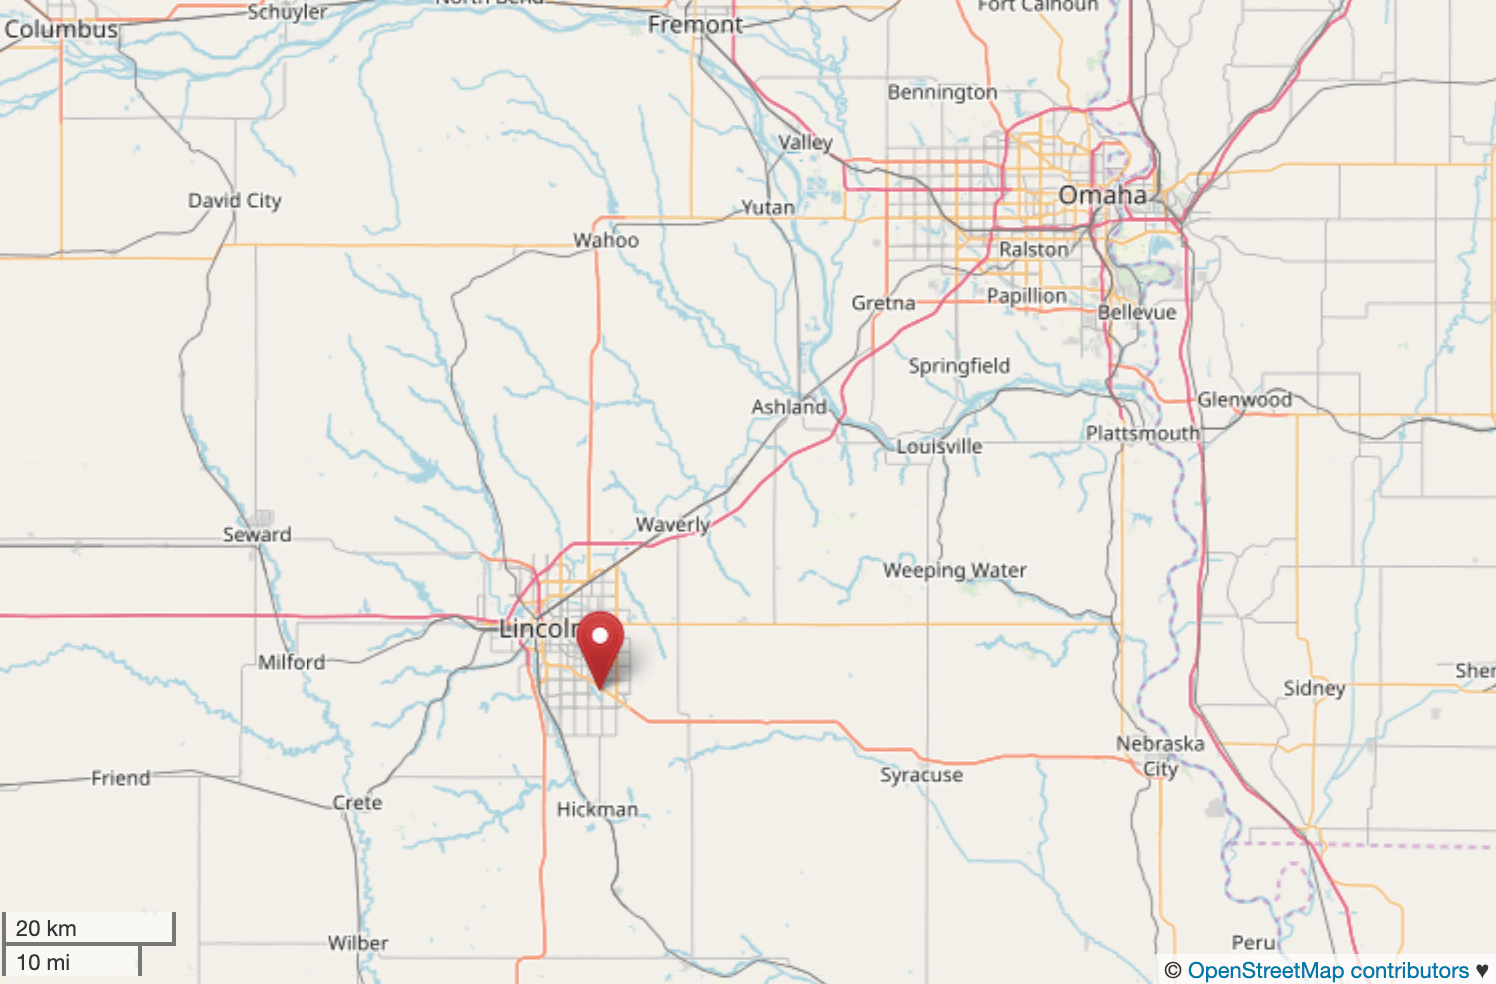
Nebraska
- Most expensive neighborhood: Family Acres
- City: Lincoln
- Metro: Lincoln
- Median home value: $294,200
- Peak home value: $294,200 (2019-Q1)
- 1-year change in value: 5.7%
- 5-year change in value: 5.0%
- 10-year change in value: 3.5%
TRENDING ON CONSTRUCTION COVERAGE
Do you have insurance for your construction vehicles? BiBerk, Nationwide, and Progressive offer some of the best commercial auto insurance policies on the market. If you are looking to insure a truck, make sure to review our complete guide to commercial truck insurance.
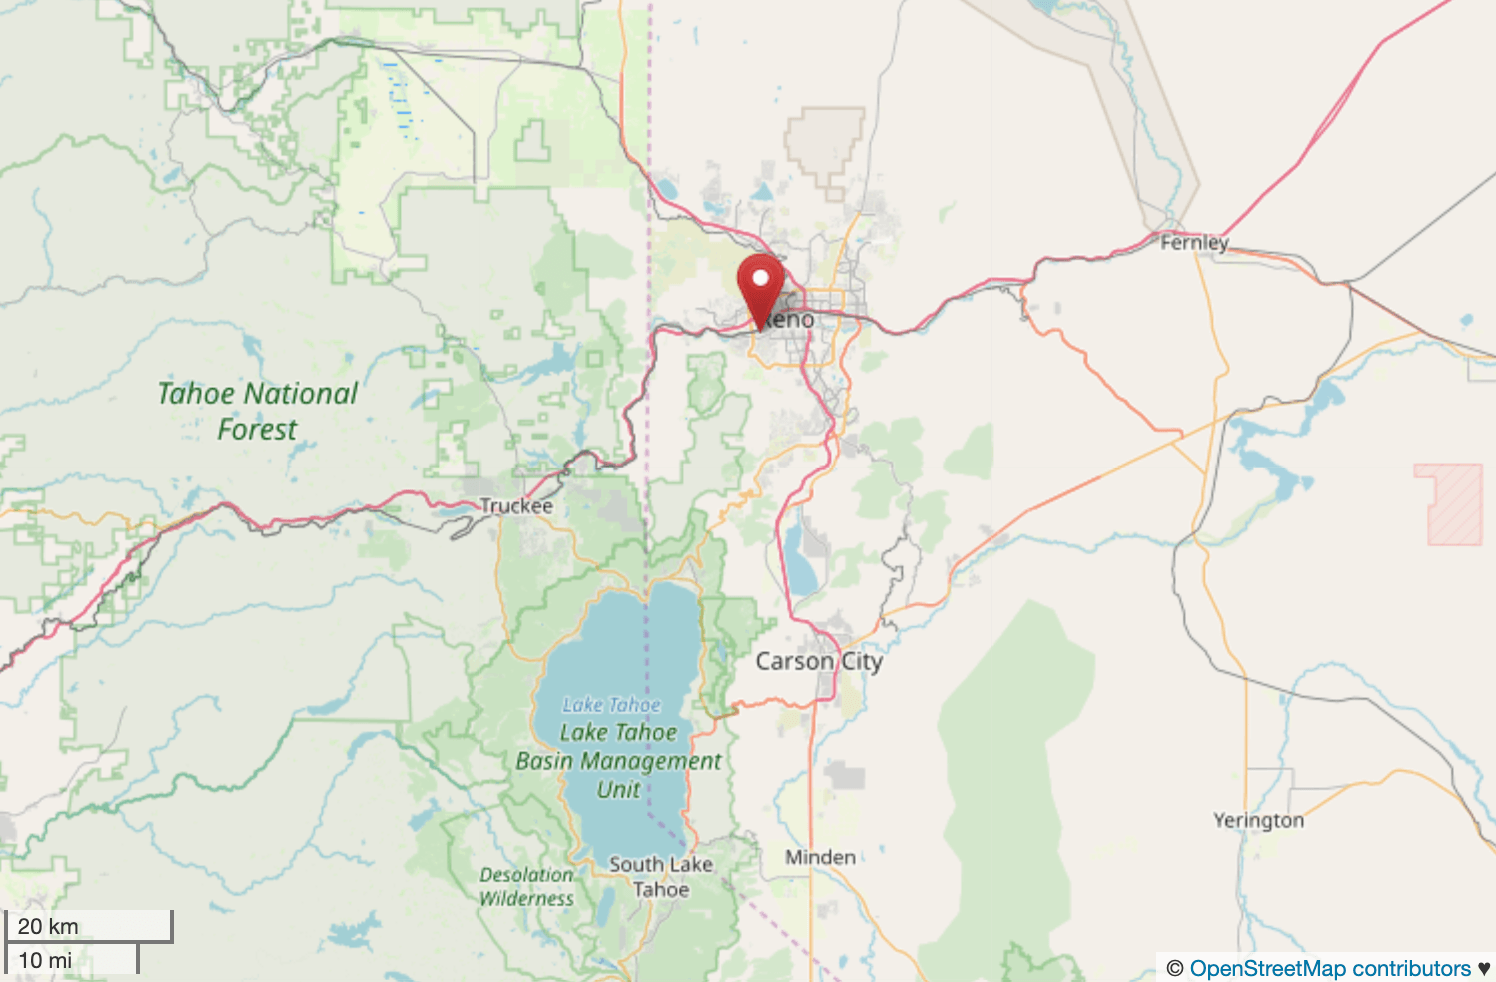
Nevada
- Most expensive neighborhood: Southwest
- City: Reno
- Metro: Reno
- Median home value: $476,000
- Peak home value: $476,000 (2019-Q1)
- 1-year change in value: 7.0%
- 5-year change in value: 10.1%
- 10-year change in value: 4.8%
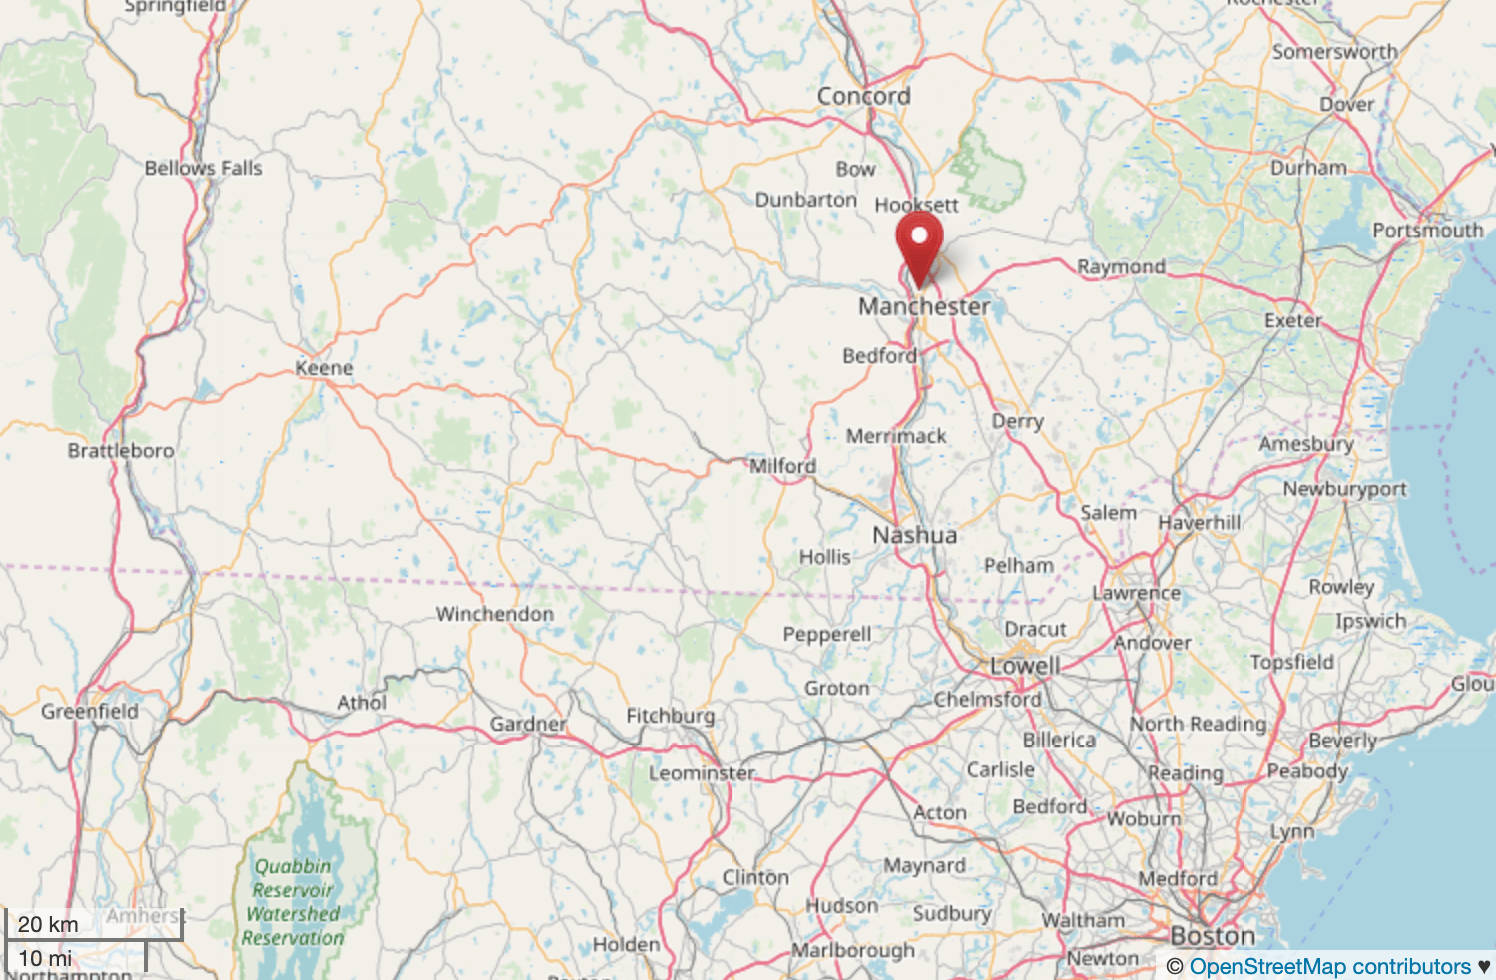
New Hampshire
- Most expensive neighborhood: North End
- City: Manchester
- Metro: Manchester-Nashua
- Median home value: $313,700
- Peak home value: $313,700 (2019-Q1)
- 1-year change in value: 9.2%
- 5-year change in value: 5.1%
- 10-year change in value: 2.2%
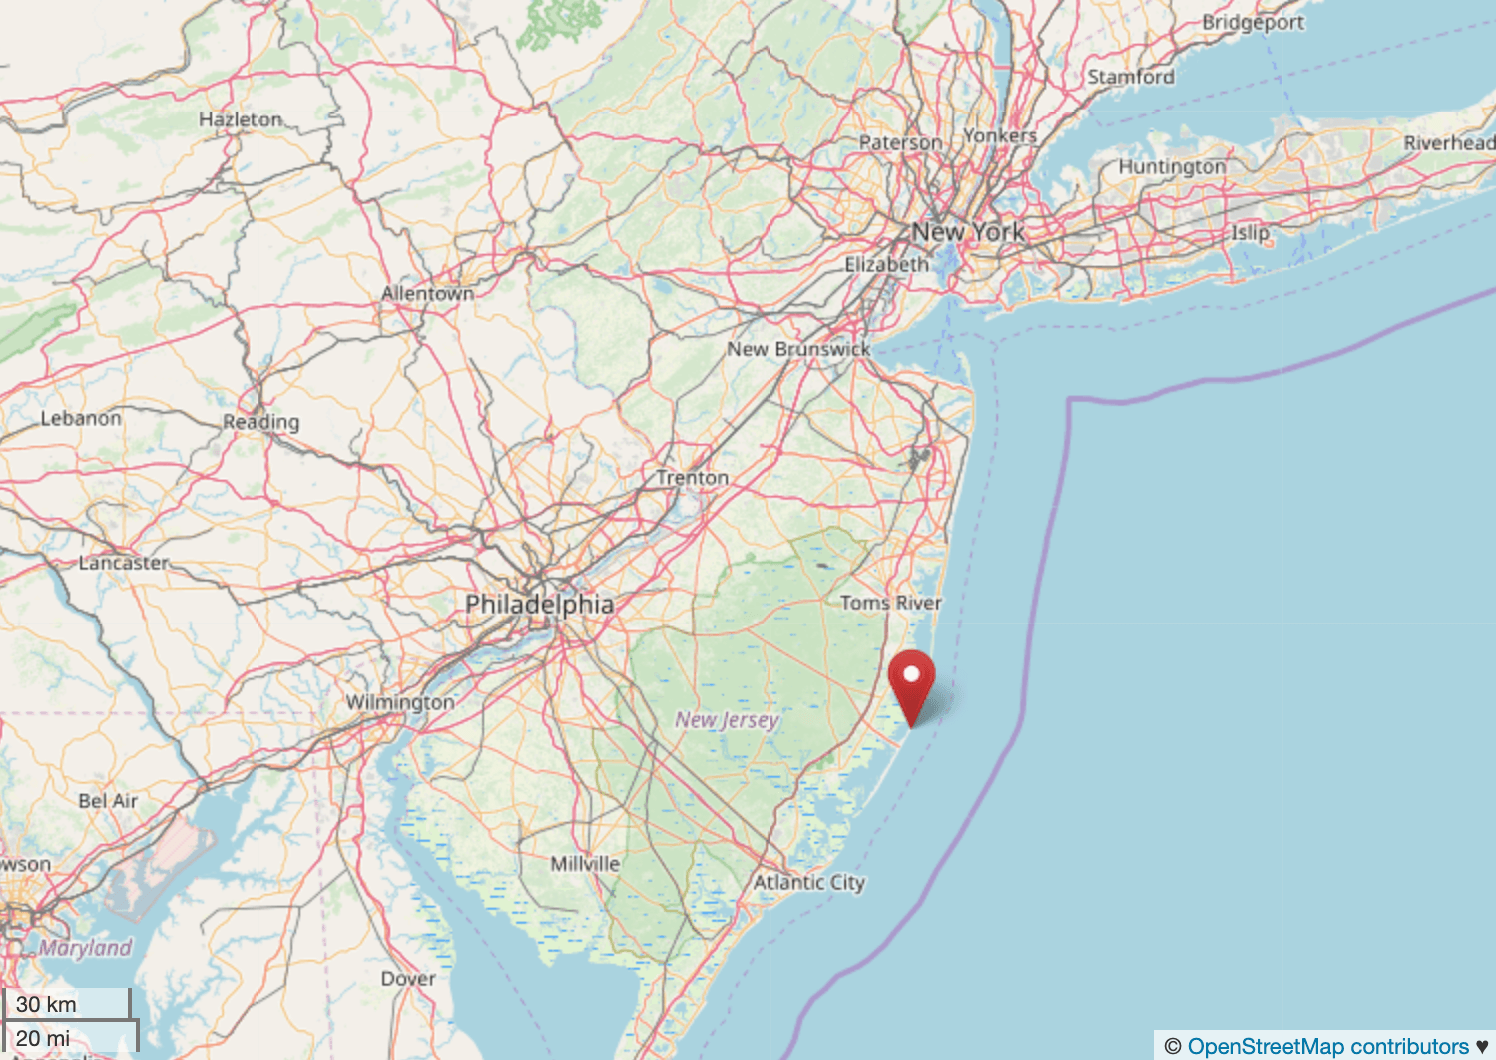
New Jersey
- Most expensive neighborhood: North Beach
- City: Long Beach
- Metro: New York-Newark-Jersey City
- Median home value: $1,159,800
- Peak home value: $1,267,600 (2006-Q4)
- 1-year change in value: 0.6%
- 5-year change in value: 2.5%
- 10-year change in value: 0.4%
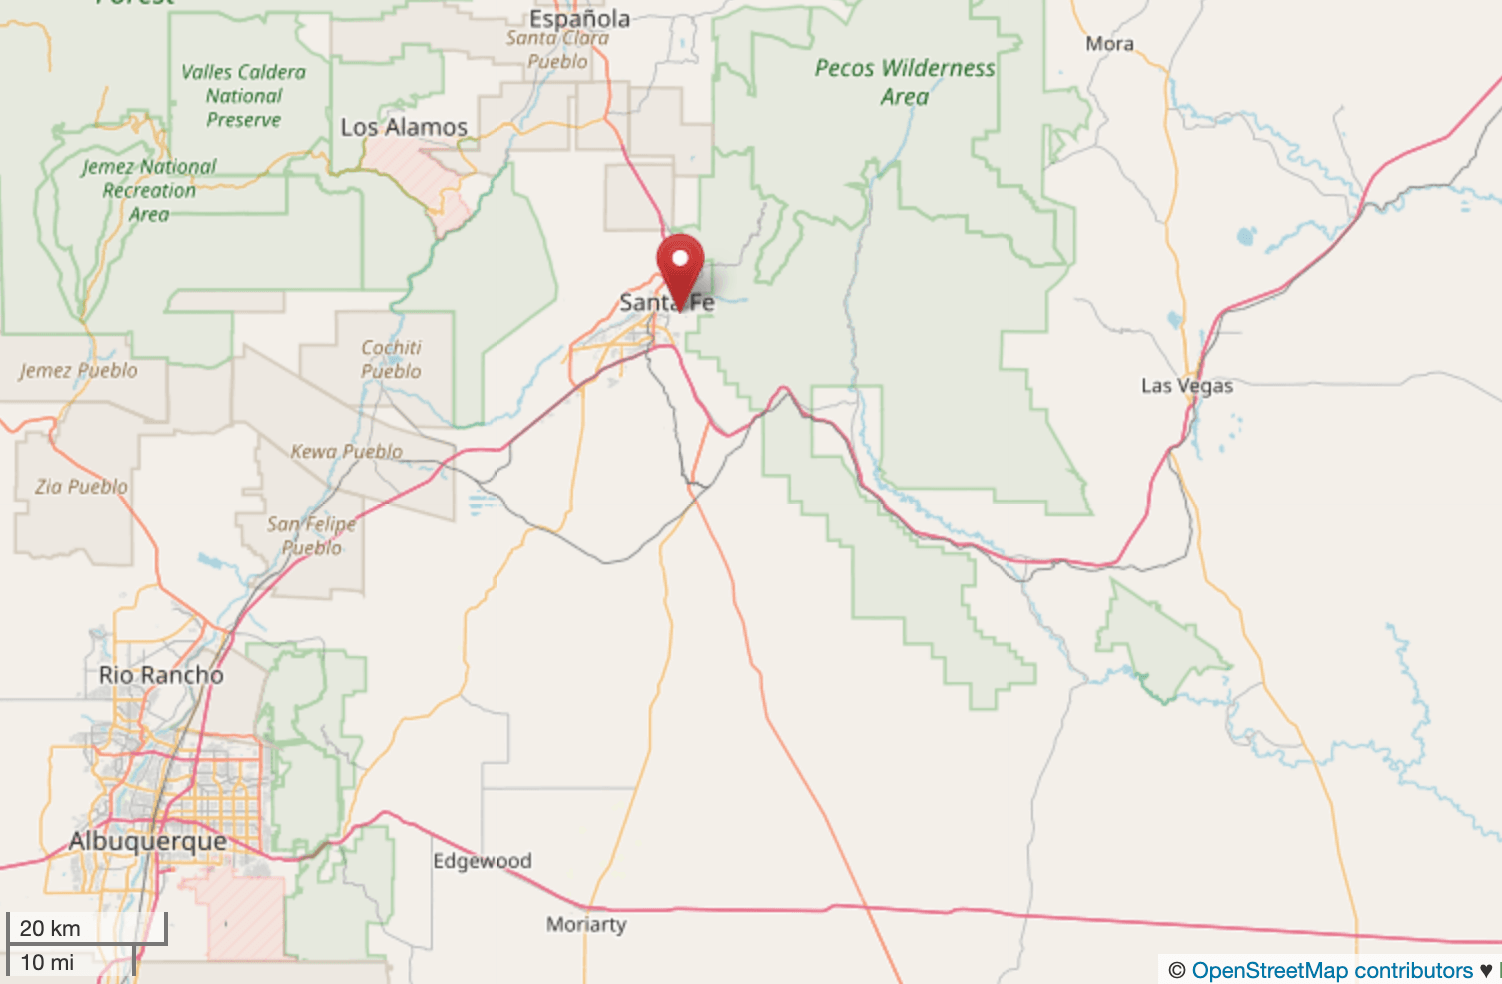
New Mexico
- Most expensive neighborhood: San Acacio
- City: Santa Fe
- Metro: Santa Fe
- Median home value: $778,000
- Peak home value: $801,300 (2006-Q4)
- 1-year change in value: 22.6%
- 5-year change in value: 6.8%
- 10-year change in value: 1.2%
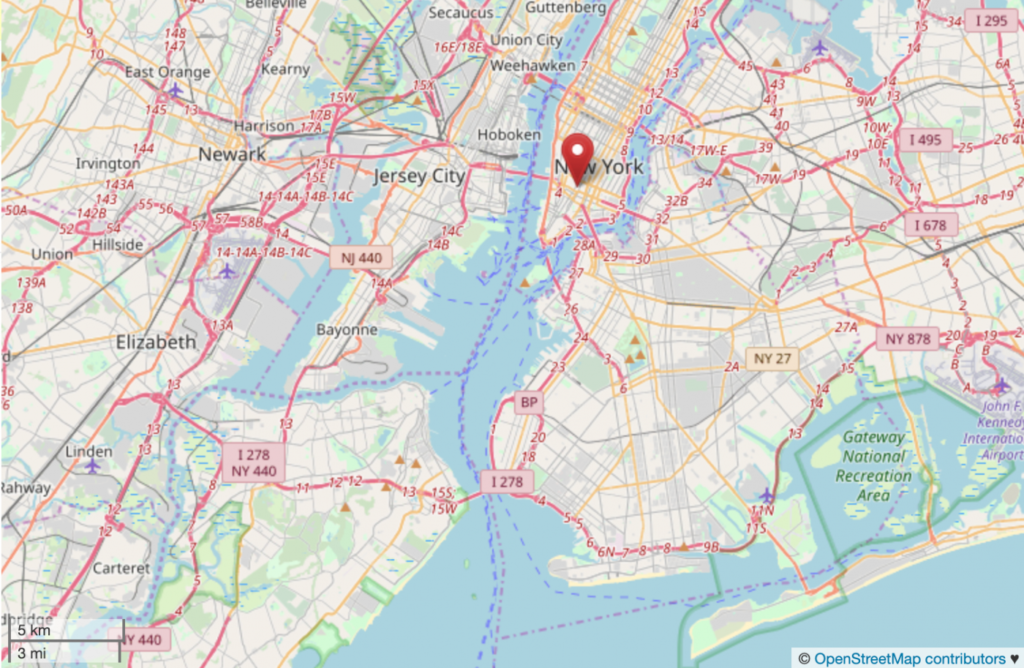
New York
- Most expensive neighborhood: SoHo
- City: New York
- Metro: New York-Newark-Jersey City
- Median home value: $2,870,700
- Peak home value: $3,356,200 (2017-Q4)
- 1-year change in value: -11.3%
- 5-year change in value: 1.0%
- 10-year change in value: 3.1%
North Carolina
- Most expensive neighborhood: Eastover
- City: Charlotte
- Metro: Charlotte-Concord-Gastonia
- Median home value: $1,149,600
- Peak home value: $1,149,600 (2019-Q1)
- 1-year change in value: 2.9%
- 5-year change in value: 5.6%
- 10-year change in value: 2.6%
North Dakota
- Most expensive neighborhood: Madison-Unicorn Park
- City: Fargo
- Metro: Fargo
- Median home value: $954,100
- Peak home value: $960,000 (2018-Q4)
- 1-year change in value: 5.8%
- 5-year change in value: 5.0%
- 10-year change in value: 3.9%
Ohio
- Most expensive neighborhood: Malvern
- City: Shaker Heights
- Metro: Cleveland-Elyria
- Median home value: $468,300
- Peak home value: $538,900 (2007-Q1)
- 1-year change in value: -3.6%
- 5-year change in value: 1.7%
- 10-year change in value: 0.4%
Oklahoma
- Most expensive neighborhood: Heritage Hills
- City: Oklahoma City
- Metro: Oklahoma City
- Median home value: $574,600
- Peak home value: $574,600 (2019-Q1)
- 1-year change in value: 7.3%
- 5-year change in value: 9.7%
- 10-year change in value: 6.2%
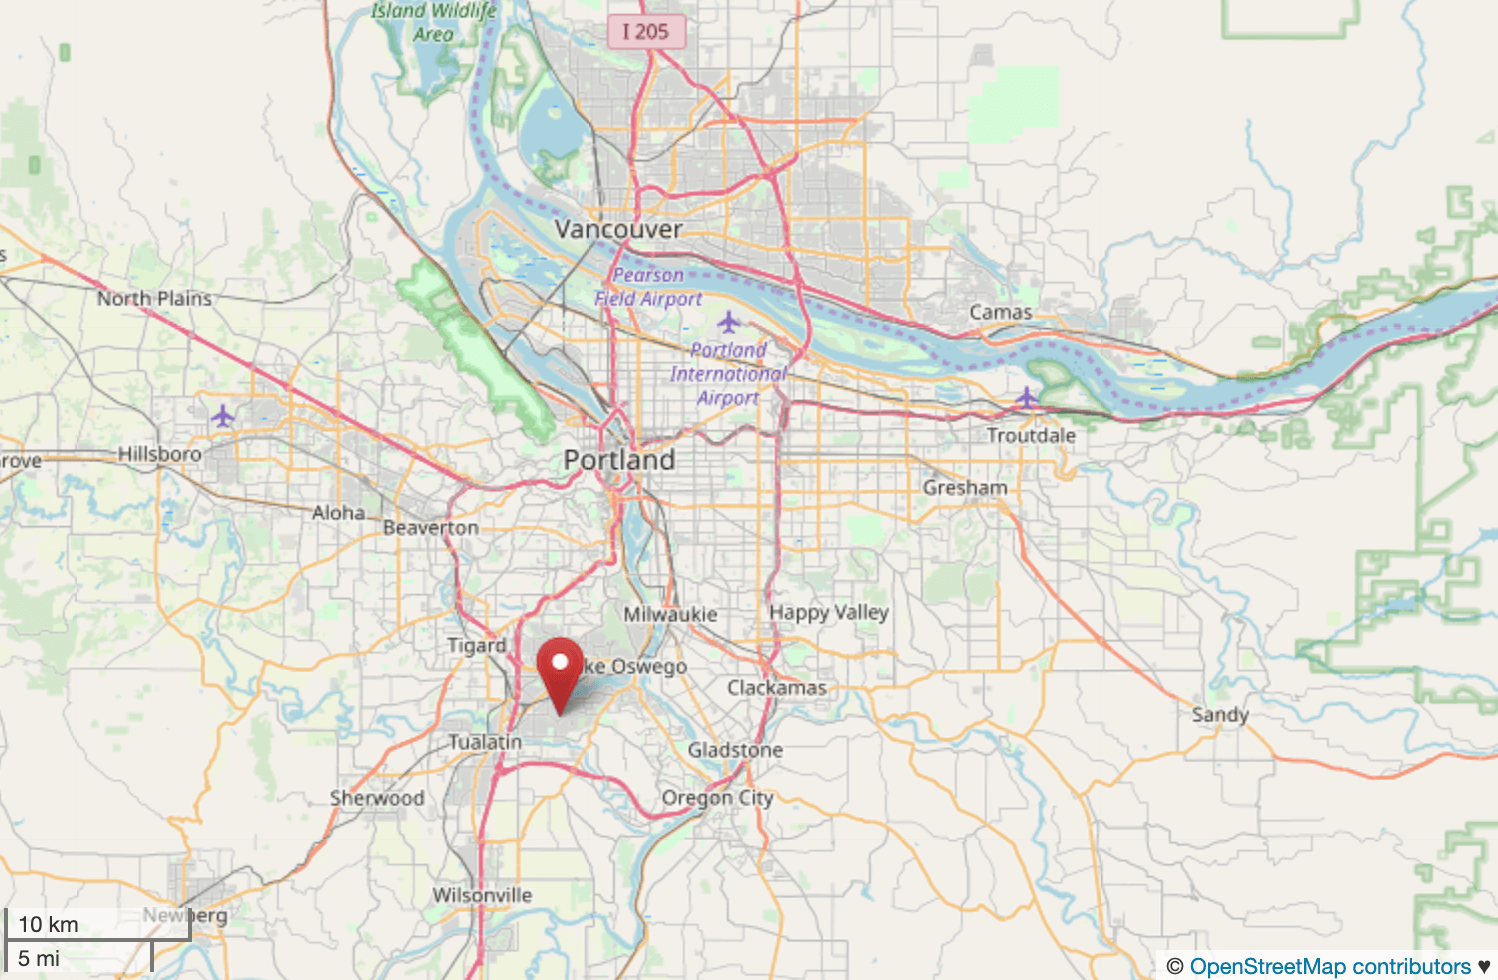
Oregon
- Most expensive neighborhood: Blue Heron
- City: Lake Oswego
- Metro: Portland-Vancouver-Hillsboro
- Median home value: $1,007,900
- Peak home value: $1,013,100 (2018-Q3)
- 1-year change in value: 1.7%
- 5-year change in value: 8.2%
- 10-year change in value: 2.6%
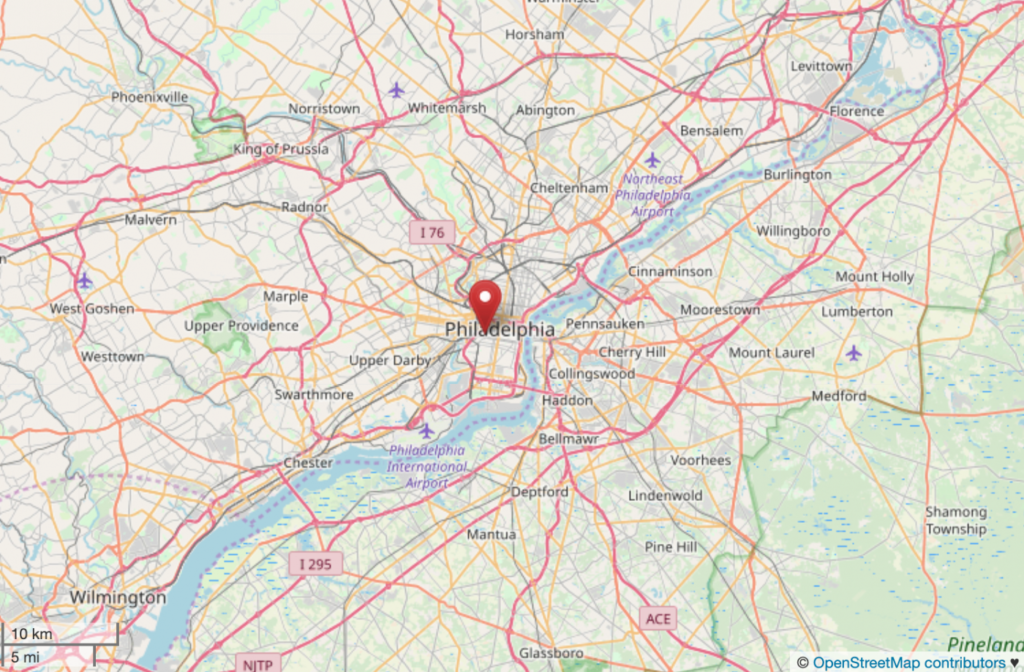
Pennsylvania
- Most expensive neighborhood: Fitler Square
- City: Philadelphia
- Metro: Philadelphia-Camden-Wilmington
- Median home value: $771,700
- Peak home value: $771,700 (2019-Q1)
- 1-year change in value: 9.7%
- 5-year change in value: 10.7%
- 10-year change in value: 4.4%
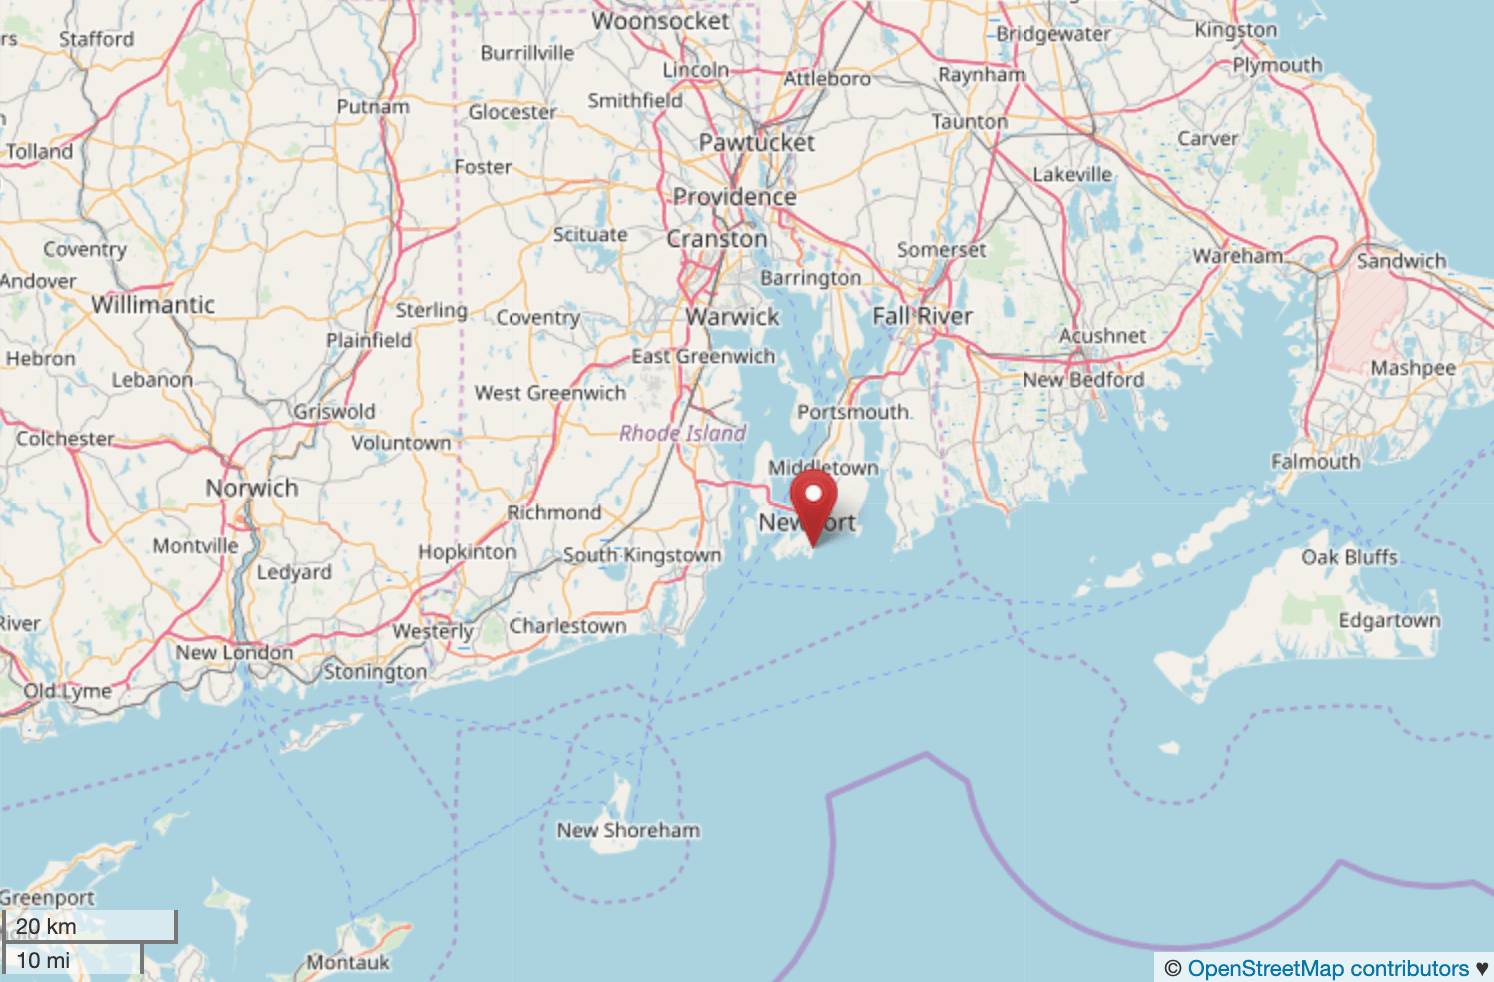
Rhode Island
- Most expensive neighborhood: Bellevue Avenue and Estates
- City: Newport
- Metro: Providence-Warwick
- Median home value: $667,900
- Peak home value: $668,300 (2019-Q1)
- 1-year change in value: 16.3%
- 5-year change in value: 6.8%
- 10-year change in value: 3.8%
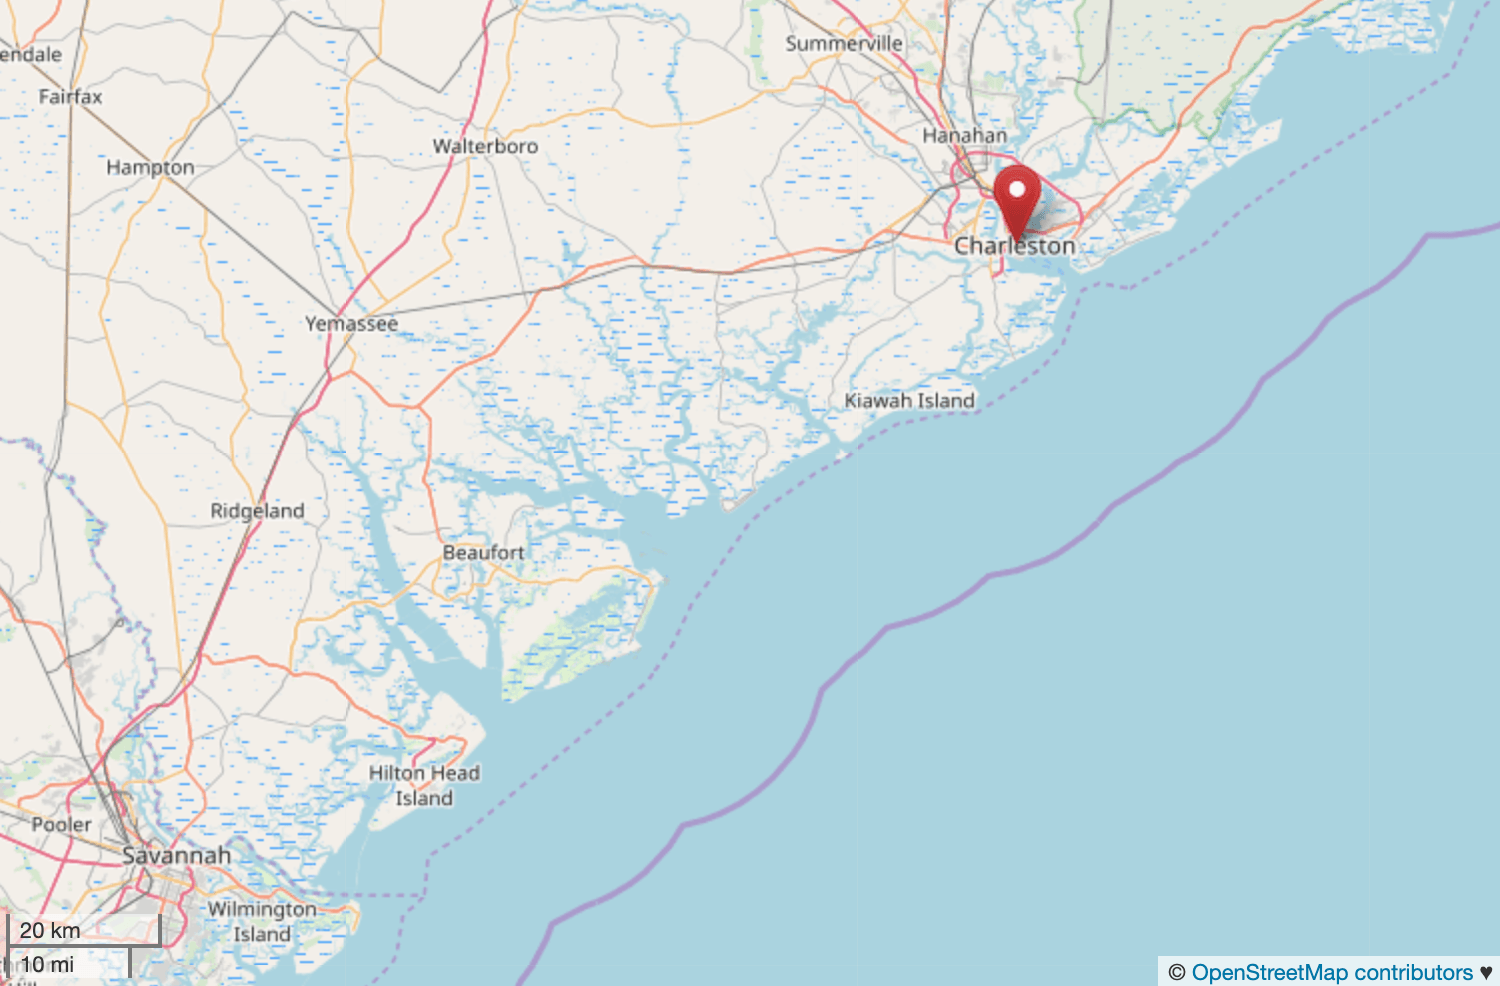
South Carolina
- Most expensive neighborhood: Charlestowne
- City: Charleston
- Metro: Charleston-North Charleston
- Median home value: $1,725,000
- Peak home value: $1,728,300 (2019-Q1)
- 1-year change in value: 1.6%
- 5-year change in value: 7.3%
- 10-year change in value: 2.9%
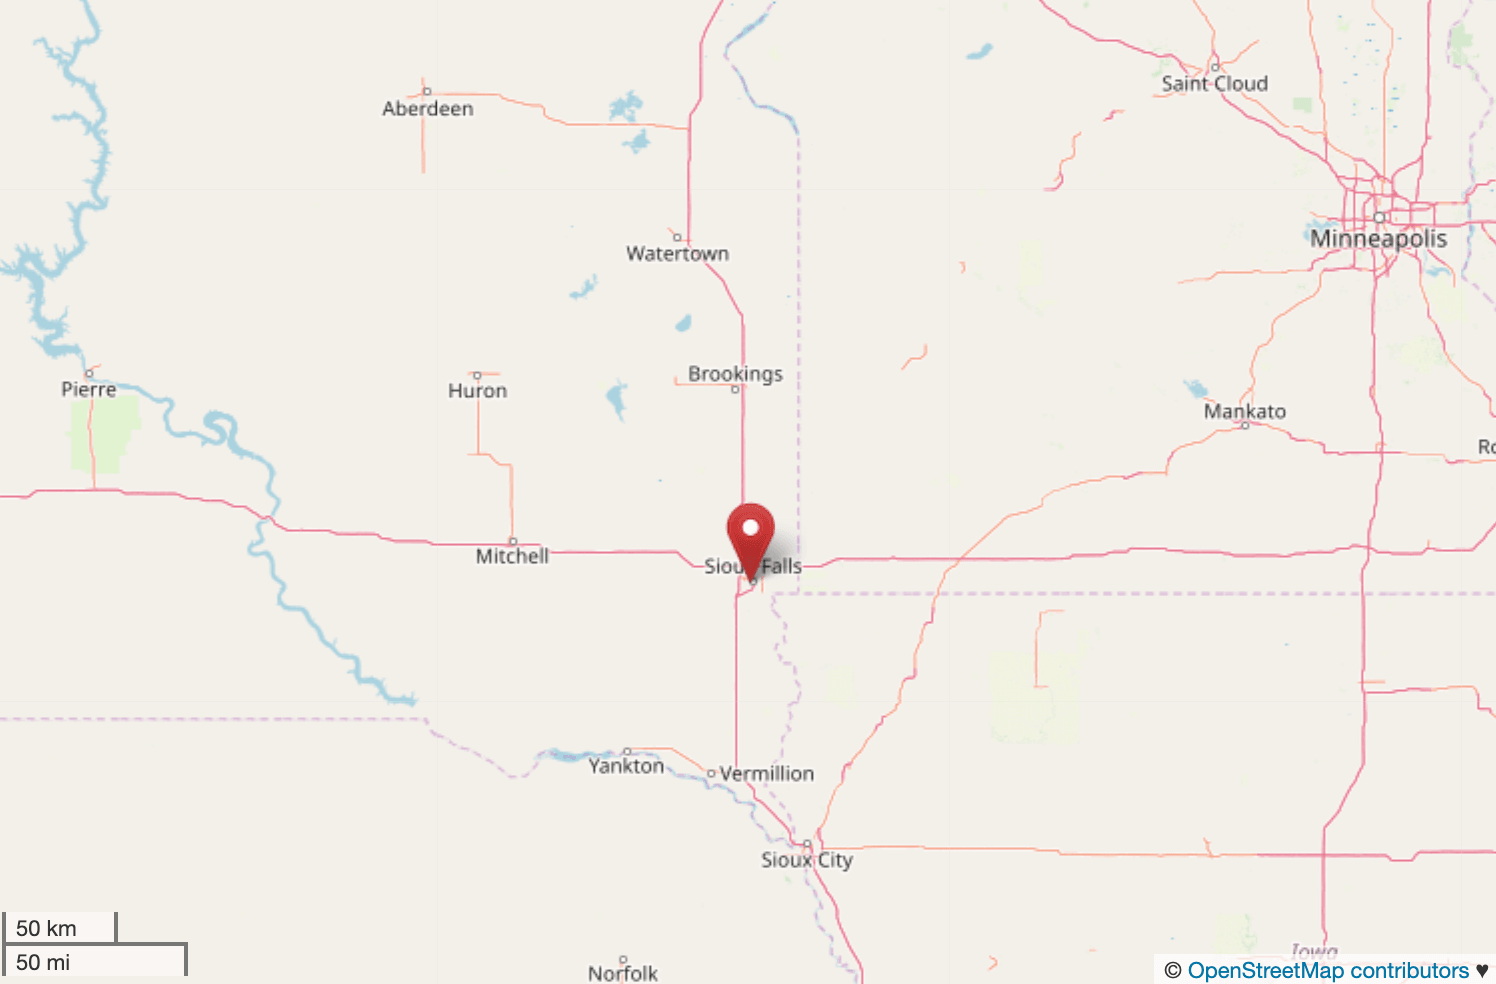
South Dakota
- Most expensive neighborhood: All Saints
- City: Sioux Falls
- Metro: Sioux Falls
- Median home value: $169,000
- Peak home value: $169,000 (2019-Q1)
- 1-year change in value: 5.2%
- 5-year change in value: 6.3%
- 10-year change in value: 3.8%
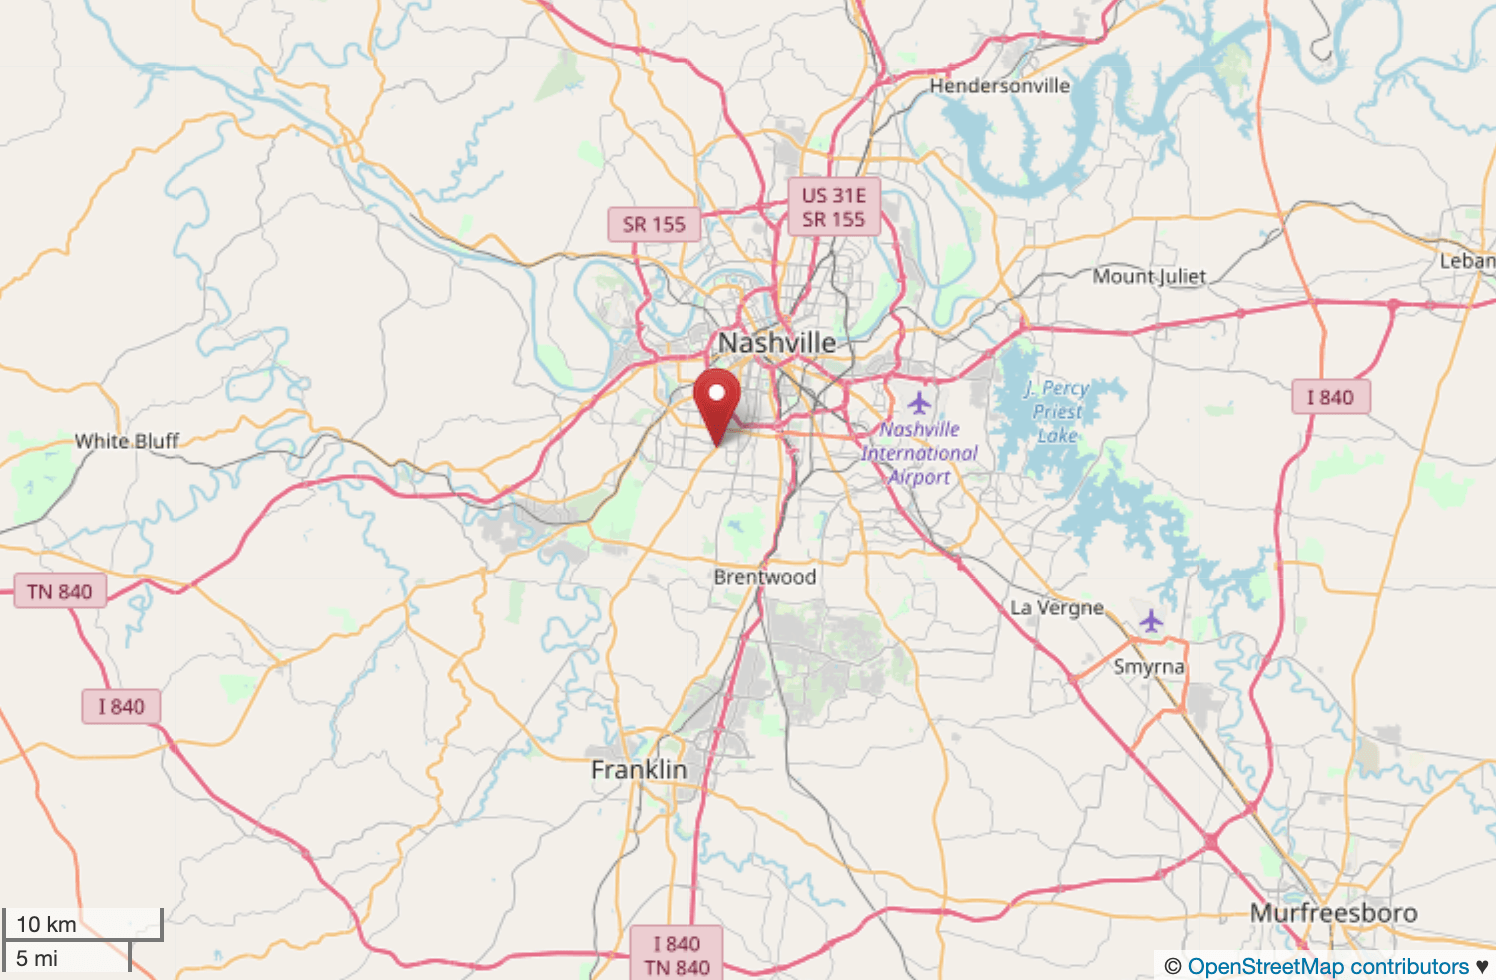
Tennessee
- Most expensive neighborhood: Green Hills
- City: Nashville
- Metro: Nashville-Davidson–Murfreesboro–Franklin
- Median home value: $841,800
- Peak home value: $841,800 (2019-Q1)
- 1-year change in value: 4.4%
- 5-year change in value: 5.9%
- 10-year change in value: 3.3%
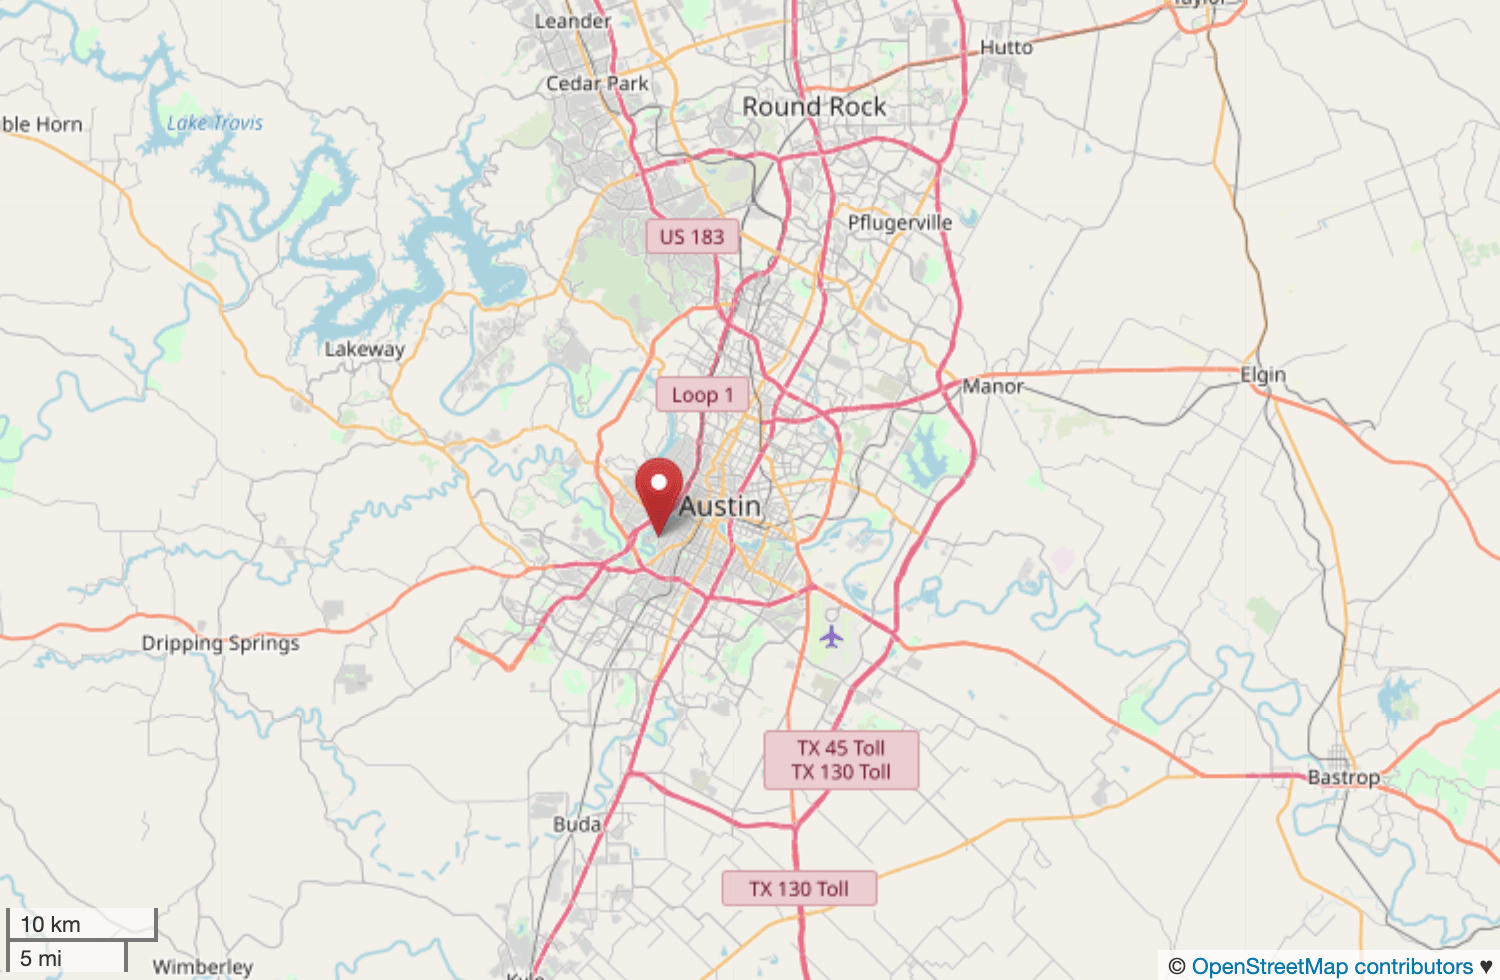
Texas
- Most expensive neighborhood: Barton Creek
- City: Austin
- Metro: Austin-Round Rock
- Median home value: $1,046,600
- Peak home value: $1,046,600 (2019-Q1)
- 1-year change in value: 5.1%
- 5-year change in value: 6.3%
- 10-year change in value: 3.1%
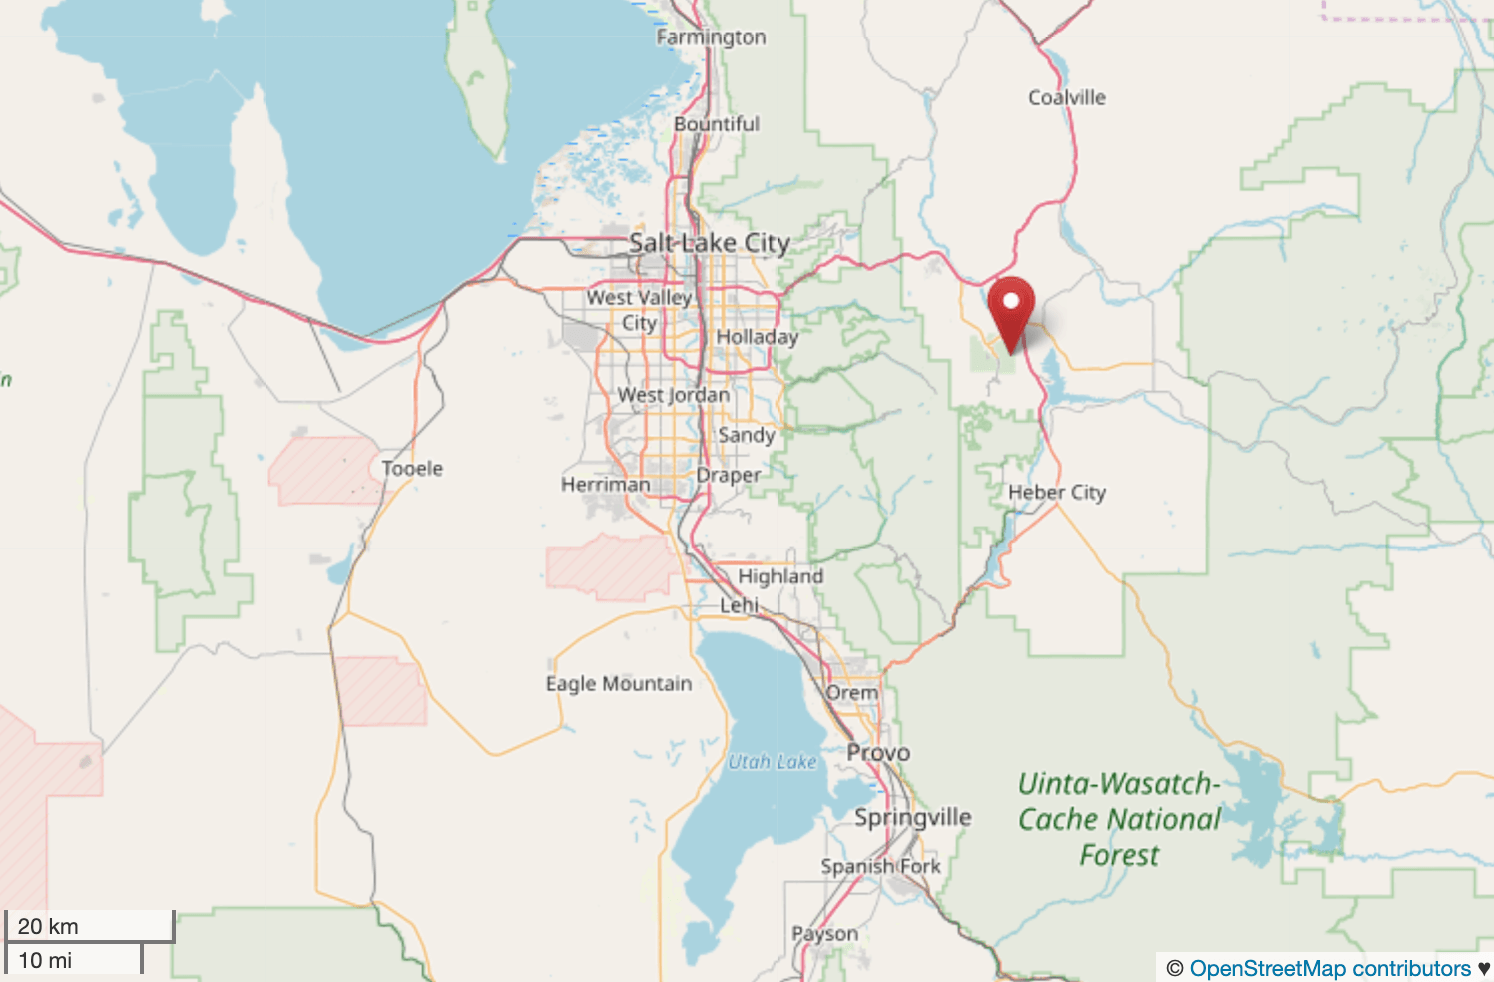
Utah
- Most expensive neighborhood: Upper Deer Valley
- City: Park City
- Metro: Summit Park
- Median home value: $1,961,200
- Peak home value: $2,091,300 (2018-Q1)
- 1-year change in value: -5.9%
- 5-year change in value: 5.8%
- 10-year change in value: 3.4%
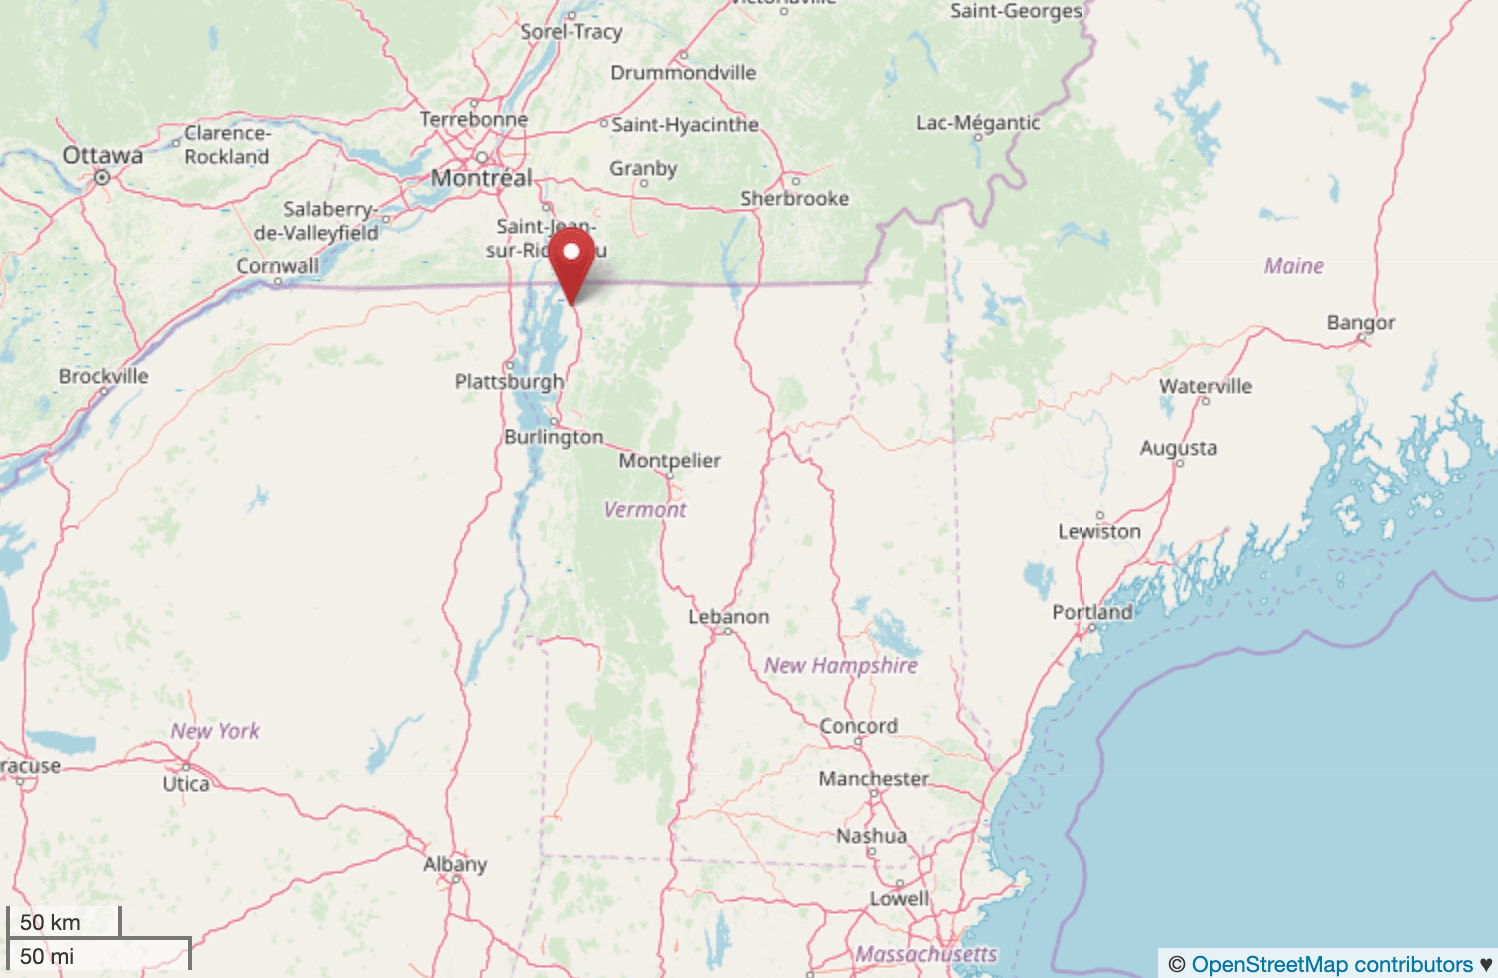
Vermont
- Most expensive neighborhood: Swanton
- City: Swanton
- Metro: Burlington-South Burlington
- Median home value: $173,100
- Peak home value: $174,200 (2018-Q4)
- 1-year change in value: 1.6%
- 5-year change in value: 2.1%
- 10-year change in value: 1.2%
Virginia
- Most expensive neighborhood: Lyon Village
- City: Arlington
- Metro: Washington-Arlington-Alexandria
- Median home value: $1,354,300
- Peak home value: $1,357,400 (2019-Q1)
- 1-year change in value: 12.5%
- 5-year change in value: 5.6%
- 10-year change in value: 2.9%
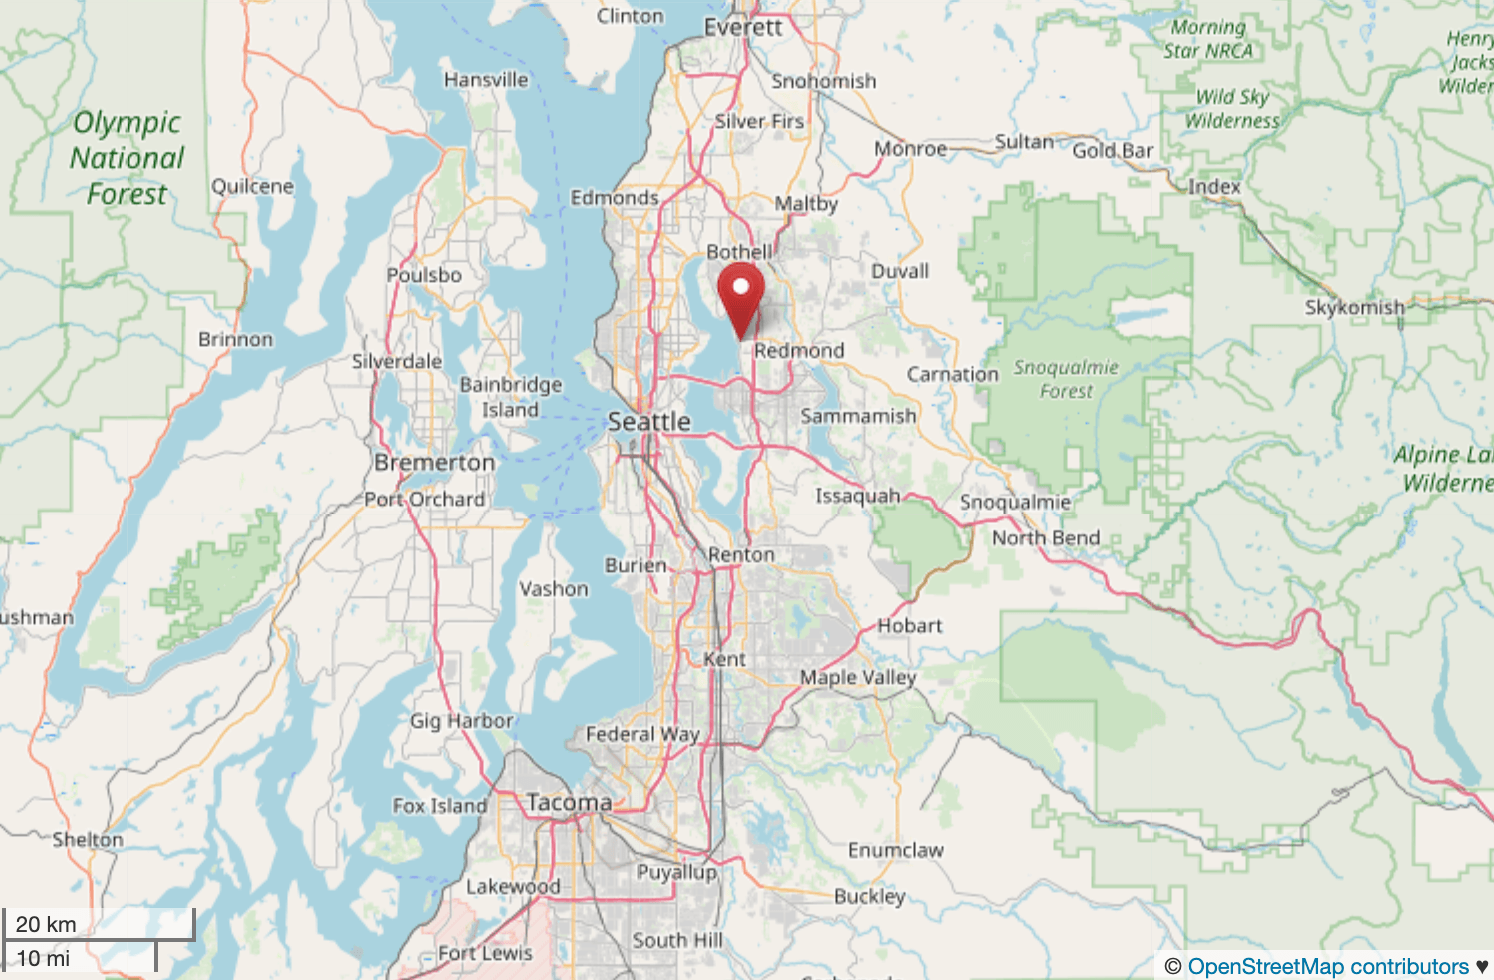
Washington
- Most expensive neighborhood: Market-Downtown
- City: Kirkland
- Metro: Seattle-Tacoma-Bellevue
- Median home value: $2,082,100
- Peak home value: $2,108,000 (2018-Q3)
- 1-year change in value: 4.0%
- 5-year change in value: 11.2%
- 10-year change in value: 6.0%
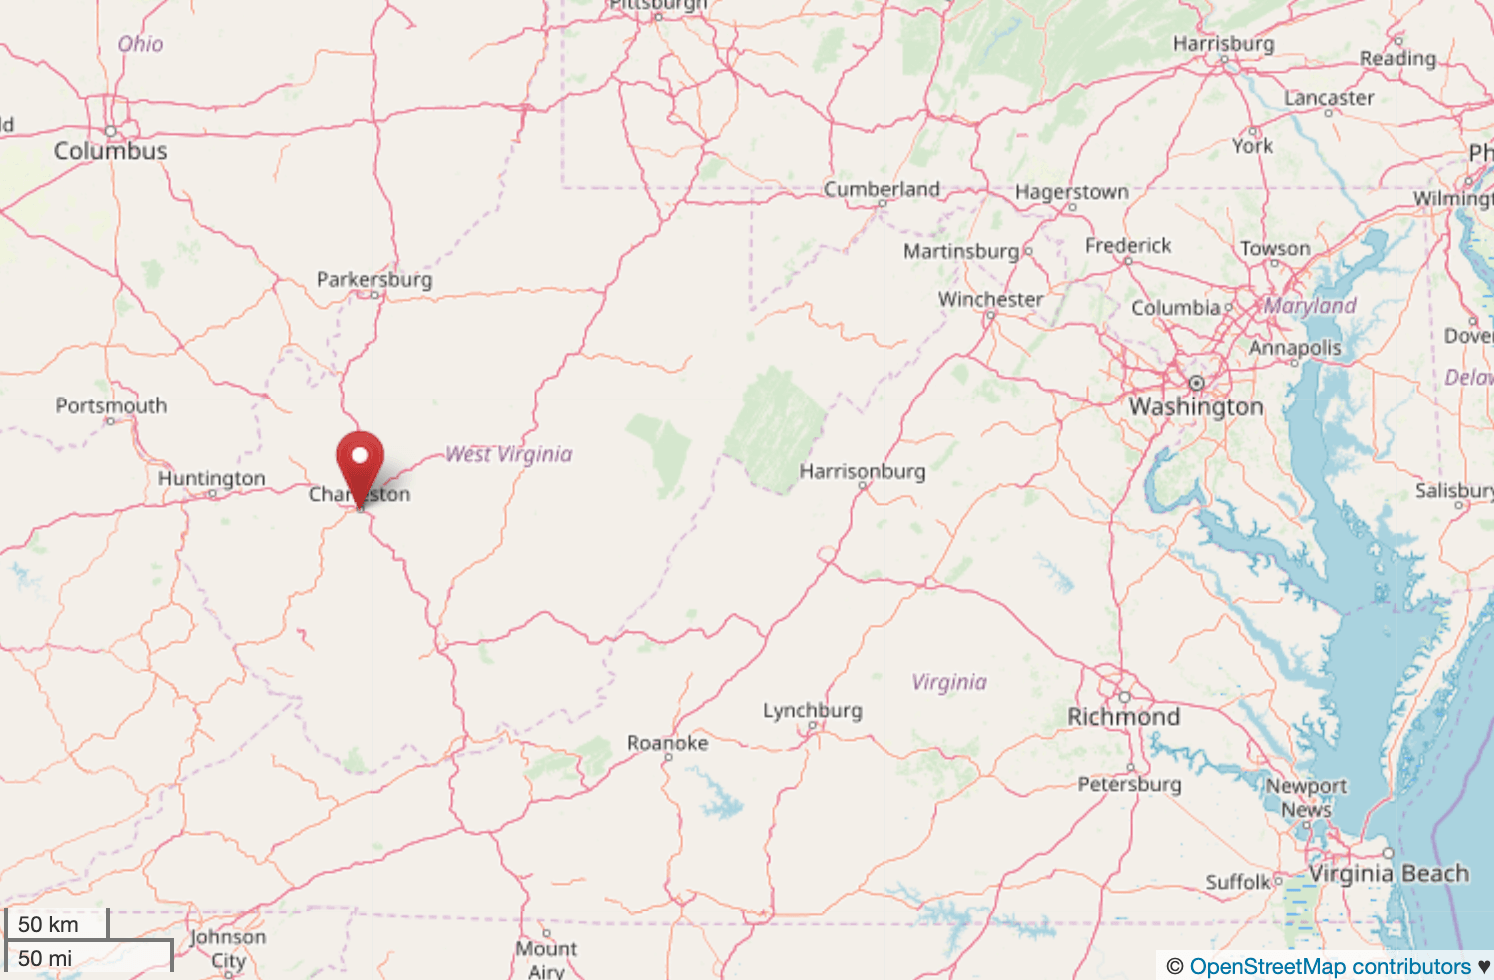
West Virginia
- Most expensive neighborhood: South Hills
- City: Charleston
- Metro: Charleston
- Median home value: $165,800
- Peak home value: $171,900 (2017-Q4)
- 1-year change in value: -0.8%
- 5-year change in value: 0.0%
- 10-year change in value: 0.5%
Wisconsin
- Most expensive neighborhood: Blackhawk
- City: Madison
- Metro: Madison
- Median home value: $629,000
- Peak home value: $629,000 (2019-Q1)
- 1-year change in value: 0.8%
- 5-year change in value: 2.4%
- 10-year change in value: 0.9%
Methodology
The home price data used in this analysis is from Zillow. The median home value is the most recent Zillow Home Value Index, accessed on April 17, 2019. This statistic includes all homes in a given neighborhood, including single-family, condominium and co-operative homes with a county record.
For each state, the neighborhood with the highest median home value was identified and used as the basis for this list. This analysis is limited to the homes and the 7,439 most popular neighborhoods for which Zillow collects data on. As a result, it’s possible that certain more expensive neighborhoods exist, but are not represented on this list. Notably, data for Wyoming is not available.