U.S. Cities Where the Most Residents Lack Running Water in 2021
While the majority of Americans take running water and indoor plumbing for granted, a surprising number of residents don’t have running water, flushing toilets, or showers in their homes. In fact, according to a U.S. Water Alliance report, over 2 million Americans lack running water and basic indoor plumbing. Although some rural areas and indigenous communities have never had indoor plumbing, most unplumbed households are located in major urban areas. According to the Census Bureau, more than 360,000 American households lack hot and cold running water entirely and nearly half a million lack complete plumbing facilities, for example both hot and cold water, a shower or bath, and a flush toilet. Of these households, about half are located in metropolitan areas with populations over 1 million.
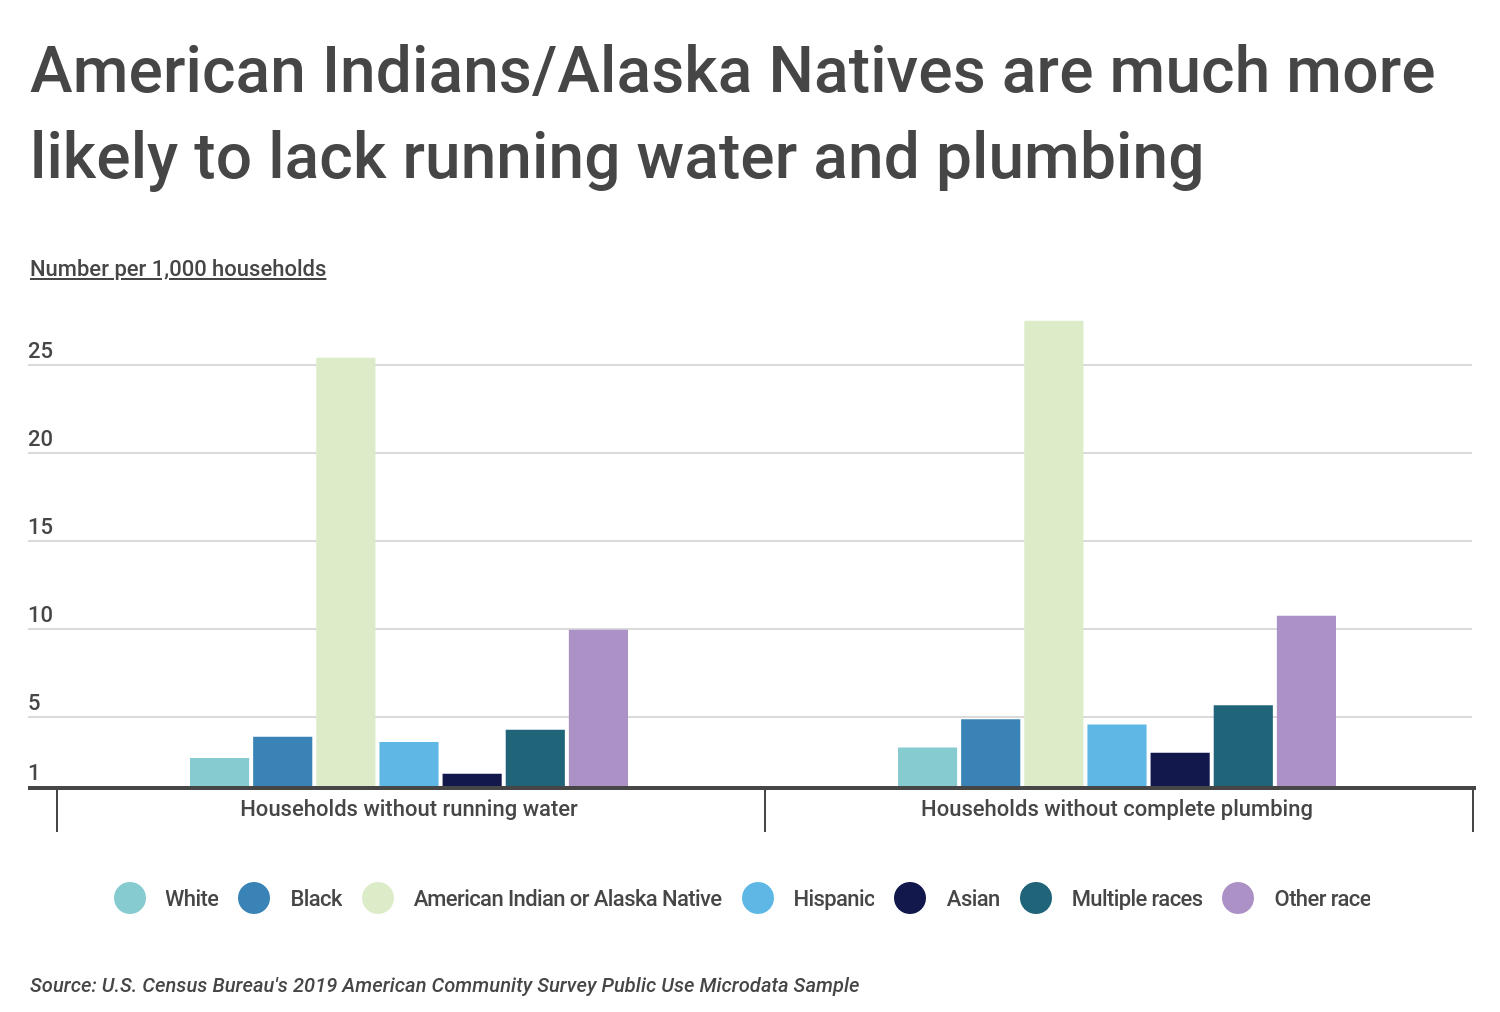
Household access to running water and indoor plumbing varies significantly by race and ethnicity, with minority households disproportionately impacted. American Indians and Alaska Natives are many times more likely to lack hot and cold running water and indoor plumbing than other racial and ethnic groups. Across the entire U.S., approximately three out of every 1,000 households lack running water and 3.8 don’t have complete plumbing. In comparison, the numbers are 25 and 28, respectively, for American Indian and Alaska Native households.
While access to clean, running water has been a long-standing problem in Native American communities due to lack of infrastructure and disagreements over water rights, other minorities also face disproportionate rates of water insecurity. Black and Hispanic households are more likely than White households to lack running water and indoor plumbing, with many living in large cities, often in single-room occupancy buildings with shared bathrooms. Further, increasing housing costs in large, urban areas have made it difficult for people to move despite lacking basic necessities in their homes.
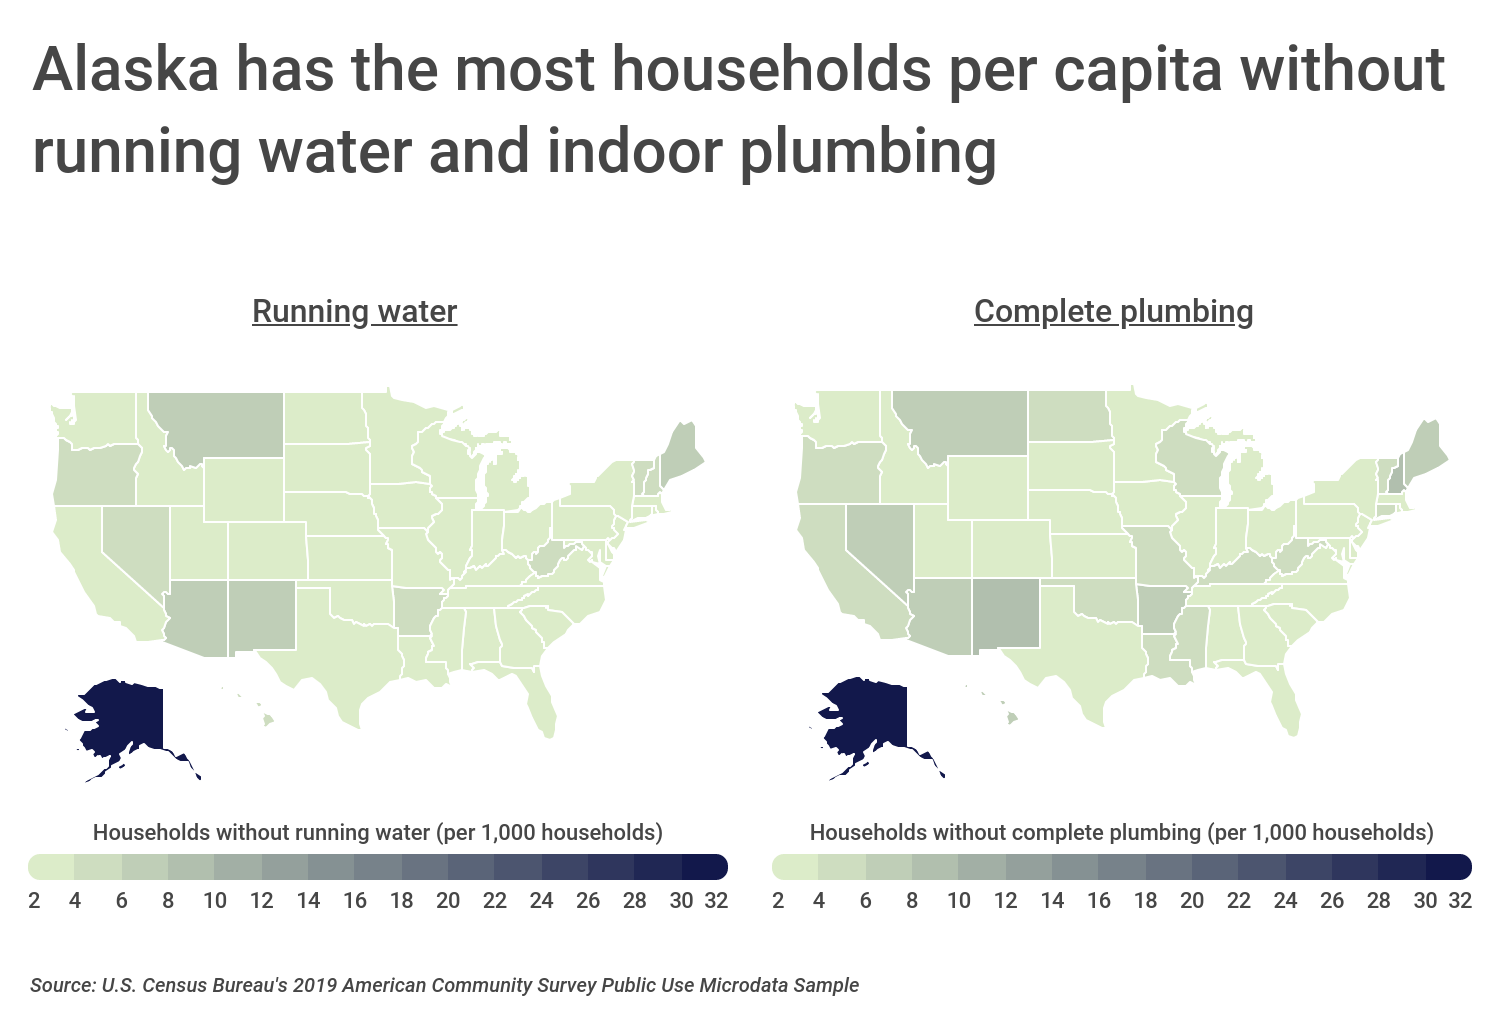
Access to running water and indoor plumbing varies geographically too, depending on existing water infrastructure and infrastructure investments. Additionally, parts of the country with large indigenous communities are especially likely to suffer from water insecurity. For example, Alaska and New Mexico have the highest proportions of households that lack access to hot and cold running water, and they are also the two states with the largest Alaskan Native and American Indian populations. In contrast, Colorado households are the least likely to suffer from water access challenges—just 1.7 households per 1,000 don’t have running water and 2.1 lack complete plumbing.
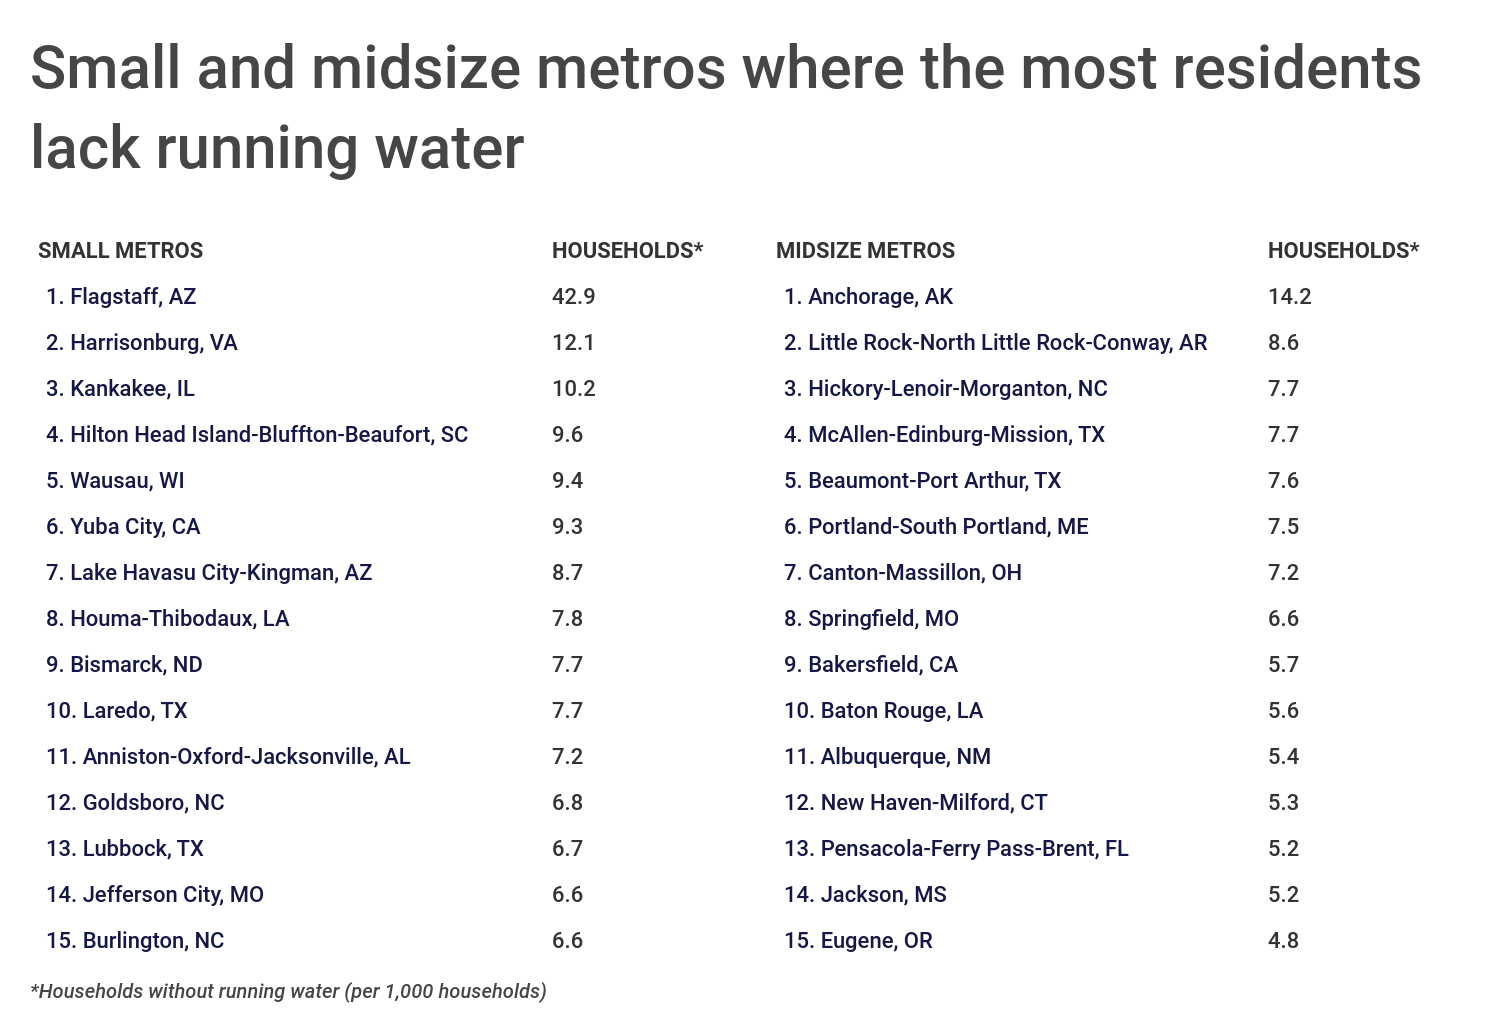
To find the metropolitan areas where the most residents lack running water, researchers at Construction Coverage analyzed the data from the U.S. Census Bureau. The researchers ranked metro areas according to the proportion of households that lack hot and cold running water. Researchers also calculated the proportion of households without complete plumbing, median household income, the poverty rate, and the minority population share. To improve relevance, only metropolitan areas with at least 100,000 people were included in the analysis. Additionally, metro areas were grouped into cohorts based on population size.
Here are the metropolitan areas where the most residents lack running water.
Large Metros Where the Most Residents Lack Running Water
Photo Credit: Harold Stiver / Shutterstock
15. Phoenix-Mesa-Scottsdale, AZ
- Households without running water (per 1,000 households): 3.0
- Total households without running water: 5,289
- Households without complete plumbing (per 1,000 households): 3.7
- Total households without complete plumbing: 6,542
- Median household income: $67,000
- Poverty rate: 12.1%
- Minority population share: 45.5%
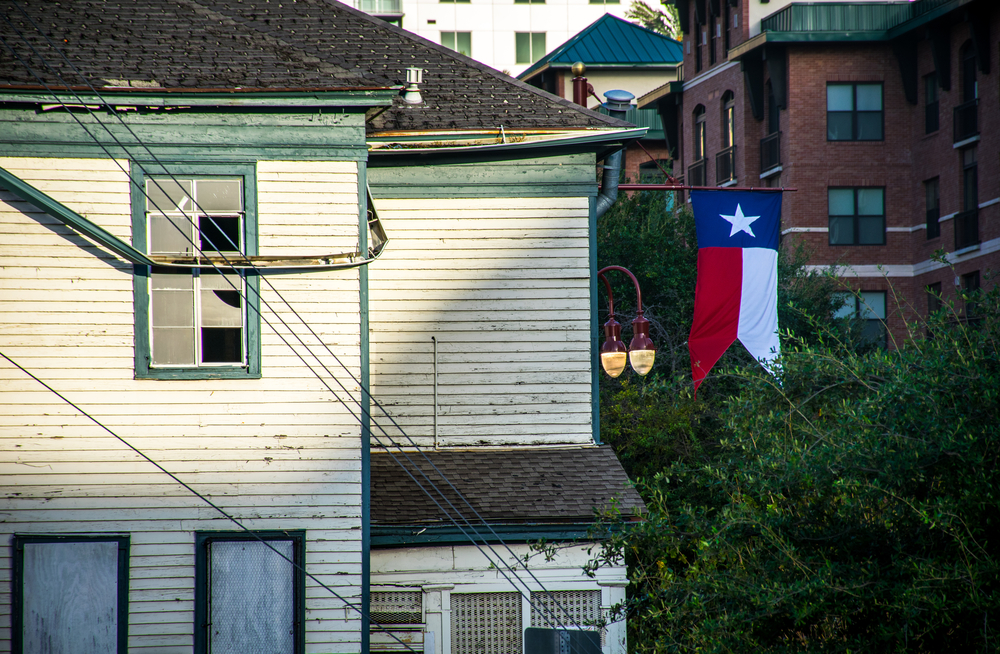
Photo Credit: Roschetzky Photography / Shutterstock
14. Houston-The Woodlands-Sugar Land, TX
- Households without running water (per 1,000 households): 3.0
- Total households without running water: 7,312
- Households without complete plumbing (per 1,000 households): 3.4
- Total households without complete plumbing: 8,295
- Median household income: $69,000
- Poverty rate: 12.9%
- Minority population share: 64.9%
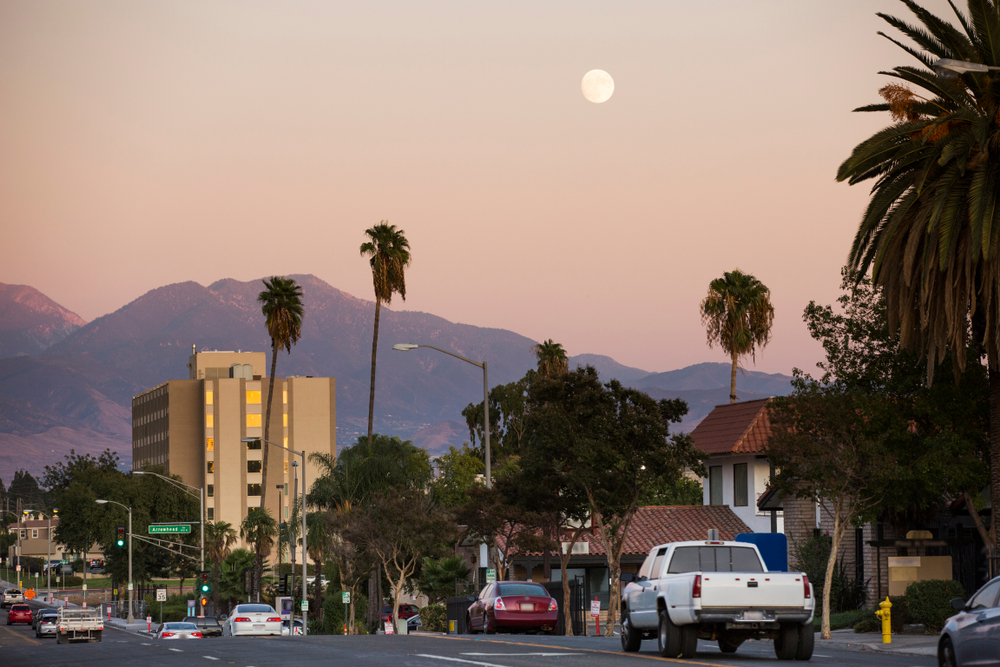
Photo Credit: Matt Gush / Shutterstock
13. Riverside-San Bernardino-Ontario, CA
- Households without running water (per 1,000 households): 3.1
- Total households without running water: 4,260
- Households without complete plumbing (per 1,000 households): 4.0
- Total households without complete plumbing: 5,508
- Median household income: $70,500
- Poverty rate: 12.2%
- Minority population share: 69.3%
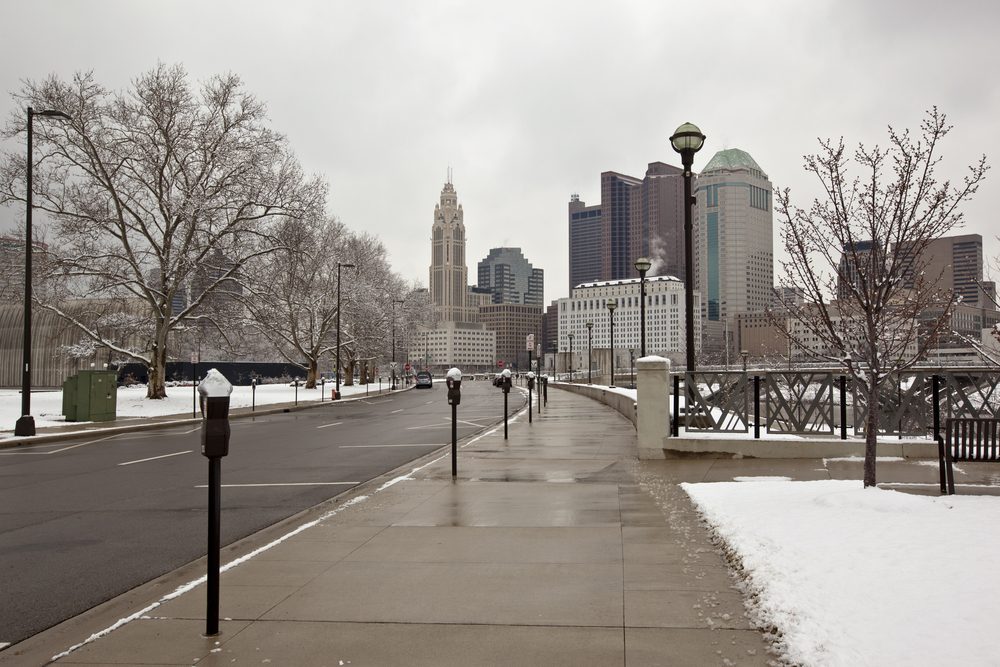
Photo Credit: aceshot1 / Shutterstock
12. Columbus, OH
- Households without running water (per 1,000 households): 3.1
- Total households without running water: 2,435
- Households without complete plumbing (per 1,000 households): 3.4
- Total households without complete plumbing: 2,657
- Median household income: $67,600
- Poverty rate: 11.5%
- Minority population share: 28.2%

Photo Credit: iampaese / Shutterstock
11. Kansas City, MO-KS
- Households without running water (per 1,000 households): 3.2
- Total households without running water: 2,715
- Households without complete plumbing (per 1,000 households): 4.0
- Total households without complete plumbing: 3,448
- Median household income: $69,000
- Poverty rate: 10.3%
- Minority population share: 28.0%
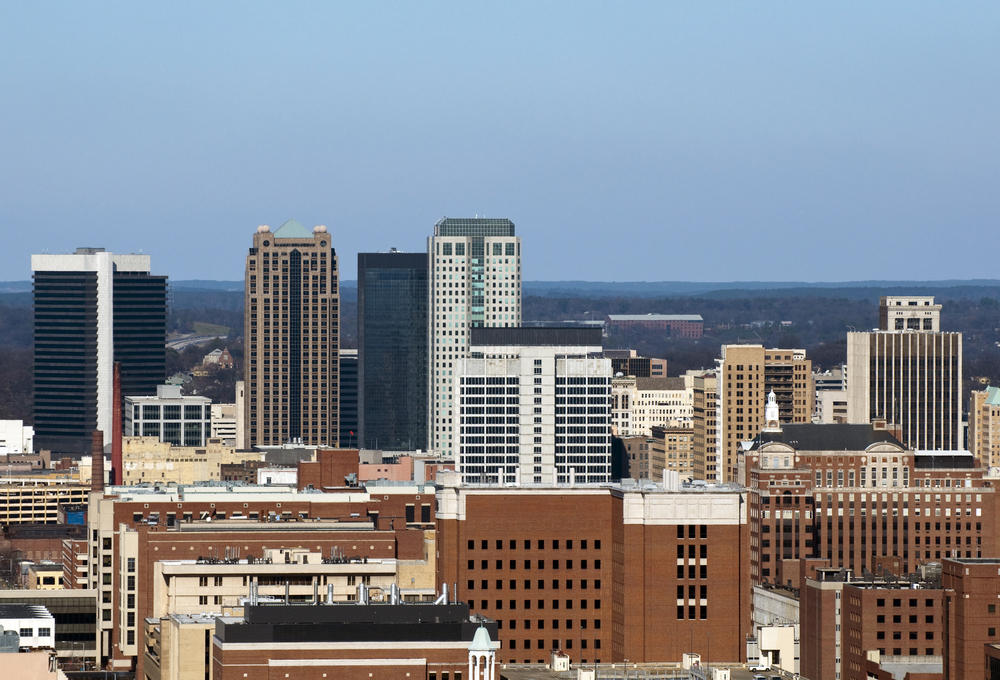
Photo Credit: Katherine Wells / Shutterstock
10. Birmingham-Hoover, AL
- Households without running water (per 1,000 households): 3.2
- Total households without running water: 1,417
- Households without complete plumbing (per 1,000 households): 4.0
- Total households without complete plumbing: 1,805
- Median household income: $57,100
- Poverty rate: 14.0%
- Minority population share: 38.4%
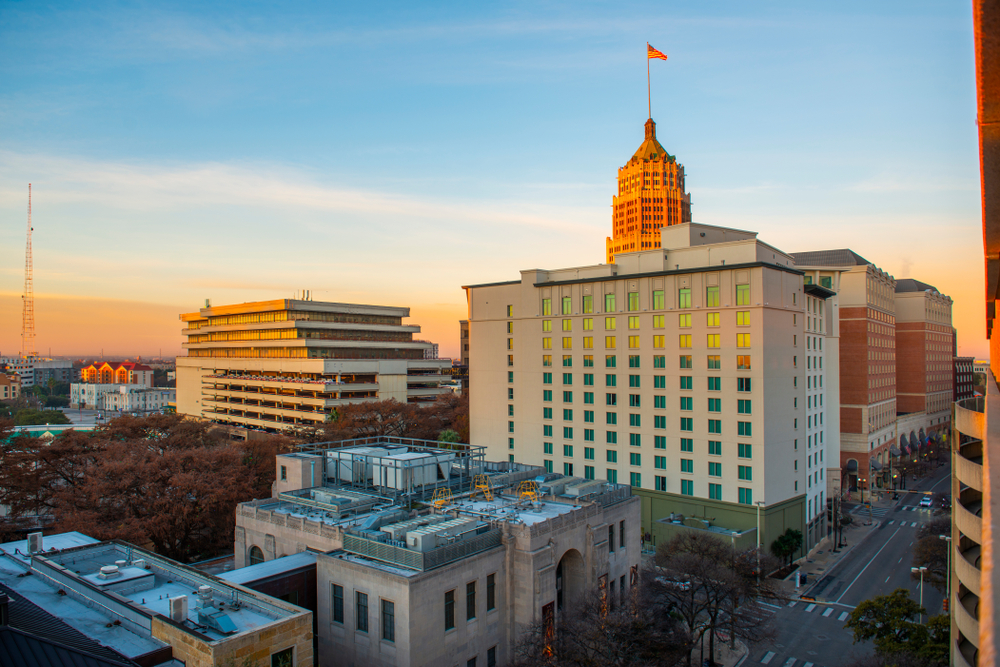
Photo Credit: Wangkun Jia / Shutterstock
9. San Antonio-New Braunfels, TX
- Households without running water (per 1,000 households): 3.2
- Total households without running water: 2,540
- Households without complete plumbing (per 1,000 households): 3.5
- Total households without complete plumbing: 2,845
- Median household income: $60,600
- Poverty rate: 13.5%
- Minority population share: 66.8%
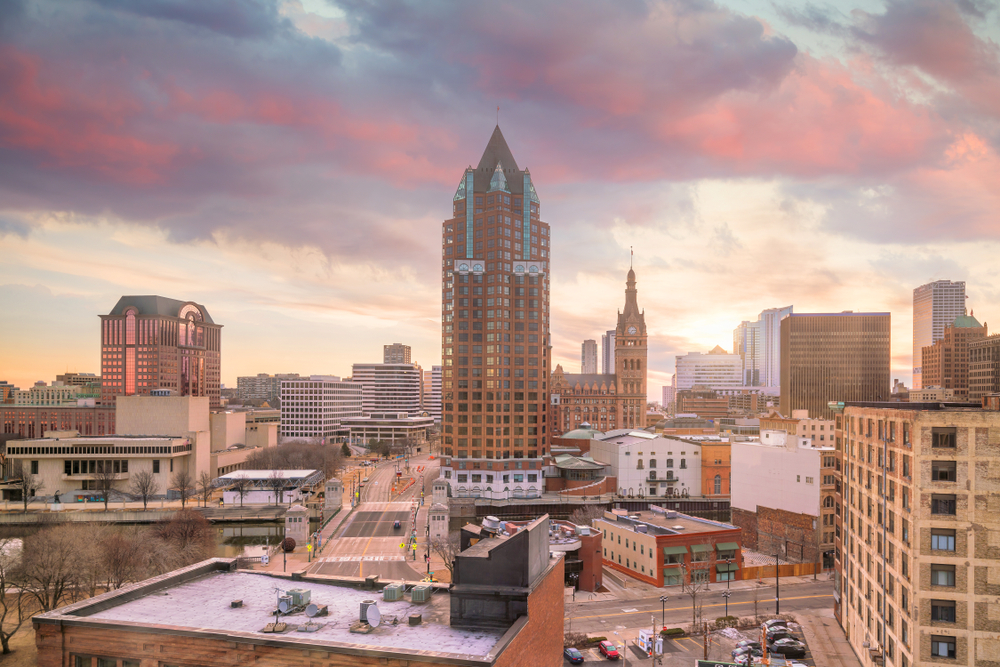
Photo Credit: f11photo / Shutterstock
8. Milwaukee-Waukesha-West Allis, WI
- Households without running water (per 1,000 households): 3.2
- Total households without running water: 2,018
- Households without complete plumbing (per 1,000 households): 4.9
- Total households without complete plumbing: 3,098
- Median household income: $66,500
- Poverty rate: 11.8%
- Minority population share: 34.1%
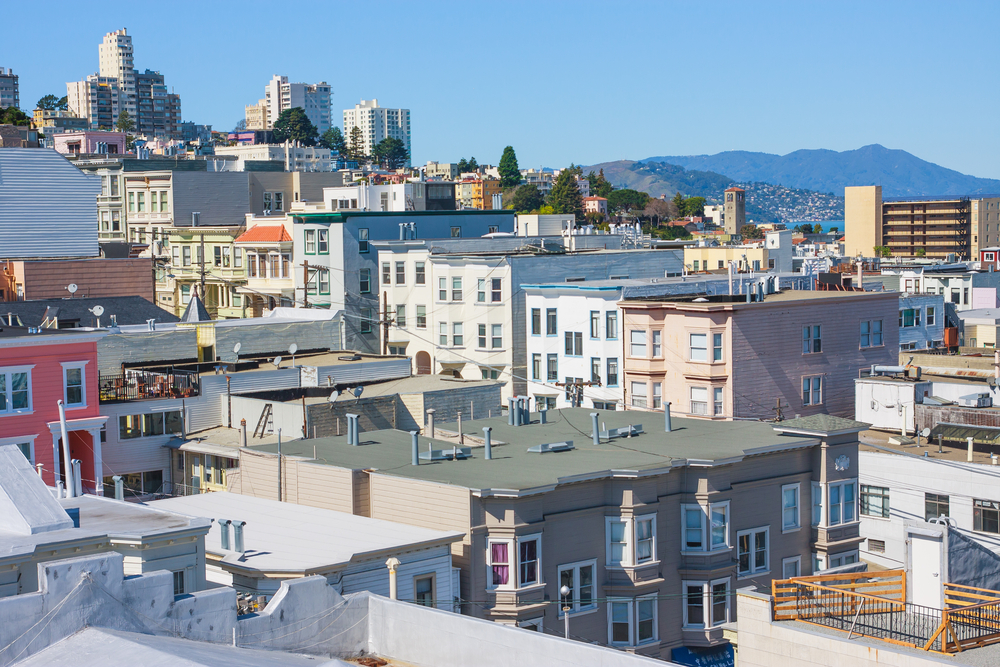
Photo Credit: Radoslaw Lecyk / Shutterstock
7. San Francisco-Oakland-Hayward, CA
- Households without running water (per 1,000 households): 3.2
- Total households without running water: 5,541
- Households without complete plumbing (per 1,000 households): 8.8
- Total households without complete plumbing: 15,087
- Median household income: $113,200
- Poverty rate: 8.2%
- Minority population share: 61.4%
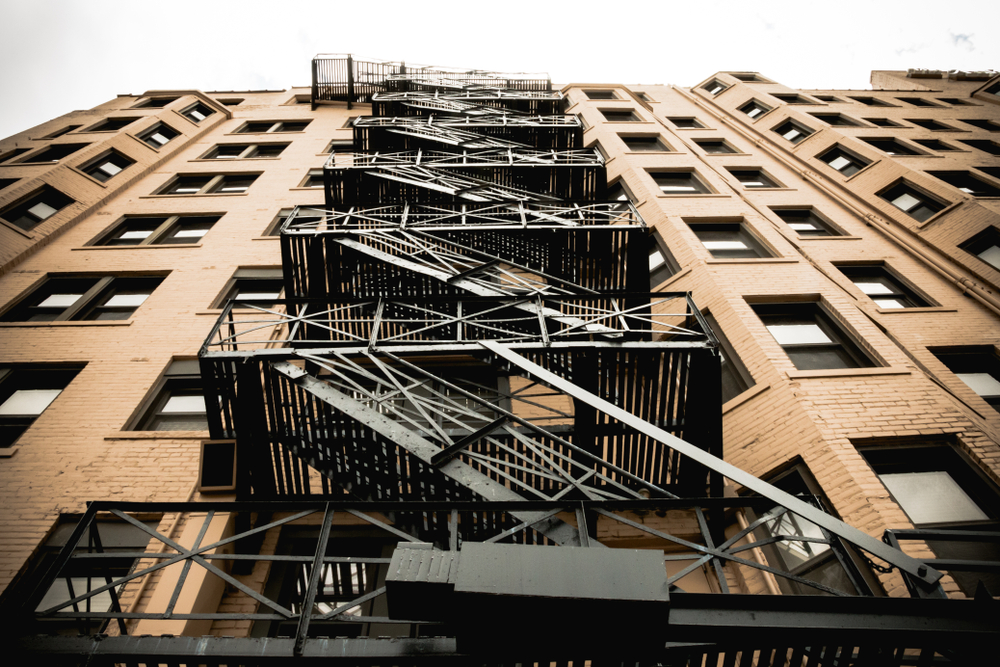
Photo Credit: Concrete Jungle Media / Shutterstock
6. Detroit-Warren-Dearborn, MI
- Households without running water (per 1,000 households): 3.5
- Total households without running water: 5,972
- Households without complete plumbing (per 1,000 households): 3.8
- Total households without complete plumbing: 6,347
- Median household income: $62,400
- Poverty rate: 12.6%
- Minority population share: 34.1%
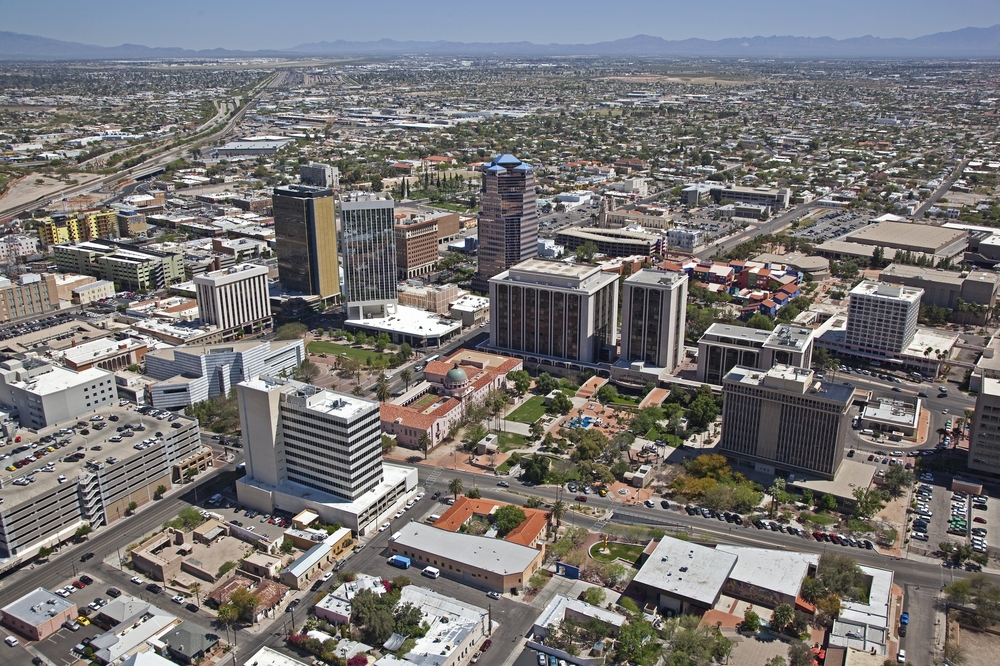
Photo Credit: Tim Roberts Photography / Shutterstock
5. Tucson, AZ
- Households without running water (per 1,000 households): 4.1
- Total households without running water: 1,697
- Households without complete plumbing (per 1,000 households): 4.7
- Total households without complete plumbing: 1,926
- Median household income: $55,980
- Poverty rate: 13.8%
- Minority population share: 48.9%
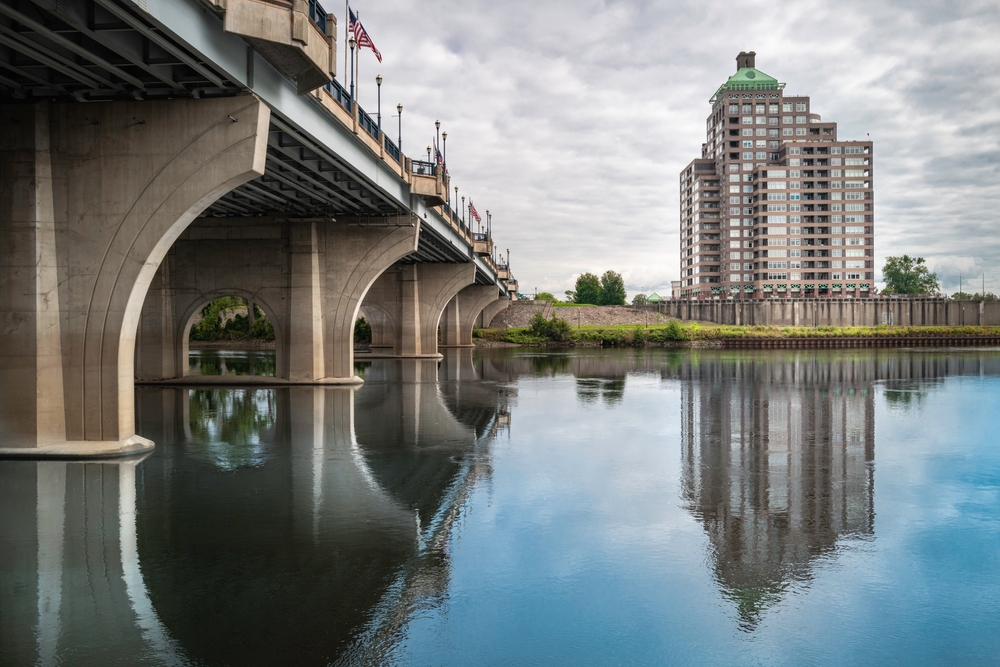
Photo Credit: NayaDadara / Shutterstock
4. Hartford-West Hartford-East Hartford, CT
- Households without running water (per 1,000 households): 4.2
- Total households without running water: 2,023
- Households without complete plumbing (per 1,000 households): 4.6
- Total households without complete plumbing: 2,206
- Median household income: $76,380
- Poverty rate: 10.1%
- Minority population share: 34.3%
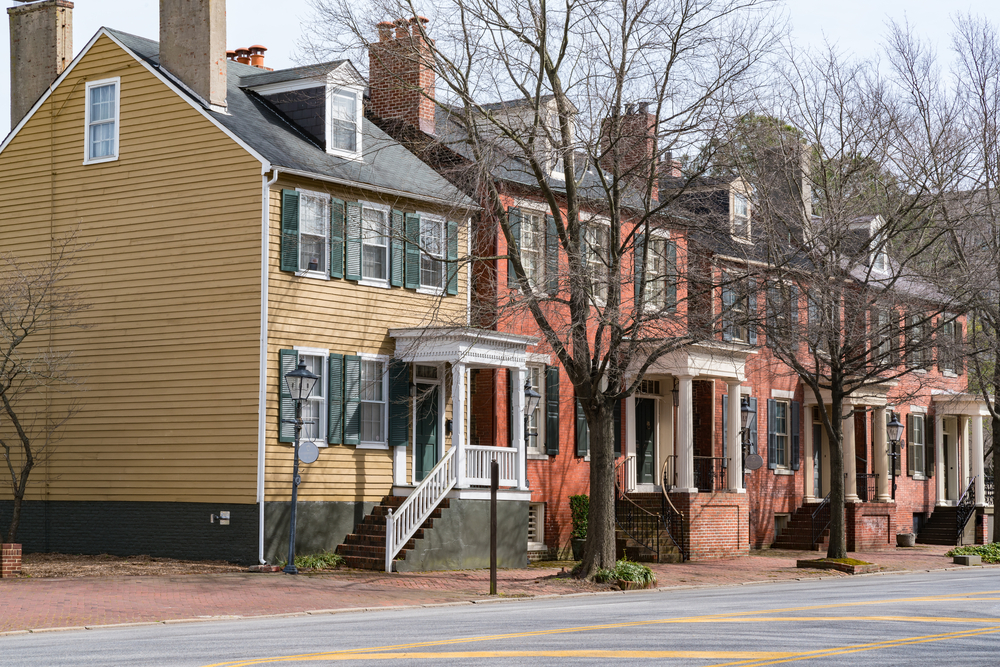
Photo Credit: Paul Brady Photography / Shutterstock
3. Virginia Beach-Norfolk-Newport News, VA-NC
- Households without running water (per 1,000 households): 4.7
- Total households without running water: 2,972
- Households without complete plumbing (per 1,000 households): 5.0
- Total households without complete plumbing: 3,210
- Median household income: $68,000
- Poverty rate: 10.6%
- Minority population share: 45.4%
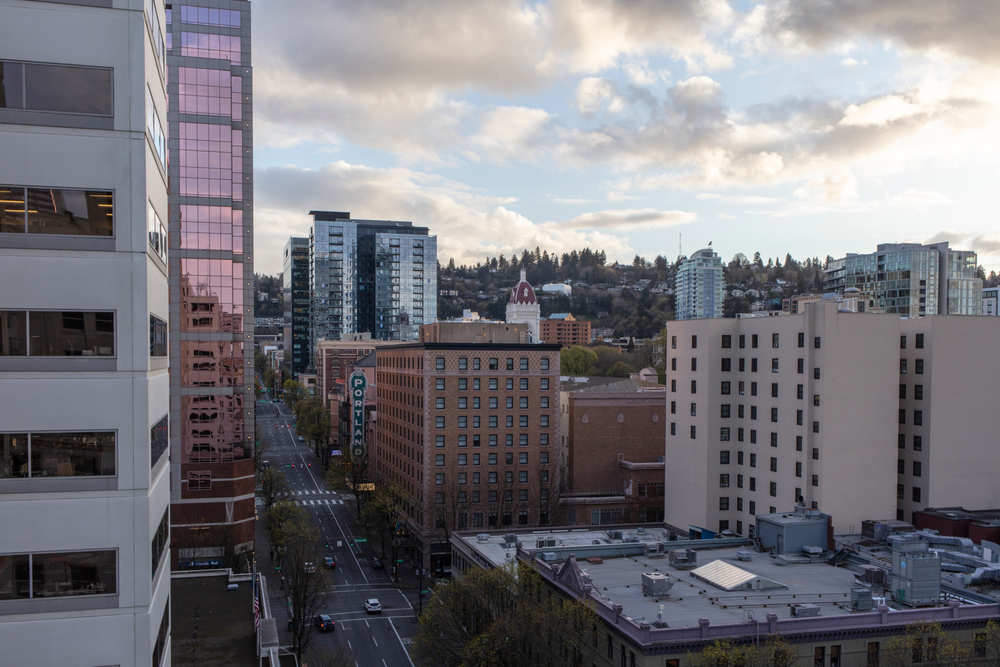
Photo Credit: Xiao Zhou / Shutterstock
2. Portland-Vancouver-Hillsboro, OR-WA
- Households without running water (per 1,000 households): 5.4
- Total households without running water: 5,244
- Households without complete plumbing (per 1,000 households): 6.1
- Total households without complete plumbing: 5,942
- Median household income: $77,800
- Poverty rate: 9.6%
- Minority population share: 27.7%
Photo Credit: Kit Leong / Shutterstock
1. Las Vegas-Henderson-Paradise, NV
- Households without running water (per 1,000 households): 6.3
- Total households without running water: 5,107
- Households without complete plumbing (per 1,000 households): 8.0
- Total households without complete plumbing: 6,471
- Median household income: $61,000
- Poverty rate: 12.8%
- Minority population share: 58.7%
Detailed Findings & Methodology
To find the metropolitan areas where the most residents lack running water, researchers at Construction Coverage analyzed the data from the U.S. Census Bureau’s 2019 American Community Survey Public Use Microdata Sample. The researchers ranked metro areas according to the proportion of households lacking running water—a statistic that includes both hot and cold running water. In the event of a tie, the metro with the greater proportion of households lacking complete indoor plumbing was ranked higher. Researchers also calculated median household income, the poverty rate, and the minority population share (percentage of the population that is not non-Hispanic white).
To improve relevance, only metropolitan areas with at least 100,000 people were included in the analysis. Additionally, metro areas were grouped into the following cohorts based on population size:
- Small metros: 100,000-349,999
- Midsize metros: 350,000-999,999
- Large metros: 1,000,000 or more
Each company featured in our guides has been independently selected and reviewed by our research team. If you select one of these companies and click on a link, we may earn a commission.
By clicking on these links, you may be taken to one of our insurance partners. The specific company listed here may or may not be included in our partner’s network at this time.