
Baby Boomer-Dominant Housing Markets
Note: This is the most recent release of our Baby Boomer-Dominant Housing Markets study. To see data from previous years, please visit the Full Results section below.
Homeownership has long been a cornerstone of the American dream. But first-time home buyers, especially millennials, are facing an uphill battle when it comes to house hunting. This is in part because of a growing trend in which baby boomers, the generation that owns the largest share of American homes, are planning to stay put rather than downsize or move into alternative living arrangements.
In fact, a 2024 survey conducted by Redfin found that 78% of Americans over the age of 60 want to remain in their current home. This decision, driven by factors such as comfort, community ties, and financial stability, is contributing to a significant decrease in housing inventory available for first-time buyers. As a result, younger generations face more limited options, higher home prices, and increased competition for the few homes that do hit the market.
Composition of Homeownership by Age
Americans 55 years and older own the majority of U.S. homes
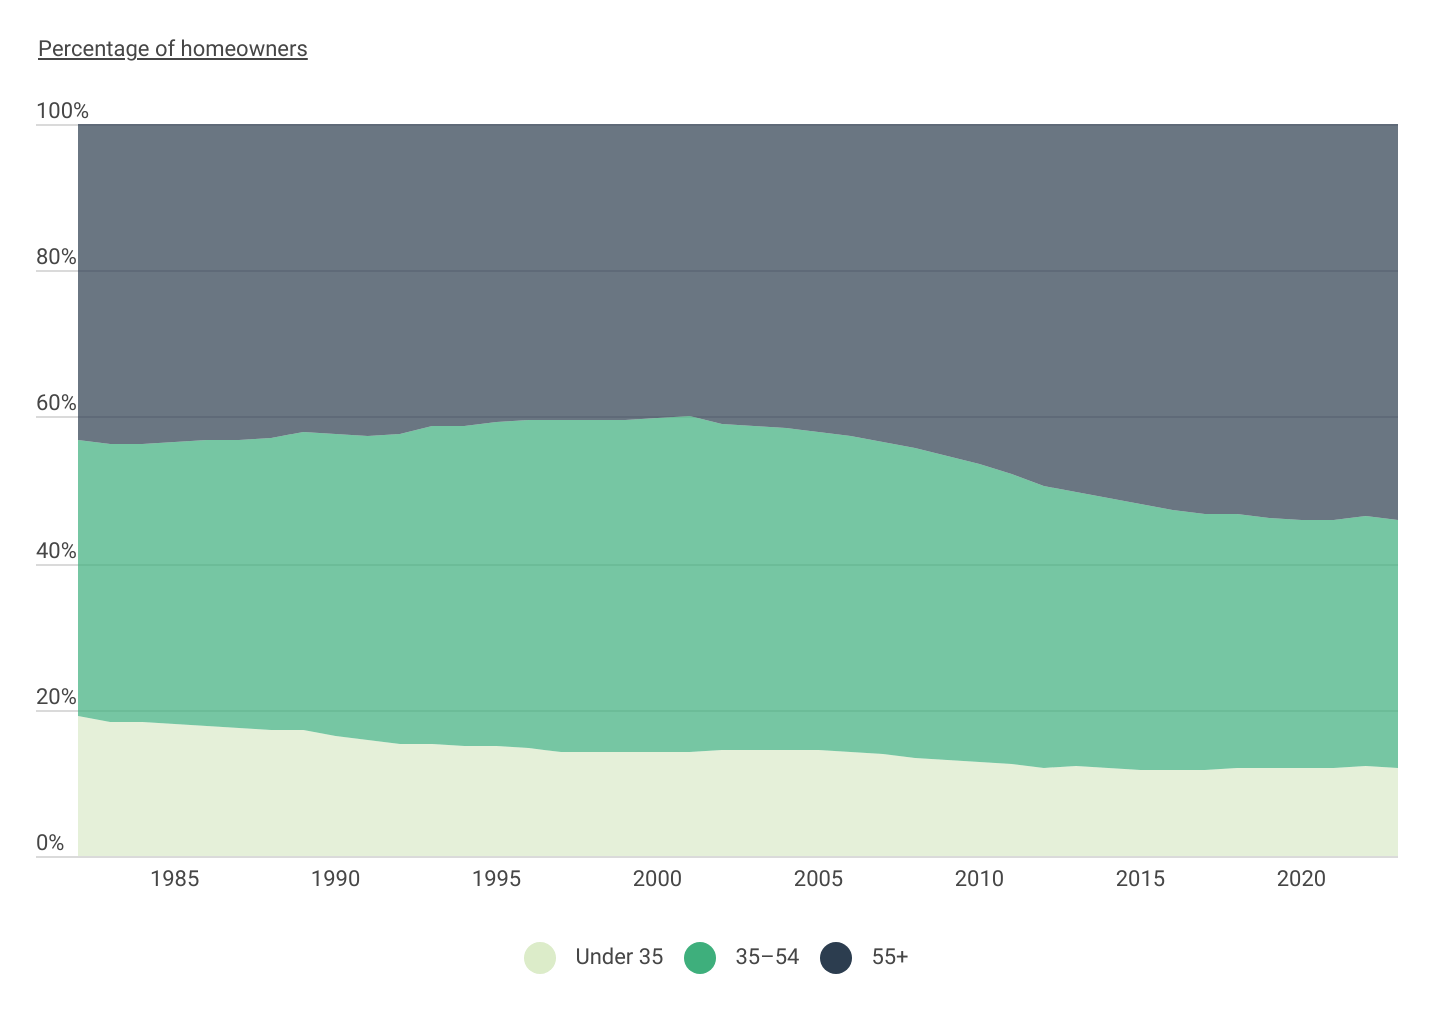
According to the U.S. Census Bureau, the share of homeowners over the age of 55 has been steadily increasing over the past 15 years. In 2008, at the onset of the Great Recession, Americans over the age of 55 owned 44.3% of homes. By 2023, that percentage had increased to 54.0%, reflecting older Americans’ growing dominance in the housing market.
Meanwhile, the share of homeowners under 35 remained relatively stable during this period, fluctuating only slightly. However, those in the 35 to 54 age group experienced a marked decline in homeownership, with their share dropping from 42.3% in 2008 to 34.0% in 2023. Notably, the rapid increase in over-55 homeownership may have reached its peak. The group’s share topped out at 54.2% in 2021, before settling back to 54.0% in 2023. This plateau suggests that the concentration of homeownership among older Americans may be stabilizing, albeit at historically high levels.
HOME IMPROVEMENT TIP
Planning a home renovation? Homeowners insurance policies likely won’t cover your home while it’s being renovated, so you should consider builders risk insurance for homeowners—designed specifically for the home while under construction or renovation.
Where Baby Boomers Own the Most Homes
Hawaii, Delaware, and Florida have the largest share of homes owned by baby boomers

While baby boomers—defined as Americans between the ages of 60 and 78 in 2024—comprise just over 20% of the U.S. population, they account for more than 37% of homeowners nationwide. This generational footprint is particularly pronounced in New England and select coastal states. New Hampshire (40.7%), Maine (40.4%), and Vermont (39.9%) boast some of the highest concentrations of baby boomer homeowners in the nation. However, Hawaii surpasses all states, with 42.9% of homeowners belonging to the baby boomer generation. Other notable states include Delaware (41.7%) and Florida (41.4%).
By contrast, Central and Mountain states have significantly lower concentrations of baby boomer homeowners. Utah, with its notably young population, reports just 29.8% of homeowners falling into this age group, the lowest in the nation. Texas, a magnet for younger demographics in recent years, also shows a relatively small share of baby boomer homeowners at 33.6%. Other states with low baby boomer representation include Colorado, North Dakota, and Indiana, all at just below 35%.
At the metropolitan level, warm-weather locations tend to attract more baby boomer homeowners. Tucson, AZ tops the list among major metro areas, with 41.9% of homeowners between their late 50s and late 70s. Florida cities such as Tampa-St. Petersburg-Clearwater (40.1%) and Jacksonville (39.6%) also rank among the highest. Beyond warmer climates, Rust Belt cities like Pittsburgh, PA and Cleveland, OH report high concentrations of older homeowners as well, both at around 39%.
Below is a complete breakdown of baby boomer homeownership percentages across more than 250 metropolitan areas and all 50 states. The analysis was conducted by researchers at Construction Coverage, using data from the U.S. Census Bureau and Zillow. For more information, refer to the methodology section.
Cities With the Most Baby Boomer Homeowners
| Top Large Metros | Percentage* |
|---|---|
| 1. Tucson, AZ | 41.9% |
| 2. Tampa-St. Petersburg-Clearwater, FL | 40.1% |
| 3. Pittsburgh, PA | 39.6% |
| 4. Jacksonville, FL | 39.6% |
| 5. Richmond, VA | 39.0% |
| 6. Cleveland, OH | 38.9% |
| 7. Memphis, TN-MS-AR | 38.7% |
| 8. Los Angeles-Long Beach-Anaheim, CA | 38.7% |
| 9. Miami-Fort Lauderdale-West Palm Beach, FL | 38.6% |
| 10. Rochester, NY | 38.5% |
| 11. Buffalo-Cheektowaga, NY | 38.3% |
| 12. Las Vegas-Henderson-North Las Vegas, NV | 38.0% |
| 13. San Diego-Chula Vista-Carlsbad, CA | 38.0% |
| 14. New York-Newark-Jersey City, NY-NJ | 37.9% |
| 15. Hartford-West Hartford-East Hartford, CT | 37.8% |
| Bottom Large Metros | Percentage* |
|---|---|
| 1. Salt Lake City-Murray, UT | 29.6% |
| 2. Austin-Round Rock-San Marcos, TX | 30.1% |
| 3. Raleigh-Cary, NC | 31.1% |
| 4. Dallas-Fort Worth-Arlington, TX | 32.1% |
| 5. Indianapolis-Carmel-Greenwood, IN | 32.4% |
| 6. Houston-Pasadena-The Woodlands, TX | 32.7% |
| 7. Seattle-Tacoma-Bellevue, WA | 32.8% |
| 8. Atlanta-Sandy Springs-Roswell, GA | 33.4% |
| 9. Denver-Aurora-Centennial, CO | 33.4% |
| 10. Charlotte-Concord-Gastonia, NC-SC | 33.6% |
| 11. Washington-Arlington-Alexandria, DC-VA-MD-WV | 33.9% |
| 12. Minneapolis-St. Paul-Bloomington, MN-WI | 33.9% |
| 13. Fresno, CA | 34.2% |
| 14. Nashville-Davidson–Murfreesboro–Franklin, TN | 34.2% |
| 15. Kansas City, MO-KS | 34.7% |
| Top Midsize Metros | Percentage* |
|---|---|
| 1. North Port-Bradenton-Sarasota, FL | 49.8% |
| 2. Myrtle Beach-Conway-North Myrtle Beach, SC | 48.5% |
| 3. Naples-Marco Island, FL | 47.7% |
| 4. Deltona-Daytona Beach-Ormond Beach, FL | 47.3% |
| 5. Port St. Lucie, FL | 47.3% |
| 6. Ocala, FL | 46.9% |
| 7. Cape Coral-Fort Myers, FL | 46.4% |
| 8. Palm Bay-Melbourne-Titusville, FL | 45.7% |
| 9. Wilmington, NC | 45.6% |
| 10. Santa Rosa-Petaluma, CA | 44.3% |
| 11. Santa Maria-Santa Barbara, CA | 44.2% |
| 12. Atlantic City-Hammonton, NJ | 44.0% |
| 13. Eugene-Springfield, OR | 43.7% |
| 14. Asheville, NC | 43.3% |
| 15. Salinas, CA | 42.7% |
| Bottom Midsize Metros | Percentage* |
|---|---|
| 1. Provo-Orem-Lehi, UT | 26.8% |
| 2. Ogden, UT | 28.5% |
| 3. Greeley, CO | 29.4% |
| 4. McAllen-Edinburg-Mission, TX | 31.5% |
| 5. Fort Wayne, IN | 32.2% |
| 6. Visalia, CA | 32.8% |
| 7. Des Moines-West Des Moines, IA | 32.8% |
| 8. Omaha, NE-IA | 33.4% |
| 9. Fayetteville, NC | 33.6% |
| 10. Bakersfield-Delano, CA | 33.8% |
| 11. Stockton-Lodi, CA | 34.0% |
| 12. El Paso, TX | 34.0% |
| 13. Fayetteville-Springdale-Rogers, AR | 34.1% |
| 14. Colorado Springs, CO | 34.5% |
| 15. Baton Rouge, LA | 35.2% |
| Top Small Metros | Percentage* |
|---|---|
| 1. Wildwood-The Villages, FL | 58.6% |
| 2. Punta Gorda, FL | 53.0% |
| 3. Lake Havasu City-Kingman, AZ | 52.2% |
| 4. Barnstable Town, MA | 52.1% |
| 5. Sebastian-Vero Beach-West Vero Corridor, FL | 52.0% |
| 6. San Luis Obispo-Paso Robles, CA | 50.5% |
| 7. Homosassa Springs, FL | 50.2% |
| 8. Santa Cruz-Watsonville, CA | 46.6% |
| 9. Napa, CA | 45.5% |
| 10. Santa Fe, NM | 44.9% |
| 11. Pittsfield, MA | 44.5% |
| 12. Daphne-Fairhope-Foley, AL | 43.8% |
| 13. Medford, OR | 43.4% |
| 14. Mount Vernon-Anacortes, WA | 43.3% |
| 15. Coeur d’Alene, ID | 43.1% |
| Bottom Small Metros | Percentage* |
|---|---|
| 1. Midland, TX | 23.9% |
| 2. Hanford-Corcoran, CA | 25.5% |
| 3. Odessa, TX | 26.2% |
| 4. Laredo, TX | 28.7% |
| 5. Jonesboro, AR | 31.1% |
| 6. Lexington Park, MD | 32.3% |
| 7. Bozeman, MT | 33.2% |
| 8. Yuba City, CA | 33.7% |
| 9. Kalamazoo-Portage, MI | 33.7% |
| 10. Ames, IA | 33.8% |
| 11. Lawrence, KS | 33.9% |
| 12. Hattiesburg, MS | 34.1% |
| 13. Manhattan, KS | 34.3% |
| 14. Merced, CA | 34.4% |
| 15. Elkhart-Goshen, IN | 34.5% |
TRENDING GUIDES ON CONSTRUCTION COVERAGE
States With the Most Baby Boomer Homeowners
| Top States | Percentage* |
|---|---|
| 1. Hawaii | 42.9% |
| 2. Delaware | 41.7% |
| 3. Florida | 41.4% |
| 4. New Hampshire | 40.7% |
| 5. Maine | 40.4% |
| 6. New Mexico | 40.2% |
| 7. Montana | 40.0% |
| 8. Vermont | 39.9% |
| 9. West Virginia | 39.3% |
| 10. South Carolina | 39.3% |
| 11. Arizona | 39.3% |
| 12. Nevada | 39.2% |
| 13. Massachusetts | 38.7% |
| 14. Pennsylvania | 38.6% |
| 15. Oregon | 38.6% |
| Bottom States | Percentage* |
|---|---|
| 1. Utah | 29.8% |
| 2. Texas | 33.6% |
| 3. Colorado | 34.9% |
| 4. North Dakota | 34.9% |
| 5. Indiana | 34.9% |
| 6. Georgia | 35.4% |
| 7. Iowa | 35.4% |
| 8. Minnesota | 35.6% |
| 9. Nebraska | 35.8% |
| 10. South Dakota | 35.9% |
| 11. Illinois | 36.0% |
| 12. Kansas | 36.4% |
| 13. Maryland | 36.7% |
| 14. Washington | 36.8% |
| 15. Louisiana | 36.8% |
*Percentage of homeowners that are baby boomers
Full Results
Methodology
The data used in this study is from the U.S. Census Bureau’s American Community Survey 2023 1-Year Estimates and Zillow’s Zillow Home Value Index (ZHVI). To determine the locations with the most baby boomer-dominant housing markets, researchers at Construction Coverage ranked locations on the percentage of owner-occupied households that are headed by baby boomers. In the event of a tie, the location with the larger baby boomer population share was ranked higher. Baby boomers were considered those ages 59–77 in the year 2023, and median home prices were calculated using Zillow data from October 2024.
To improve relevance, only metropolitan areas with complete data were included. Additionally, metros were grouped into cohorts based on population: small (under 350,000), midsize (350,000–999,999), and large (1,000,000 or more).
References
- Anderson, D. Redfin. (2024, April 2). ‘Til Death Do Us Part: More Than Three-Quarters of Baby Boomers Plan to Stay In Their Home As They Grow Older. Retrieved on November 18, 2024 from https://www.redfin.com/news/baby-boomers-aging-in-place/.
- Statista. (2024, July 5). Population distribution in the United States in 2023, by generation. Retrieved on November 18, 2024 from https://www.statista.com/statistics/296974/us-population-share-by-generation/.
- U.S. Census Bureau. (2023). American Community Survey 1-Year Estimates [Data set]. Retrieved November on 18, 2024 from https://www.census.gov/programs-surveys/acs.
- Zillow. (2024). Zillow Home Value Index [Data set]. Retrieved on November 18, 2024 from https://www.zillow.com/research/data/.