
Where Are Millennials Buying Homes in the U.S.?
Note: This is the most recent release of our Where Are Millennials Buying Homes in the U.S.? study. To see data from prior years, please visit the Full Results section below.
According to the National Association of Realtors, the median age of first-time homebuyers is 35 years old, which means that the millennial generation—generally regarded as individuals born between 1981 and 1996—has reached the stage in their lives where buying a home is often a top priority. Yet recently, the cost of homeownership has skyrocketed in large part due to an adverse combination of high interest rates and scarce inventory, leaving millennials with a daunting homeownership outlook.
U.S. Mortgage Originations Over Time
U.S. mortgage originations have dropped to multi-decade lows following the COVID-19 surge
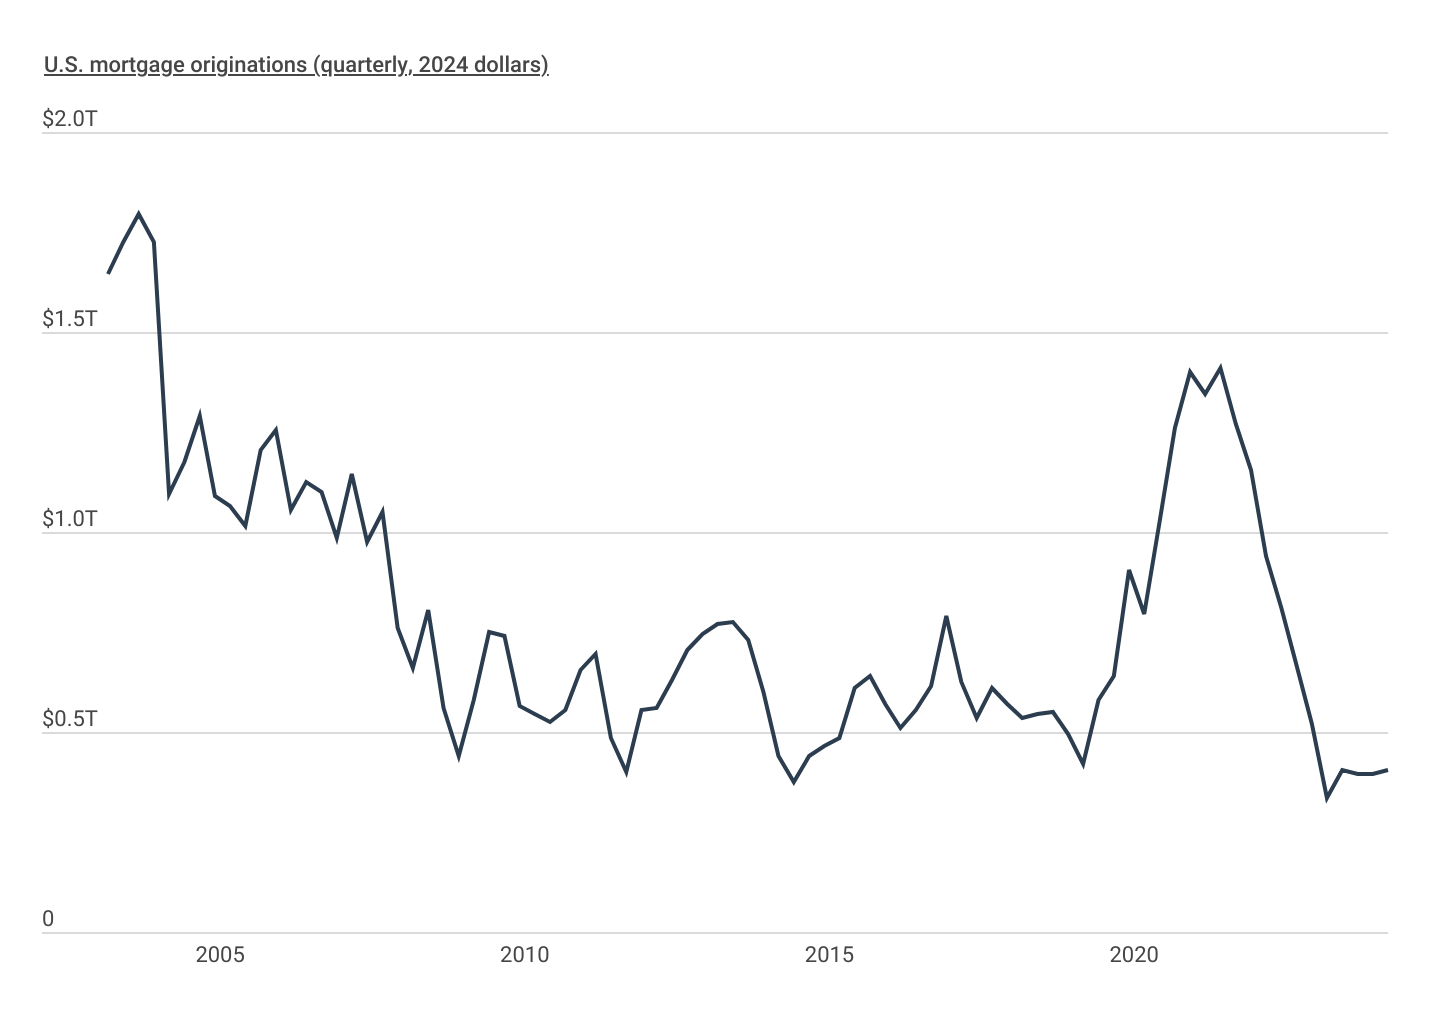
This difficult homebuying landscape has resulted in a dramatic shift in mortgage originations. Prior to the COVID-19 pandemic, U.S. mortgage originations were already on the rise—climbing from $422 billion in Q1 2019 (after adjusting for inflation) to a 14-year high of nearly $907 billion in Q4 2019. After a brief dip due to pandemic-era stay-at-home orders and social distancing, originated mortgage volume skyrocketed to a new high of over $1.4 trillion in Q2 2021. This abrupt growth is mostly attributed to historically low interest rates, low inventory, and an increased desire for more space amid the pandemic.
However, these conditions were short-lived. Elevated interest rates combined with other forces, such as return-to-office mandates, brought inflation-adjusted mortgage originations down to just $334 billion in Q1 2023, the lowest levels in over two decades. As of Q1 2024, originations remain near historical lows at $403 billion.
FOR HOMEOWNERS
Are you considering increasing the value of your home with a renovated bathroom or an upgraded kitchen? Be sure to consider builders risk insurance for homeowners, which will provide coverage for your home while it’s under renovation—when most homeowners insurance policies won’t have you covered.
Residential Mortgage Characteristics by Applicant Age
Millennials are buying homes with larger loan-to-value ratios than older generations
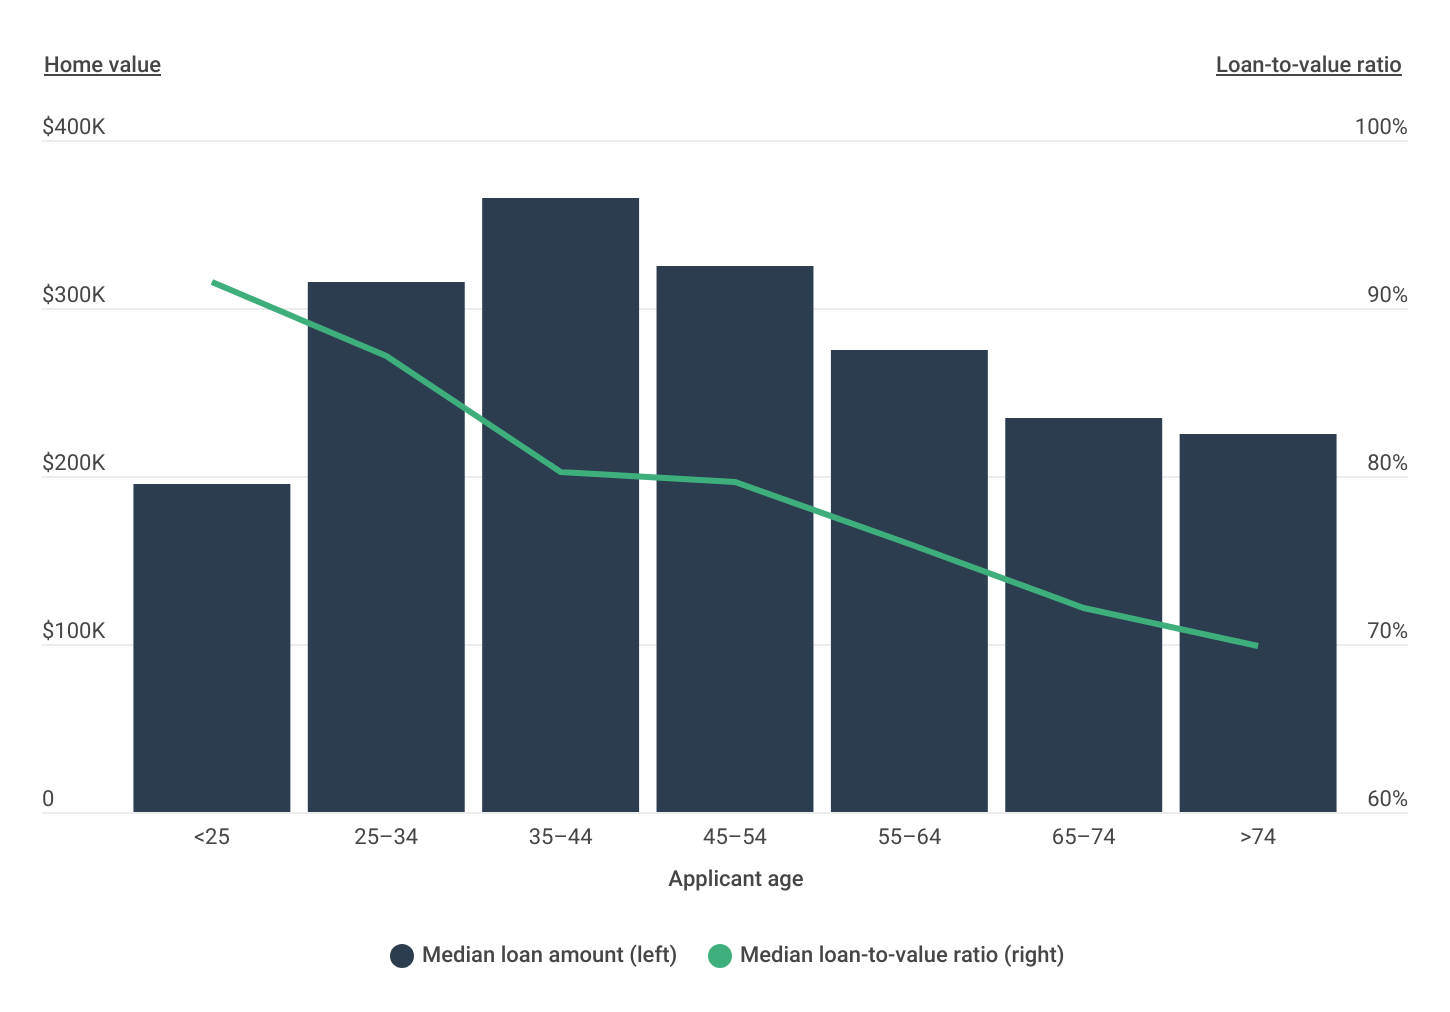
In order to cope with rising prices, millennials are taking out larger home loans. In 2022, the median loan amount for mortgages taken out by applicants age 25–34 was $315,000, and $365,000 for applicants age 35–44, higher than any other age group. Similarly, the loan-to-value ratio—or the amount of the mortgage compared to the sale price of the home—was 87% for 25- to 34-year-olds and 80% for 35- to 44-year-olds. Inherently, many millennials are first-time homebuyers and typically have less existing home equity to apply to new mortgages. Additionally, millennials are at the stage of their lives where they may be supporting a growing family and require more living space compared to older generations.
Geographical Differences in Millennial Home Purchase Loans
Massachusetts millennials accounted for 64.2% of home purchases in 2023
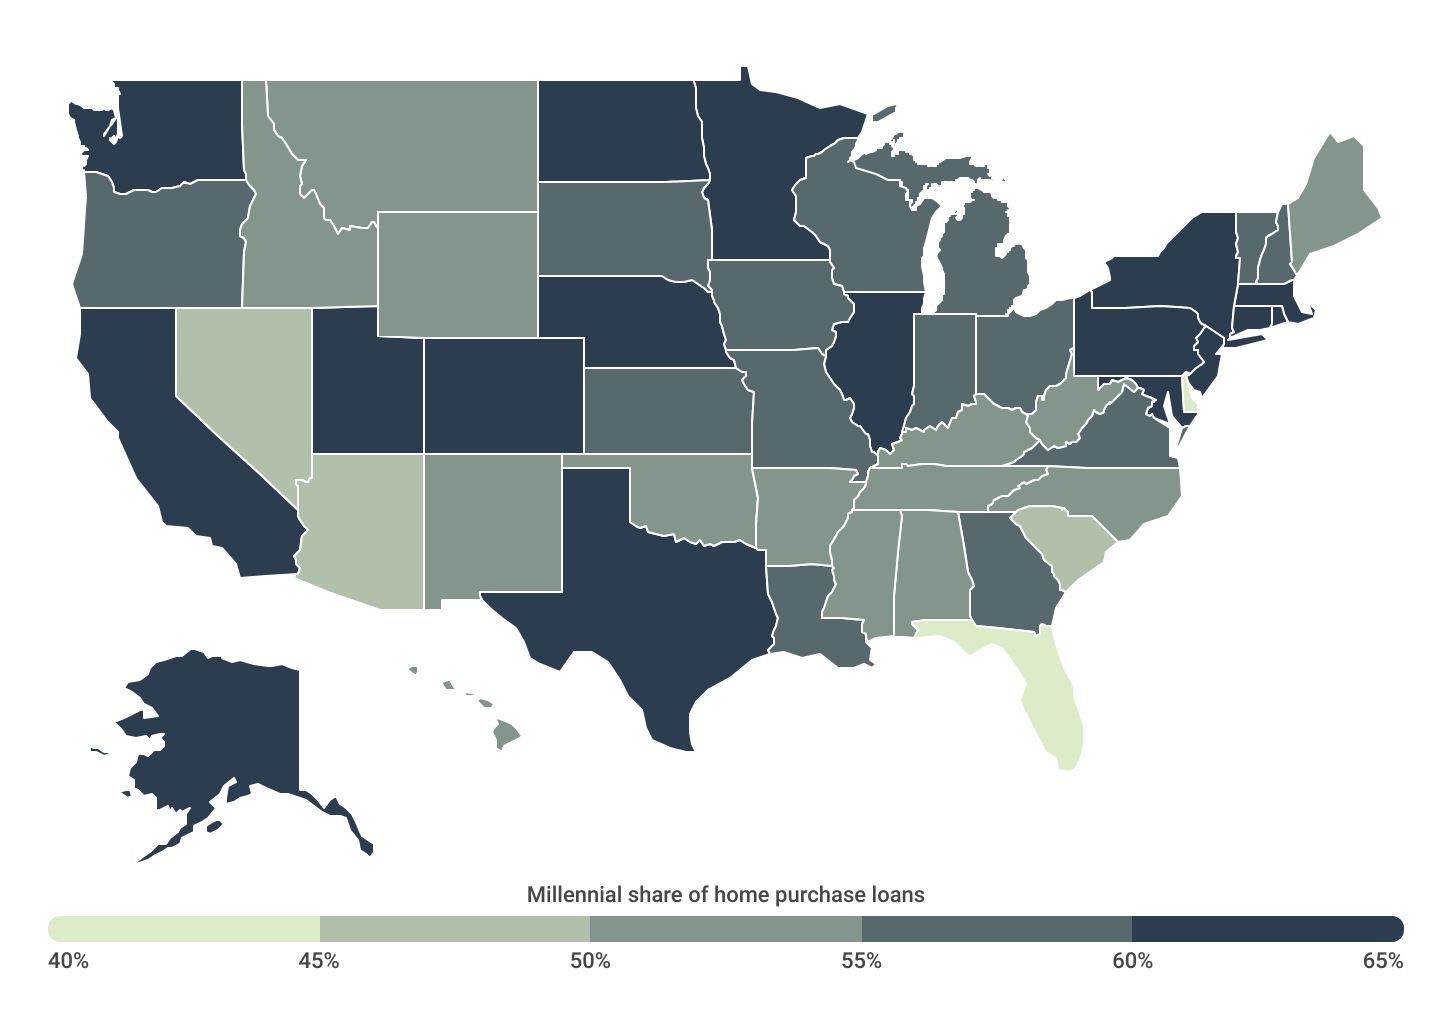
Despite the overall decline in home buying across the country, millennials still account for the majority of home purchase loans in 2023. However, millennial home purchasing varies by location. Millennials in northeastern states account for the largest share of home purchase loans, with Massachusetts (64.2%), New York (63.8%), and New Jersey (63.3%) leading the country. Midwestern states such as Illinois (62.5%), Minnesota (62.2%), and Nebraska (61.4%) also rank among the top 10 states for millennial home buying. On the other end of the spectrum, Delaware (40.6%), Florida (44.6%), and South Carolina (45.7%) have the lowest share of home purchase loans taken out by millennials and have notably older populations.
Below is a complete breakdown of where millennials are buying homes for over 380 metropolitan areas and all 50 states. The analysis was conducted by researchers at Construction Coverage, using data from the Federal Financial Institutions Examination Council’s Home Mortgage Disclosure Act dataset. For more information, see the methodology section below.
Large Metros Where Millennials Are Buying Homes
| Top Metros | Millennial Share* |
|---|---|
| 1. San Jose-Sunnyvale-Santa Clara, CA | 73.5% |
| 2. San Francisco-Oakland-Berkeley, CA | 69.1% |
| 3. Seattle-Tacoma-Bellevue, WA | 68.7% |
| 4. Austin-Round Rock-Georgetown, TX | 68.7% |
| 5. Boston-Cambridge-Newton, MA-NH | 66.9% |
| 6. Philadelphia-Camden-Wilmington, PA-NJ-DE-MD | 66.0% |
| 7. Buffalo-Cheektowaga, NY | 66.0% |
| 8. Denver-Aurora-Lakewood, CO | 65.9% |
| 9. Pittsburgh, PA | 65.4% |
| 10. New York-Newark-Jersey City, NY-NJ-PA | 65.0% |
| 11. Hartford-East Hartford-Middletown, CT | 64.7% |
| 12. Minneapolis-St. Paul-Bloomington, MN-WI | 64.6% |
| 13. Washington-Arlington-Alexandria, DC-VA-MD-WV | 64.5% |
| 14. Chicago-Naperville-Elgin, IL-IN-WI | 64.4% |
| 15. Dallas-Fort Worth-Arlington, TX | 64.1% |
| Bottom Metros | Millennial Share* |
|---|---|
| 1. Tucson, AZ | 45.2% |
| 2. Las Vegas-Henderson-Paradise, NV | 48.4% |
| 3. Jacksonville, FL | 49.0% |
| 4. Phoenix-Mesa-Chandler, AZ | 49.1% |
| 5. Tampa-St. Petersburg-Clearwater, FL | 50.3% |
| 6. Orlando-Kissimmee-Sanford, FL | 51.4% |
| 7. Virginia Beach-Norfolk-Newport News, VA-NC | 52.2% |
| 8. Miami-Fort Lauderdale-Pompano Beach, FL | 52.3% |
| 9. Riverside-San Bernardino-Ontario, CA | 54.1% |
| 10. San Antonio-New Braunfels, TX | 55.7% |
| 11. Tulsa, OK | 55.8% |
| 12. Memphis, TN-MS-AR | 57.1% |
| 13. Birmingham-Hoover, AL | 57.4% |
| 14. Oklahoma City, OK | 57.5% |
| 15. Louisville/Jefferson County, KY-IN | 57.6% |
FOR HOMEOWNERS
If you’re renting out your property, choosing the best commercial building insurance can be a game-changer. Learn how it provides protection not offered by standard home insurance.
States Where Millennials Are Buying Homes
| Top States | Millennial Share* |
|---|---|
| 1. Massachusetts | 64.2% |
| 2. New York | 63.8% |
| 3. New Jersey | 63.3% |
| 4. Connecticut | 62.8% |
| 5. Illinois | 62.5% |
| 6. Minnesota | 62.2% |
| 7. Alaska | 62.1% |
| 8. Pennsylvania | 61.8% |
| 9. Nebraska | 61.4% |
| 10. California | 61.0% |
| 11. North Dakota | 61.0% |
| 12. Maryland | 60.9% |
| 13. Texas | 60.7% |
| 14. Washington | 60.6% |
| 15. Colorado | 60.1% |
| Bottom States | Millennial Share* |
|---|---|
| 1. Delaware | 40.6% |
| 2. Florida | 44.6% |
| 3. South Carolina | 45.7% |
| 4. Arizona | 46.1% |
| 5. Nevada | 48.1% |
| 6. Hawaii | 50.0% |
| 7. Mississippi | 50.5% |
| 8. Alabama | 50.5% |
| 9. New Mexico | 50.8% |
| 10. Maine | 52.3% |
| 11. Wyoming | 52.6% |
| 12. Arkansas | 52.8% |
| 13. Idaho | 53.0% |
| 14. West Virginia | 53.1% |
| 15. Montana | 53.8% |
*Millennial share of home purchase loans
Full Results
Methodology
The data used in this analysis is from the Federal Financial Institutions Examination Council’s 2023 Home Mortgage Disclosure Act. To determine the locations where millennials are buying homes, researchers at Construction Coverage calculated the millennial share of conventional home purchase loans originated in 2023. In the event of a tie, the location with the greater total number of millennial home purchase loans was ranked higher. Due to limitations in the dataset, the millennial generation was approximated as being age 25–44 in the year 2023—the combination of the 25–34 and 35–44 age cohorts. In a prior version of this analysis, the millennial generation was approximated using only the 25–34 age cohort in 2020 since this best represented the generation at the time.
To improve relevance, only metropolitan areas with at least 100,000 residents were included. Additionally, metros were grouped into cohorts based on population size: small (less than 350,000), midsize (350,000–999,999), and large (1,000,000 or more).
References
- National Association of Realtors. (2023). 2023 Profile of Home Buyers and Sellers. Retrieved on September 4, 2024 from https://www.nar.realtor/sites/default/files/documents/2023-profile-of-home-buyers-and-sellers-highlights-11-13-2023.pdf?mf_ct_campaign=yahoo-synd-feed&utm_content=syndication.
- Freddie Mac. (2024, August 29). 30-Year Fixed Rate Mortgage Average in the United States. Retrieved on September 4, 2024 from https://fred.stlouisfed.org/series/MORTGAGE30US.
- National Association of Realtors. (2023, June). Housing Affordability & Supply Report. Retrieved on September 4, 2024 from https://cdn.nar.realtor//sites/default/files/documents/2023-housing-affordability-and-supply-report-06-08-2023.pdf?_gl=1*1w6eqof*_gcl_au*MTY2OTI3OTI2Ni4xNjkxNTkzODY0.
- Peck, Emily. Axios. (2023, June 13). Companies get aggressive on return-to-office. Retrieved on September 4, 2024 from https://www.axios.com/2023/06/13/companies-aggressive-return-to-office.
- National Association of Realtors. (2024). 2024 Home Buyers and Sellers Generational Trends Report. Retrieved on September 4, 2024 from https://www.nar.realtor/sites/default/files/documents/2024-home-buyers-and-sellers-generational-trends-04-03-2024.pdf.
- Federal Financial Institutions Examination Council. (2023). Home Mortgage Disclosure Act [Data set]. Retrieved on September 4, 2024 from https://ffiec.cfpb.gov/.