
The Best-Paying Cities for Construction Workers
Note: This is the most recent release of our Best-Paying Cities for Construction Workers study. To see data from previous years, please visit the Full Results section below.
The U.S. construction industry is navigating a period of heightened uncertainty in 2025, marked by shifting trade policies, restrictive immigration enforcement, and persistently high interest rates. New tariffs on imported steel and aluminum have driven up the cost of materials, delaying projects and prompting redesigns, while a tight labor market and evolving immigration rules have strained the industry’s ability to find skilled workers. At the same time, high borrowing costs continue to limit new development, especially in residential construction. For many construction workers, these economic headwinds are compounded by chronic inflationary pressures that continue to erode the purchasing power of their wages.
Against this backdrop, analysts at Construction Coverage analyzed wage data from the U.S. Bureau of Labor Statistics and cost of living data from the Bureau of Economic Analysis to determine where in the country construction workers earn the most—and least—once local price differences are taken into account. This report highlights the states and cities where workers in the building trades can stretch their earnings furthest and live most comfortably in the current economic climate.
Key Takeaways
- Construction employment has stabilized in early 2025 after a strong post-pandemic recovery, reflecting broader economic uncertainty.
- Construction workers are relatively well compensated, earning a median annual wage of $58,360—about 18% higher than the $49,500 median for all U.S. workers.
- Wage growth in construction has outpaced the national average, with a 15.4% increase over two years compared to 6.9% for all occupations.
- Midwestern states offer the best cost-adjusted wages, with Illinois leading at over $79,000 annually, while Southern states rank consistently lower.
- Metro-level trends mirror state patterns, though several high-cost coastal cities—like San Jose and Boston—also offer competitive adjusted wages.
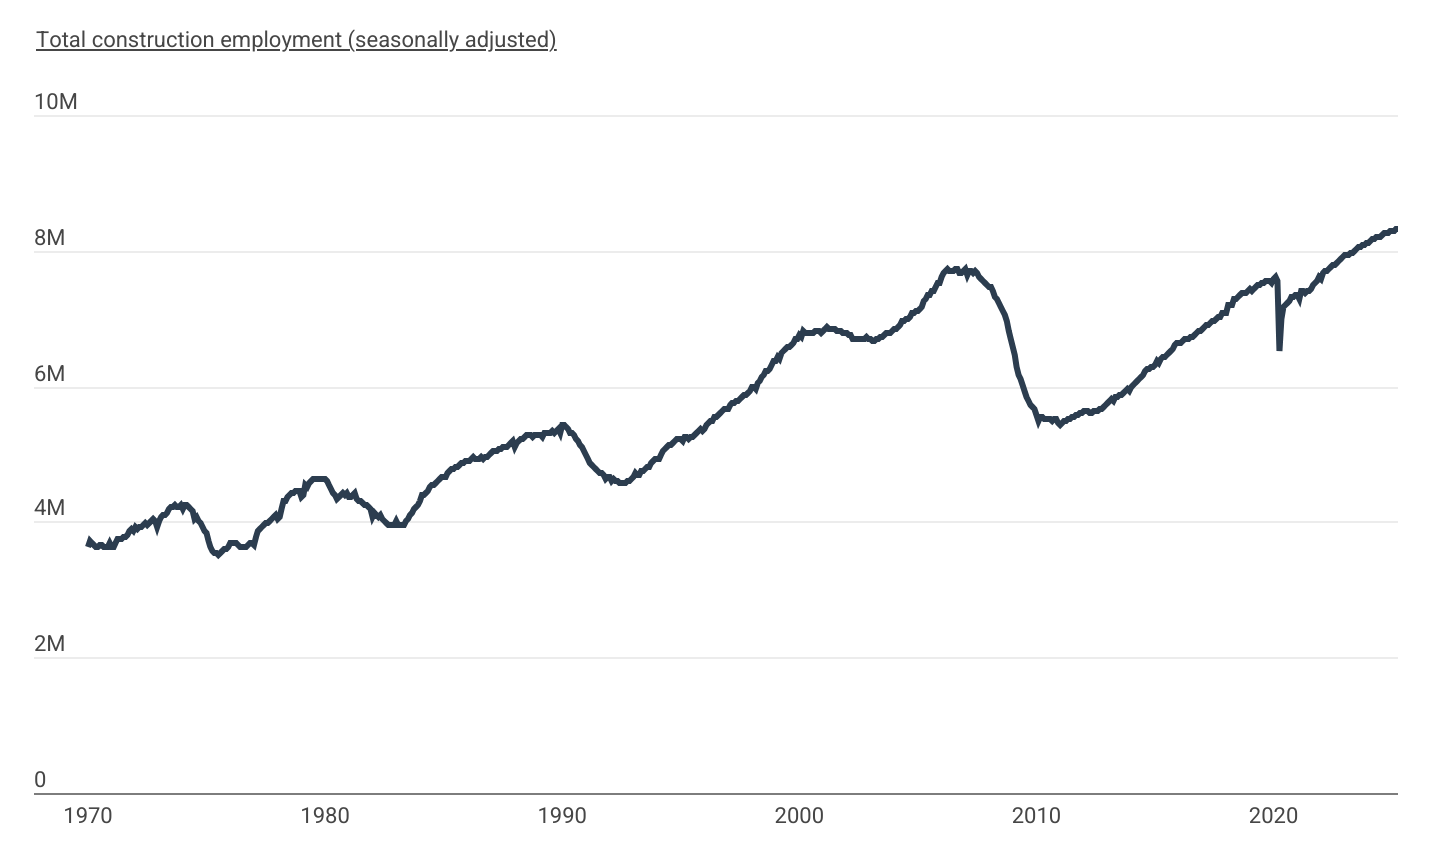
Cyclical Changes in Construction Employment
Total construction industry employment appears to be leveling off
Data: Total Construction Employment Time Series
| Date | Construction employment |
|---|---|
| 1/1/1970 | 3,615,000 |
| 2/1/1970 | 3,703,000 |
| 3/1/1970 | 3,697,000 |
| 4/1/1970 | 3,669,000 |
| 5/1/1970 | 3,634,000 |
| 6/1/1970 | 3,636,000 |
| 7/1/1970 | 3,645,000 |
| 8/1/1970 | 3,649,000 |
| 9/1/1970 | 3,618,000 |
| 10/1/1970 | 3,626,000 |
| 11/1/1970 | 3,643,000 |
| 12/1/1970 | 3,688,000 |
| 1/1/1971 | 3,643,000 |
| 2/1/1971 | 3,633,000 |
| 3/1/1971 | 3,674,000 |
| 4/1/1971 | 3,735,000 |
| 5/1/1971 | 3,750,000 |
| 6/1/1971 | 3,759,000 |
| 7/1/1971 | 3,786,000 |
| 8/1/1971 | 3,786,000 |
| 9/1/1971 | 3,820,000 |
| 10/1/1971 | 3,867,000 |
| 11/1/1971 | 3,903,000 |
| 12/1/1971 | 3,867,000 |
| 1/1/1972 | 3,912,000 |
| 2/1/1972 | 3,888,000 |
| 3/1/1972 | 3,921,000 |
| 4/1/1972 | 3,931,000 |
| 5/1/1972 | 3,957,000 |
| 6/1/1972 | 3,969,000 |
| 7/1/1972 | 3,939,000 |
| 8/1/1972 | 3,983,000 |
| 9/1/1972 | 4,000,000 |
| 10/1/1972 | 4,038,000 |
| 11/1/1972 | 4,002,000 |
| 12/1/1972 | 3,937,000 |
| 1/1/1973 | 4,004,000 |
| 2/1/1973 | 4,071,000 |
| 3/1/1973 | 4,089,000 |
| 4/1/1973 | 4,106,000 |
| 5/1/1973 | 4,137,000 |
| 6/1/1973 | 4,193,000 |
| 7/1/1973 | 4,232,000 |
| 8/1/1973 | 4,233,000 |
| 9/1/1973 | 4,237,000 |
| 10/1/1973 | 4,232,000 |
| 11/1/1973 | 4,232,000 |
| 12/1/1973 | 4,239,000 |
| 1/1/1974 | 4,196,000 |
| 2/1/1974 | 4,259,000 |
| 3/1/1974 | 4,255,000 |
| 4/1/1974 | 4,225,000 |
| 5/1/1974 | 4,198,000 |
| 6/1/1974 | 4,146,000 |
| 7/1/1974 | 4,045,000 |
| 8/1/1974 | 4,059,000 |
| 9/1/1974 | 4,009,000 |
| 10/1/1974 | 3,972,000 |
| 11/1/1974 | 3,911,000 |
| 12/1/1974 | 3,860,000 |
| 1/1/1975 | 3,841,000 |
| 2/1/1975 | 3,718,000 |
| 3/1/1975 | 3,628,000 |
| 4/1/1975 | 3,565,000 |
| 5/1/1975 | 3,552,000 |
| 6/1/1975 | 3,526,000 |
| 7/1/1975 | 3,501,000 |
| 8/1/1975 | 3,547,000 |
| 9/1/1975 | 3,573,000 |
| 10/1/1975 | 3,587,000 |
| 11/1/1975 | 3,604,000 |
| 12/1/1975 | 3,641,000 |
| 1/1/1976 | 3,688,000 |
| 2/1/1976 | 3,687,000 |
| 3/1/1976 | 3,685,000 |
| 4/1/1976 | 3,684,000 |
| 5/1/1976 | 3,649,000 |
| 6/1/1976 | 3,632,000 |
| 7/1/1976 | 3,627,000 |
| 8/1/1976 | 3,632,000 |
| 9/1/1976 | 3,634,000 |
| 10/1/1976 | 3,645,000 |
| 11/1/1976 | 3,678,000 |
| 12/1/1976 | 3,688,000 |
| 1/1/1977 | 3,660,000 |
| 2/1/1977 | 3,775,000 |
| 3/1/1977 | 3,859,000 |
| 4/1/1977 | 3,904,000 |
| 5/1/1977 | 3,930,000 |
| 6/1/1977 | 3,962,000 |
| 7/1/1977 | 3,981,000 |
| 8/1/1977 | 3,995,000 |
| 9/1/1977 | 4,023,000 |
| 10/1/1977 | 4,034,000 |
| 11/1/1977 | 4,058,000 |
| 12/1/1977 | 4,087,000 |
| 1/1/1978 | 4,029,000 |
| 2/1/1978 | 4,058,000 |
| 3/1/1978 | 4,178,000 |
| 4/1/1978 | 4,308,000 |
| 5/1/1978 | 4,302,000 |
| 6/1/1978 | 4,379,000 |
| 7/1/1978 | 4,403,000 |
| 8/1/1978 | 4,420,000 |
| 9/1/1978 | 4,424,000 |
| 10/1/1978 | 4,447,000 |
| 11/1/1978 | 4,453,000 |
| 12/1/1978 | 4,450,000 |
| 1/1/1979 | 4,373,000 |
| 2/1/1979 | 4,389,000 |
| 3/1/1979 | 4,552,000 |
| 4/1/1979 | 4,516,000 |
| 5/1/1979 | 4,565,000 |
| 6/1/1979 | 4,604,000 |
| 7/1/1979 | 4,621,000 |
| 8/1/1979 | 4,634,000 |
| 9/1/1979 | 4,625,000 |
| 10/1/1979 | 4,620,000 |
| 11/1/1979 | 4,617,000 |
| 12/1/1979 | 4,630,000 |
| 1/1/1980 | 4,625,000 |
| 2/1/1980 | 4,605,000 |
| 3/1/1980 | 4,548,000 |
| 4/1/1980 | 4,473,000 |
| 5/1/1980 | 4,434,000 |
| 6/1/1980 | 4,395,000 |
| 7/1/1980 | 4,351,000 |
| 8/1/1980 | 4,377,000 |
| 9/1/1980 | 4,401,000 |
| 10/1/1980 | 4,411,000 |
| 11/1/1980 | 4,409,000 |
| 12/1/1980 | 4,415,000 |
| 1/1/1981 | 4,374,000 |
| 2/1/1981 | 4,357,000 |
| 3/1/1981 | 4,396,000 |
| 4/1/1981 | 4,414,000 |
| 5/1/1981 | 4,343,000 |
| 6/1/1981 | 4,311,000 |
| 7/1/1981 | 4,299,000 |
| 8/1/1981 | 4,278,000 |
| 9/1/1981 | 4,254,000 |
| 10/1/1981 | 4,238,000 |
| 11/1/1981 | 4,209,000 |
| 12/1/1981 | 4,177,000 |
| 1/1/1982 | 4,069,000 |
| 2/1/1982 | 4,131,000 |
| 3/1/1982 | 4,108,000 |
| 4/1/1982 | 4,083,000 |
| 5/1/1982 | 4,092,000 |
| 6/1/1982 | 4,030,000 |
| 7/1/1982 | 4,001,000 |
| 8/1/1982 | 3,977,000 |
| 9/1/1982 | 3,962,000 |
| 10/1/1982 | 3,940,000 |
| 11/1/1982 | 3,947,000 |
| 12/1/1982 | 3,948,000 |
| 1/1/1983 | 4,021,000 |
| 2/1/1983 | 3,964,000 |
| 3/1/1983 | 3,942,000 |
| 4/1/1983 | 3,948,000 |
| 5/1/1983 | 3,960,000 |
| 6/1/1983 | 4,006,000 |
| 7/1/1983 | 4,055,000 |
| 8/1/1983 | 4,100,000 |
| 9/1/1983 | 4,138,000 |
| 10/1/1983 | 4,178,000 |
| 11/1/1983 | 4,217,000 |
| 12/1/1983 | 4,248,000 |
| 1/1/1984 | 4,305,000 |
| 2/1/1984 | 4,410,000 |
| 3/1/1984 | 4,393,000 |
| 4/1/1984 | 4,423,000 |
| 5/1/1984 | 4,456,000 |
| 6/1/1984 | 4,507,000 |
| 7/1/1984 | 4,534,000 |
| 8/1/1984 | 4,547,000 |
| 9/1/1984 | 4,576,000 |
| 10/1/1984 | 4,590,000 |
| 11/1/1984 | 4,617,000 |
| 12/1/1984 | 4,652,000 |
| 1/1/1985 | 4,668,000 |
| 2/1/1985 | 4,662,000 |
| 3/1/1985 | 4,730,000 |
| 4/1/1985 | 4,764,000 |
| 5/1/1985 | 4,787,000 |
| 6/1/1985 | 4,789,000 |
| 7/1/1985 | 4,799,000 |
| 8/1/1985 | 4,823,000 |
| 9/1/1985 | 4,852,000 |
| 10/1/1985 | 4,868,000 |
| 11/1/1985 | 4,879,000 |
| 12/1/1985 | 4,887,000 |
| 1/1/1986 | 4,908,000 |
| 2/1/1986 | 4,904,000 |
| 3/1/1986 | 4,914,000 |
| 4/1/1986 | 4,950,000 |
| 5/1/1986 | 4,924,000 |
| 6/1/1986 | 4,917,000 |
| 7/1/1986 | 4,930,000 |
| 8/1/1986 | 4,943,000 |
| 9/1/1986 | 4,939,000 |
| 10/1/1986 | 4,954,000 |
| 11/1/1986 | 4,960,000 |
| 12/1/1986 | 4,993,000 |
| 1/1/1987 | 5,007,000 |
| 2/1/1987 | 5,038,000 |
| 3/1/1987 | 5,039,000 |
| 4/1/1987 | 5,053,000 |
| 5/1/1987 | 5,080,000 |
| 6/1/1987 | 5,086,000 |
| 7/1/1987 | 5,092,000 |
| 8/1/1987 | 5,102,000 |
| 9/1/1987 | 5,096,000 |
| 10/1/1987 | 5,142,000 |
| 11/1/1987 | 5,152,000 |
| 12/1/1987 | 5,180,000 |
| 1/1/1988 | 5,094,000 |
| 2/1/1988 | 5,162,000 |
| 3/1/1988 | 5,201,000 |
| 4/1/1988 | 5,227,000 |
| 5/1/1988 | 5,228,000 |
| 6/1/1988 | 5,261,000 |
| 7/1/1988 | 5,270,000 |
| 8/1/1988 | 5,268,000 |
| 9/1/1988 | 5,270,000 |
| 10/1/1988 | 5,262,000 |
| 11/1/1988 | 5,273,000 |
| 12/1/1988 | 5,277,000 |
| 1/1/1989 | 5,289,000 |
| 2/1/1989 | 5,278,000 |
| 3/1/1989 | 5,260,000 |
| 4/1/1989 | 5,295,000 |
| 5/1/1989 | 5,299,000 |
| 6/1/1989 | 5,298,000 |
| 7/1/1989 | 5,317,000 |
| 8/1/1989 | 5,330,000 |
| 9/1/1989 | 5,323,000 |
| 10/1/1989 | 5,347,000 |
| 11/1/1989 | 5,364,000 |
| 12/1/1989 | 5,309,000 |
| 1/1/1990 | 5,422,000 |
| 2/1/1990 | 5,416,000 |
| 3/1/1990 | 5,392,000 |
| 4/1/1990 | 5,355,000 |
| 5/1/1990 | 5,321,000 |
| 6/1/1990 | 5,303,000 |
| 7/1/1990 | 5,274,000 |
| 8/1/1990 | 5,234,000 |
| 9/1/1990 | 5,197,000 |
| 10/1/1990 | 5,134,000 |
| 11/1/1990 | 5,095,000 |
| 12/1/1990 | 5,047,000 |
| 1/1/1991 | 4,972,000 |
| 2/1/1991 | 4,929,000 |
| 3/1/1991 | 4,881,000 |
| 4/1/1991 | 4,842,000 |
| 5/1/1991 | 4,800,000 |
| 6/1/1991 | 4,782,000 |
| 7/1/1991 | 4,752,000 |
| 8/1/1991 | 4,733,000 |
| 9/1/1991 | 4,728,000 |
| 10/1/1991 | 4,698,000 |
| 11/1/1991 | 4,640,000 |
| 12/1/1991 | 4,647,000 |
| 1/1/1992 | 4,667,000 |
| 2/1/1992 | 4,612,000 |
| 3/1/1992 | 4,621,000 |
| 4/1/1992 | 4,603,000 |
| 5/1/1992 | 4,605,000 |
| 6/1/1992 | 4,584,000 |
| 7/1/1992 | 4,570,000 |
| 8/1/1992 | 4,581,000 |
| 9/1/1992 | 4,584,000 |
| 10/1/1992 | 4,600,000 |
| 11/1/1992 | 4,606,000 |
| 12/1/1992 | 4,630,000 |
| 1/1/1993 | 4,664,000 |
| 2/1/1993 | 4,714,000 |
| 3/1/1993 | 4,676,000 |
| 4/1/1993 | 4,690,000 |
| 5/1/1993 | 4,753,000 |
| 6/1/1993 | 4,760,000 |
| 7/1/1993 | 4,783,000 |
| 8/1/1993 | 4,806,000 |
| 9/1/1993 | 4,823,000 |
| 10/1/1993 | 4,868,000 |
| 11/1/1993 | 4,887,000 |
| 12/1/1993 | 4,925,000 |
| 1/1/1994 | 4,940,000 |
| 2/1/1994 | 4,923,000 |
| 3/1/1994 | 4,990,000 |
| 4/1/1994 | 5,047,000 |
| 5/1/1994 | 5,084,000 |
| 6/1/1994 | 5,097,000 |
| 7/1/1994 | 5,125,000 |
| 8/1/1994 | 5,139,000 |
| 9/1/1994 | 5,175,000 |
| 10/1/1994 | 5,177,000 |
| 11/1/1994 | 5,210,000 |
| 12/1/1994 | 5,226,000 |
| 1/1/1995 | 5,234,000 |
| 2/1/1995 | 5,192,000 |
| 3/1/1995 | 5,242,000 |
| 4/1/1995 | 5,252,000 |
| 5/1/1995 | 5,220,000 |
| 6/1/1995 | 5,250,000 |
| 7/1/1995 | 5,262,000 |
| 8/1/1995 | 5,286,000 |
| 9/1/1995 | 5,324,000 |
| 10/1/1995 | 5,353,000 |
| 11/1/1995 | 5,358,000 |
| 12/1/1995 | 5,344,000 |
| 1/1/1996 | 5,355,000 |
| 2/1/1996 | 5,415,000 |
| 3/1/1996 | 5,446,000 |
| 4/1/1996 | 5,474,000 |
| 5/1/1996 | 5,498,000 |
| 6/1/1996 | 5,534,000 |
| 7/1/1996 | 5,557,000 |
| 8/1/1996 | 5,586,000 |
| 9/1/1996 | 5,610,000 |
| 10/1/1996 | 5,643,000 |
| 11/1/1996 | 5,668,000 |
| 12/1/1996 | 5,675,000 |
| 1/1/1997 | 5,675,000 |
| 2/1/1997 | 5,722,000 |
| 3/1/1997 | 5,751,000 |
| 4/1/1997 | 5,764,000 |
| 5/1/1997 | 5,793,000 |
| 6/1/1997 | 5,793,000 |
| 7/1/1997 | 5,817,000 |
| 8/1/1997 | 5,846,000 |
| 9/1/1997 | 5,874,000 |
| 10/1/1997 | 5,883,000 |
| 11/1/1997 | 5,899,000 |
| 12/1/1997 | 5,938,000 |
| 1/1/1998 | 5,983,000 |
| 2/1/1998 | 5,997,000 |
| 3/1/1998 | 5,969,000 |
| 4/1/1998 | 6,049,000 |
| 5/1/1998 | 6,087,000 |
| 6/1/1998 | 6,130,000 |
| 7/1/1998 | 6,172,000 |
| 8/1/1998 | 6,215,000 |
| 9/1/1998 | 6,225,000 |
| 10/1/1998 | 6,262,000 |
| 11/1/1998 | 6,301,000 |
| 12/1/1998 | 6,378,000 |
| 1/1/1999 | 6,357,000 |
| 2/1/1999 | 6,429,000 |
| 3/1/1999 | 6,402,000 |
| 4/1/1999 | 6,480,000 |
| 5/1/1999 | 6,516,000 |
| 6/1/1999 | 6,547,000 |
| 7/1/1999 | 6,571,000 |
| 8/1/1999 | 6,586,000 |
| 9/1/1999 | 6,613,000 |
| 10/1/1999 | 6,640,000 |
| 11/1/1999 | 6,687,000 |
| 12/1/1999 | 6,709,000 |
| 1/1/2000 | 6,752,000 |
| 2/1/2000 | 6,730,000 |
| 3/1/2000 | 6,811,000 |
| 4/1/2000 | 6,794,000 |
| 5/1/2000 | 6,770,000 |
| 6/1/2000 | 6,778,000 |
| 7/1/2000 | 6,794,000 |
| 8/1/2000 | 6,796,000 |
| 9/1/2000 | 6,807,000 |
| 10/1/2000 | 6,814,000 |
| 11/1/2000 | 6,817,000 |
| 12/1/2000 | 6,792,000 |
| 1/1/2001 | 6,824,000 |
| 2/1/2001 | 6,841,000 |
| 3/1/2001 | 6,862,000 |
| 4/1/2001 | 6,844,000 |
| 5/1/2001 | 6,849,000 |
| 6/1/2001 | 6,840,000 |
| 7/1/2001 | 6,845,000 |
| 8/1/2001 | 6,827,000 |
| 9/1/2001 | 6,813,000 |
| 10/1/2001 | 6,804,000 |
| 11/1/2001 | 6,784,000 |
| 12/1/2001 | 6,785,000 |
| 1/1/2002 | 6,775,000 |
| 2/1/2002 | 6,766,000 |
| 3/1/2002 | 6,755,000 |
| 4/1/2002 | 6,710,000 |
| 5/1/2002 | 6,684,000 |
| 6/1/2002 | 6,701,000 |
| 7/1/2002 | 6,688,000 |
| 8/1/2002 | 6,701,000 |
| 9/1/2002 | 6,702,000 |
| 10/1/2002 | 6,689,000 |
| 11/1/2002 | 6,713,000 |
| 12/1/2002 | 6,700,000 |
| 1/1/2003 | 6,704,000 |
| 2/1/2003 | 6,667,000 |
| 3/1/2003 | 6,654,000 |
| 4/1/2003 | 6,689,000 |
| 5/1/2003 | 6,706,000 |
| 6/1/2003 | 6,723,000 |
| 7/1/2003 | 6,735,000 |
| 8/1/2003 | 6,760,000 |
| 9/1/2003 | 6,783,000 |
| 10/1/2003 | 6,784,000 |
| 11/1/2003 | 6,796,000 |
| 12/1/2003 | 6,827,000 |
| 1/1/2004 | 6,848,000 |
| 2/1/2004 | 6,838,000 |
| 3/1/2004 | 6,887,000 |
| 4/1/2004 | 6,901,000 |
| 5/1/2004 | 6,948,000 |
| 6/1/2004 | 6,962,000 |
| 7/1/2004 | 6,977,000 |
| 8/1/2004 | 7,003,000 |
| 9/1/2004 | 7,029,000 |
| 10/1/2004 | 7,077,000 |
| 11/1/2004 | 7,091,000 |
| 12/1/2004 | 7,117,000 |
| 1/1/2005 | 7,095,000 |
| 2/1/2005 | 7,153,000 |
| 3/1/2005 | 7,181,000 |
| 4/1/2005 | 7,266,000 |
| 5/1/2005 | 7,294,000 |
| 6/1/2005 | 7,333,000 |
| 7/1/2005 | 7,353,000 |
| 8/1/2005 | 7,394,000 |
| 9/1/2005 | 7,415,000 |
| 10/1/2005 | 7,460,000 |
| 11/1/2005 | 7,524,000 |
| 12/1/2005 | 7,533,000 |
| 1/1/2006 | 7,601,000 |
| 2/1/2006 | 7,664,000 |
| 3/1/2006 | 7,689,000 |
| 4/1/2006 | 7,726,000 |
| 5/1/2006 | 7,713,000 |
| 6/1/2006 | 7,699,000 |
| 7/1/2006 | 7,712,000 |
| 8/1/2006 | 7,720,000 |
| 9/1/2006 | 7,718,000 |
| 10/1/2006 | 7,682,000 |
| 11/1/2006 | 7,666,000 |
| 12/1/2006 | 7,685,000 |
| 1/1/2007 | 7,725,000 |
| 2/1/2007 | 7,626,000 |
| 3/1/2007 | 7,706,000 |
| 4/1/2007 | 7,686,000 |
| 5/1/2007 | 7,673,000 |
| 6/1/2007 | 7,687,000 |
| 7/1/2007 | 7,660,000 |
| 8/1/2007 | 7,610,000 |
| 9/1/2007 | 7,577,000 |
| 10/1/2007 | 7,565,000 |
| 11/1/2007 | 7,523,000 |
| 12/1/2007 | 7,490,000 |
| 1/1/2008 | 7,476,000 |
| 2/1/2008 | 7,453,000 |
| 3/1/2008 | 7,406,000 |
| 4/1/2008 | 7,327,000 |
| 5/1/2008 | 7,274,000 |
| 6/1/2008 | 7,213,000 |
| 7/1/2008 | 7,160,000 |
| 8/1/2008 | 7,114,000 |
| 9/1/2008 | 7,044,000 |
| 10/1/2008 | 6,967,000 |
| 11/1/2008 | 6,813,000 |
| 12/1/2008 | 6,701,000 |
| 1/1/2009 | 6,567,000 |
| 2/1/2009 | 6,446,000 |
| 3/1/2009 | 6,291,000 |
| 4/1/2009 | 6,154,000 |
| 5/1/2009 | 6,100,000 |
| 6/1/2009 | 6,010,000 |
| 7/1/2009 | 5,932,000 |
| 8/1/2009 | 5,855,000 |
| 9/1/2009 | 5,787,000 |
| 10/1/2009 | 5,716,000 |
| 11/1/2009 | 5,696,000 |
| 12/1/2009 | 5,654,000 |
| 1/1/2010 | 5,580,000 |
| 2/1/2010 | 5,500,000 |
| 3/1/2010 | 5,537,000 |
| 4/1/2010 | 5,553,000 |
| 5/1/2010 | 5,520,000 |
| 6/1/2010 | 5,516,000 |
| 7/1/2010 | 5,508,000 |
| 8/1/2010 | 5,524,000 |
| 9/1/2010 | 5,501,000 |
| 10/1/2010 | 5,508,000 |
| 11/1/2010 | 5,506,000 |
| 12/1/2010 | 5,467,000 |
| 1/1/2011 | 5,427,000 |
| 2/1/2011 | 5,451,000 |
| 3/1/2011 | 5,477,000 |
| 4/1/2011 | 5,485,000 |
| 5/1/2011 | 5,516,000 |
| 6/1/2011 | 5,528,000 |
| 7/1/2011 | 5,547,000 |
| 8/1/2011 | 5,552,000 |
| 9/1/2011 | 5,584,000 |
| 10/1/2011 | 5,588,000 |
| 11/1/2011 | 5,593,000 |
| 12/1/2011 | 5,611,000 |
| 1/1/2012 | 5,626,000 |
| 2/1/2012 | 5,629,000 |
| 3/1/2012 | 5,625,000 |
| 4/1/2012 | 5,618,000 |
| 5/1/2012 | 5,604,000 |
| 6/1/2012 | 5,621,000 |
| 7/1/2012 | 5,632,000 |
| 8/1/2012 | 5,648,000 |
| 9/1/2012 | 5,661,000 |
| 10/1/2012 | 5,674,000 |
| 11/1/2012 | 5,684,000 |
| 12/1/2012 | 5,724,000 |
| 1/1/2013 | 5,746,000 |
| 2/1/2013 | 5,784,000 |
| 3/1/2013 | 5,802,000 |
| 4/1/2013 | 5,796,000 |
| 5/1/2013 | 5,829,000 |
| 6/1/2013 | 5,855,000 |
| 7/1/2013 | 5,859,000 |
| 8/1/2013 | 5,878,000 |
| 9/1/2013 | 5,910,000 |
| 10/1/2013 | 5,931,000 |
| 11/1/2013 | 5,963,000 |
| 12/1/2013 | 5,932,000 |
| 1/1/2014 | 5,985,000 |
| 2/1/2014 | 6,007,000 |
| 3/1/2014 | 6,038,000 |
| 4/1/2014 | 6,084,000 |
| 5/1/2014 | 6,109,000 |
| 6/1/2014 | 6,133,000 |
| 7/1/2014 | 6,178,000 |
| 8/1/2014 | 6,210,000 |
| 9/1/2014 | 6,242,000 |
| 10/1/2014 | 6,259,000 |
| 11/1/2014 | 6,272,000 |
| 12/1/2014 | 6,293,000 |
| 1/1/2015 | 6,320,000 |
| 2/1/2015 | 6,361,000 |
| 3/1/2015 | 6,334,000 |
| 4/1/2015 | 6,392,000 |
| 5/1/2015 | 6,427,000 |
| 6/1/2015 | 6,441,000 |
| 7/1/2015 | 6,472,000 |
| 8/1/2015 | 6,490,000 |
| 9/1/2015 | 6,508,000 |
| 10/1/2015 | 6,547,000 |
| 11/1/2015 | 6,598,000 |
| 12/1/2015 | 6,630,000 |
| 1/1/2016 | 6,631,000 |
| 2/1/2016 | 6,640,000 |
| 3/1/2016 | 6,678,000 |
| 4/1/2016 | 6,702,000 |
| 5/1/2016 | 6,689,000 |
| 6/1/2016 | 6,701,000 |
| 7/1/2016 | 6,735,000 |
| 8/1/2016 | 6,736,000 |
| 9/1/2016 | 6,768,000 |
| 10/1/2016 | 6,799,000 |
| 11/1/2016 | 6,823,000 |
| 12/1/2016 | 6,818,000 |
| 1/1/2017 | 6,840,000 |
| 2/1/2017 | 6,881,000 |
| 3/1/2017 | 6,902,000 |
| 4/1/2017 | 6,916,000 |
| 5/1/2017 | 6,931,000 |
| 6/1/2017 | 6,962,000 |
| 7/1/2017 | 6,968,000 |
| 8/1/2017 | 7,002,000 |
| 9/1/2017 | 7,013,000 |
| 10/1/2017 | 7,031,000 |
| 11/1/2017 | 7,068,000 |
| 12/1/2017 | 7,091,000 |
| 1/1/2018 | 7,093,000 |
| 2/1/2018 | 7,184,000 |
| 3/1/2018 | 7,194,000 |
| 4/1/2018 | 7,212,000 |
| 5/1/2018 | 7,274,000 |
| 6/1/2018 | 7,292,000 |
| 7/1/2018 | 7,318,000 |
| 8/1/2018 | 7,347,000 |
| 9/1/2018 | 7,375,000 |
| 10/1/2018 | 7,389,000 |
| 11/1/2018 | 7,386,000 |
| 12/1/2018 | 7,396,000 |
| 1/1/2019 | 7,425,000 |
| 2/1/2019 | 7,395,000 |
| 3/1/2019 | 7,425,000 |
| 4/1/2019 | 7,468,000 |
| 5/1/2019 | 7,478,000 |
| 6/1/2019 | 7,502,000 |
| 7/1/2019 | 7,526,000 |
| 8/1/2019 | 7,530,000 |
| 9/1/2019 | 7,547,000 |
| 10/1/2019 | 7,553,000 |
| 11/1/2019 | 7,541,000 |
| 12/1/2019 | 7,527,000 |
| 1/1/2020 | 7,575,000 |
| 2/1/2020 | 7,610,000 |
| 3/1/2020 | 7,541,000 |
| 4/1/2020 | 6,522,000 |
| 5/1/2020 | 7,004,000 |
| 6/1/2020 | 7,159,000 |
| 7/1/2020 | 7,196,000 |
| 8/1/2020 | 7,226,000 |
| 9/1/2020 | 7,253,000 |
| 10/1/2020 | 7,301,000 |
| 11/1/2020 | 7,321,000 |
| 12/1/2020 | 7,357,000 |
| 1/1/2021 | 7,358,000 |
| 2/1/2021 | 7,293,000 |
| 3/1/2021 | 7,399,000 |
| 4/1/2021 | 7,401,000 |
| 5/1/2021 | 7,389,000 |
| 6/1/2021 | 7,392,000 |
| 7/1/2021 | 7,417,000 |
| 8/1/2021 | 7,431,000 |
| 9/1/2021 | 7,478,000 |
| 10/1/2021 | 7,520,000 |
| 11/1/2021 | 7,565,000 |
| 12/1/2021 | 7,601,000 |
| 1/1/2022 | 7,586,000 |
| 2/1/2022 | 7,667,000 |
| 3/1/2022 | 7,695,000 |
| 4/1/2022 | 7,699,000 |
| 5/1/2022 | 7,737,000 |
| 6/1/2022 | 7,760,000 |
| 7/1/2022 | 7,789,000 |
| 8/1/2022 | 7,799,000 |
| 9/1/2022 | 7,827,000 |
| 10/1/2022 | 7,846,000 |
| 11/1/2022 | 7,864,000 |
| 12/1/2022 | 7,892,000 |
| 1/1/2023 | 7,922,000 |
| 2/1/2023 | 7,947,000 |
| 3/1/2023 | 7,931,000 |
| 4/1/2023 | 7,955,000 |
| 5/1/2023 | 7,965,000 |
| 6/1/2023 | 8,006,000 |
| 7/1/2023 | 8,014,000 |
| 8/1/2023 | 8,039,000 |
| 9/1/2023 | 8,049,000 |
| 10/1/2023 | 8,076,000 |
| 11/1/2023 | 8,085,000 |
| 12/1/2023 | 8,099,000 |
| 1/1/2024 | 8,113,000 |
| 2/1/2024 | 8,136,000 |
| 3/1/2024 | 8,170,000 |
| 4/1/2024 | 8,173,000 |
| 5/1/2024 | 8,188,000 |
| 6/1/2024 | 8,203,000 |
| 7/1/2024 | 8,214,000 |
| 8/1/2024 | 8,237,000 |
| 9/1/2024 | 8,267,000 |
| 10/1/2024 | 8,268,000 |
| 11/1/2024 | 8,274,000 |
| 12/1/2024 | 8,289,000 |
| 1/1/2025 | 8,286,000 |
| 2/1/2025 | 8,298,000 |
| 3/1/2025 | 8,305,000 |
| 4/1/2025 | 8,316,000 |
The construction sector has long been a bellwether for the broader U.S. economy, typically contracting ahead of recessions and recovering more slowly than other industries. This was clearly visible during the COVID-19 pandemic, when construction employment dropped sharply to 6.5 million in April 2020. Yet the rebound was swift, driven by robust demand for residential housing, new manufacturing sites, and infrastructure projects. By mid-2023, total construction employment had climbed above 8 million for the first time.
In recent months, however, that growth appears to be tapering off. Employment figures have plateaued around 8.3 million in mid-2025, reflecting broader economic headwinds. While hiring momentum has slowed, one lasting effect of the recent labor market tightness has been strong wage growth. The construction industry generally compensates its workers well, especially when considering that few construction occupations require a postsecondary degree. On a national level, full- and part-time wage and salary construction workers earn a median of $58,360 per year—about 18% more than the overall median wage of $49,500. Over the past two years, construction wages have increased by 15.4%, up from $50,570. In contrast, wages across all occupations grew just 6.9%.
Rising costs are squeezing margins across the industry.
Construction accounting software helps contractors track labor, materials, and cash flow to stay financially healthy in a slower market. See how in this guide to accounting software for contractors and construction business.
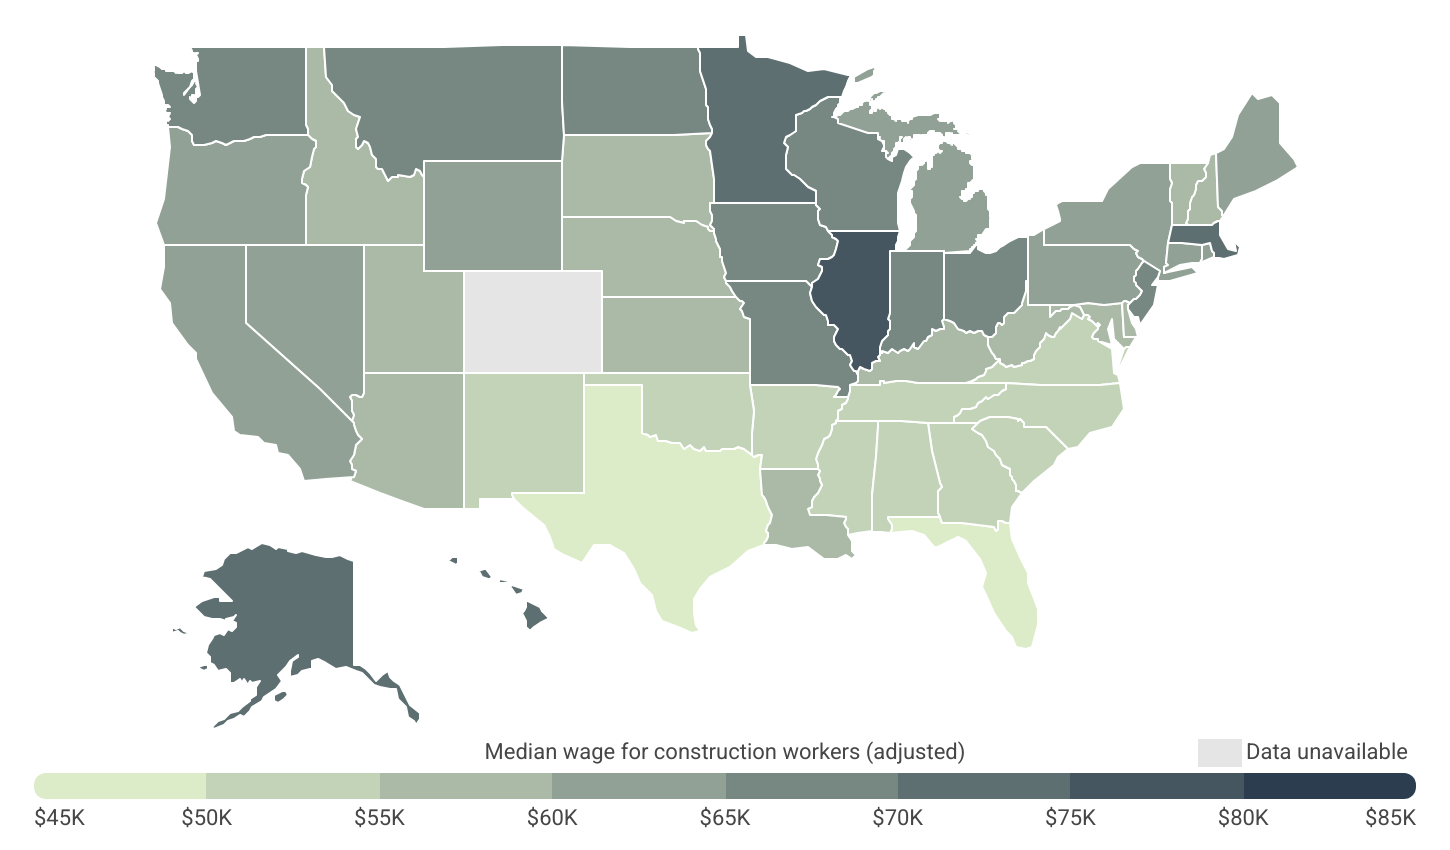
Regional Differences in Real Wages for Construction Workers
Illinois is the best-paying state for construction workers
Data: Median Annual Wage for Construction Workers by State
| State | Median wage for construction workers (adjusted) |
|---|---|
| Illinois | $79,328 |
| Hawaii | $73,060 |
| Alaska | $72,841 |
| Minnesota | $70,923 |
| Massachusetts | $70,382 |
| North Dakota | $68,859 |
| Washington | $68,265 |
| New Jersey | $66,925 |
| Wisconsin | $66,780 |
| Ohio | $66,124 |
| Indiana | $65,868 |
| Montana | $65,600 |
| Missouri | $65,387 |
| Iowa | $65,249 |
| Michigan | $64,055 |
| Wyoming | $63,986 |
| California | $63,243 |
| Rhode Island | $63,217 |
| Nevada | $62,889 |
| Connecticut | $62,138 |
| New York | $62,039 |
| Pennsylvania | $60,882 |
| Oregon | $60,570 |
| Maine | $60,414 |
| Vermont | $59,709 |
| Delaware | $59,615 |
| West Virginia | $59,506 |
| Kansas | $56,789 |
| Maryland | $56,731 |
| Utah | $56,609 |
| Nebraska | $56,387 |
| Kentucky | $56,340 |
| Louisiana | $56,245 |
| Arizona | $56,239 |
| New Hampshire | $55,807 |
| Idaho | $55,455 |
| South Dakota | $55,088 |
| Oklahoma | $54,788 |
| New Mexico | $53,570 |
| Tennessee | $52,964 |
| Arkansas | $52,955 |
| Alabama | $52,406 |
| Mississippi | $52,319 |
| South Carolina | $51,933 |
| North Carolina | $51,711 |
| Virginia | $51,455 |
| Georgia | $50,683 |
| Texas | $49,817 |
| Florida | $46,843 |
At the state level, the Midwest is home to some of the highest wages for construction workers after adjusting for cost of living differences. Illinois leads the nation with a cost-of-living-adjusted median annual wage of $79,328. Other Midwestern states also rank highly, including Minnesota ($70,923), North Dakota ($68,859), Wisconsin ($66,780), and Ohio ($66,124), all ranking in the top 10. These figures reflect both relatively strong nominal wages and more affordable living costs, allowing construction workers in these states to retain more of their earnings.
With workloads tightening, small disruptions carry more risk.
General liability insurance protects contractors from unexpected claims—covering property damage, injuries, and legal expenses. Learn more in this contractor’s guide on general liability insurance.
In contrast, the Southern states consistently rank at the bottom of the list. All 10 of the lowest-ranked states for cost-adjusted construction wages are located in the South, where lower nominal pay outweighs the benefit of lower living costs. Among the lowest are Florida ($46,843), Texas ($49,817), and Georgia ($50,683), where construction workers earn roughly 40% less—after adjusting for cost of living—than their counterparts in Illinois.
Similar patterns emerge at the local level. Many of the lowest-paying cities, after adjusting for cost of living differences, are located in Southern states—particularly in Florida and Texas. Conversely, Midwestern cities are well represented among the top-paying locations. However, among large metropolitan areas with populations over one million, a number of coastal cities also rank highly despite their high living costs. These include San Jose, Boston, Seattle, San Francisco, and New York.
Below is a complete breakdown of cost-of-living-adjusted construction worker pay across more than 350 metropolitan areas (grouped by size) and all 50 states. For additional information on how the analysis was conducted, refer to the methodology section.
The Highest-Paying Cities for Construction
| Top Large Metros | Wage* |
|---|---|
| 1. Chicago-Naperville-Elgin, IL-IN | $80,248 |
| 2. Minneapolis-St. Paul-Bloomington, MN-WI | $73,582 |
| 3. St. Louis, MO-IL | $71,092 |
| 4. San Jose-Sunnyvale-Santa Clara, CA | $70,127 |
| 5. Boston-Cambridge-Newton, MA-NH | $69,299 |
| 6. Seattle-Tacoma-Bellevue, WA | $68,917 |
| 7. Milwaukee-Waukesha, WI | $68,644 |
| 8. Portland-Vancouver-Hillsboro, OR-WA | $68,527 |
| 9. Cleveland, OH | $67,193 |
| 10. Columbus, OH | $67,026 |
| 11. San Francisco-Oakland-Fremont, CA | $66,822 |
| 12. New York-Newark-Jersey City, NY-NJ | $66,780 |
| 13. Sacramento-Roseville-Folsom, CA | $66,261 |
| 14. Kansas City, MO-KS | $65,962 |
| 15. Indianapolis-Carmel-Greenwood, IN | $65,375 |
| Bottom Large Metros | Wage* |
|---|---|
| 1. Miami-Fort Lauderdale-West Palm Beach, FL | $45,053 |
| 2. Tampa-St. Petersburg-Clearwater, FL | $46,871 |
| 3. Dallas-Fort Worth-Arlington, TX | $47,728 |
| 4. Orlando-Kissimmee-Sanford, FL | $48,126 |
| 5. Jacksonville, FL | $48,470 |
| 6. Houston-Pasadena-The Woodlands, TX | $49,222 |
| 7. Atlanta-Sandy Springs-Roswell, GA | $50,251 |
| 8. Richmond, VA | $50,588 |
| 9. Austin-Round Rock-San Marcos, TX | $50,799 |
| 10. Raleigh-Cary, NC | $50,802 |
| 11. San Antonio-New Braunfels, TX | $50,860 |
| 12. Charlotte-Concord-Gastonia, NC-SC | $52,341 |
| 13. Tucson, AZ | $52,541 |
| 14. Memphis, TN-MS-AR | $52,928 |
| 15. Nashville-Davidson–Murfreesboro–Franklin, TN | $53,238 |
| Top Midsize Metros | Wage* |
|---|---|
| 1. Peoria, IL | $86,056 |
| 2. Urban Honolulu, HI | $73,581 |
| 3. Trenton-Princeton, NJ | $73,459 |
| 4. Springfield, MA | $72,281 |
| 5. Davenport-Moline-Rock Island, IA-IL | $70,793 |
| 6. Worcester, MA | $69,862 |
| 7. Toledo, OH | $69,571 |
| 8. Vallejo, CA | $69,277 |
| 9. Anchorage, AK | $68,639 |
| 10. Canton-Massillon, OH | $68,535 |
| 11. Flint, MI | $68,282 |
| 12. Santa Rosa-Petaluma, CA | $68,003 |
| 13. Madison, WI | $67,745 |
| 14. Youngstown-Warren, OH | $67,122 |
| 15. Fort Wayne, IN | $66,481 |
| Bottom Midsize Metros | Wage* |
|---|---|
| 1. Brownsville-Harlingen, TX | $44,305 |
| 2. McAllen-Edinburg-Mission, TX | $44,860 |
| 3. Port St. Lucie, FL | $46,157 |
| 4. North Port-Bradenton-Sarasota, FL | $46,345 |
| 5. Cape Coral-Fort Myers, FL | $46,361 |
| 6. Naples-Marco Island, FL | $46,687 |
| 7. El Paso, TX | $46,841 |
| 8. Deltona-Daytona Beach-Ormond Beach, FL | $47,113 |
| 9. Ocala, FL | $47,369 |
| 10. Tallahassee, FL | $47,985 |
| 11. Palm Bay-Melbourne-Titusville, FL | $48,097 |
| 12. Lakeland-Winter Haven, FL | $48,144 |
| 13. Gainesville, FL | $48,465 |
| 14. Killeen-Temple, TX | $48,637 |
| 15. Pensacola-Ferry Pass-Brent, FL | $49,037 |
| Top Small Metros | Wage* |
|---|---|
| 1. Kokomo, IN | $89,510 |
| 2. Decatur, IL | $85,666 |
| 3. Champaign-Urbana, IL | $83,776 |
| 4. Rockford, IL | $83,438 |
| 5. Duluth, MN-WI | $83,077 |
| 6. Fairbanks-College, AK | $82,386 |
| 7. Bloomington, IL | $81,672 |
| 8. Springfield, IL | $81,172 |
| 9. Kankakee, IL | $79,019 |
| 10. Rochester, MN | $78,216 |
| 11. Vineland, NJ | $77,913 |
| 12. Kennewick-Richland, WA | $76,110 |
| 13. St. Cloud, MN | $75,157 |
| 14. Mankato, MN | $73,588 |
| 15. Kahului-Wailuku, HI | $73,570 |
| Bottom Small Metros | Wage* |
|---|---|
| 1. Gadsden, AL | $45,024 |
| 2. Hattiesburg, MS | $45,687 |
| 3. Hot Springs, AR | $45,920 |
| 4. Homosassa Springs, FL | $46,954 |
| 5. Dothan, AL | $47,103 |
| 6. Laredo, TX | $47,251 |
| 7. Panama City-Panama City Beach, FL | $47,408 |
| 8. Punta Gorda, FL | $47,909 |
| 9. Crestview-Fort Walton Beach-Destin, FL | $48,087 |
| 10. Fort Smith, AR-OK | $48,541 |
| 11. Daphne-Fairhope-Foley, AL | $48,646 |
| 12. Dalton, GA | $48,806 |
| 13. Sebring, FL | $48,906 |
| 14. Wichita Falls, TX | $49,036 |
| 15. Sebastian-Vero Beach-West Vero Corridor, FL | $49,072 |
Rely on your own tools to get the job done?
Tools and equipment insurance protects against theft, damage, and jobsite losses—critical coverage for independent tradespeople and small contractors. Read more about this coverage in the guide to tools and equipment insurance.
The Highest-Paying States for Construction
| Top States | Wage* |
|---|---|
| 1. Illinois | $79,328 |
| 2. Hawaii | $73,060 |
| 3. Alaska | $72,841 |
| 4. Minnesota | $70,923 |
| 5. Massachusetts | $70,382 |
| 6. North Dakota | $68,859 |
| 7. Washington | $68,265 |
| 8. New Jersey | $66,925 |
| 9. Wisconsin | $66,780 |
| 10. Ohio | $66,124 |
| 11. Indiana | $65,868 |
| 12. Montana | $65,600 |
| 13. Missouri | $65,387 |
| 14. Iowa | $65,249 |
| 15. Michigan | $64,055 |
| Bottom States | Wage* |
|---|---|
| 1. Florida | $46,843 |
| 2. Texas | $49,817 |
| 3. Georgia | $50,683 |
| 4. Virginia | $51,455 |
| 5. North Carolina | $51,711 |
| 6. South Carolina | $51,933 |
| 7. Mississippi | $52,319 |
| 8. Alabama | $52,406 |
| 9. Arkansas | $52,955 |
| 10. Tennessee | $52,964 |
| 11. New Mexico | $53,570 |
| 12. Oklahoma | $54,788 |
| 13. South Dakota | $55,088 |
| 14. Idaho | $55,455 |
| 15. New Hampshire | $55,807 |
*Median wage for construction workers (adjusted)
Full Results
Methodology
To determine the top-paying locations for construction workers, researchers at Construction Coverage analyzed the latest data from the U.S. Bureau of Labor Statistics’s 2024 Occupational Employment and Wage Statistics, the U.S. Bureau of Economic Analysis’ Regional Price Parities, and the U.S. Census Bureau’s American Community Survey. The researchers ranked locations according to the cost-of-living-adjusted median annual wage for construction workers. For the purposes of this analysis, construction workers were considered to be all wage and salary workers on nonfarm establishments with occupations classified under the Construction and Extraction Occupations major occupation group. In the event of a tie, the location with the larger unadjusted median annual wage for construction workers was ranked higher.
Only metropolitan areas and states with available data were included in the analysis. Notably, data for the state of Colorado and its component MSAs were not available in the BLS 2024 data release. Additionally, metro areas were grouped into the following cohorts based on population size:
- Small metros: Less than 350,000
- Midsize metros: 350,000–999,999
- Large metros: 1,000,000 or more
References
- Steel Industry News (April 23, 2025). US Construction Outlook 2025: Tariffs, Recession Risks, and Sectoral Shifts. https://steelindustry.news/us-construction-outlook-2025-tariffs-recession-risks-and-sectoral-shifts/.
- Associated Builders and Contractors (January 24, 2025). ABC: Construction Industry Must Attract 439,000 Workers in 2025. https://www.abc.org/News-Media/News-Releases/abc-construction-industry-must-attract-439000-workers-in-2025.
- National Association of Home Builders (May 6, 2025). Residential Construction Job Growth Plateaus Short of Pre-Recession Levels. https://www.nahb.org/blog/2025/05/residential-construction-employment-april-2025.
- U.S. Bureau of Labor Statistics (2023). Employment Projections, Education and training assignments by detailed occupation. https://www.bls.gov/emp/tables/education-and-training-by-occupation.htm.
- U.S. Bureau of Labor Statistics (2024). Occupational Employment and Wage Statistics (OEWS). https://www.bls.gov/oes/.
- U.S. Bureau of Economic Analysis (December 12, 2024). Regional Price Parities by State and Metro Area. https://www.bea.gov/data/prices-inflation/regional-price-parities-state-and-metro-area.
- U.S. Census Bureau (2025) American Community Survey (ACS). https://www.census.gov/programs-surveys/acs.