
Best-Paying U.S. Cities for Solar Panel Installers in 2023
Due to the increased cost of non-renewable energy sources like oil, gas, and coal, heating bills have reached their highest level in 10 years. Energy sources continue to be limited by economic and political conditions, such as OPEC+ cutting oil production and the war in Ukraine causing the United States and other countries to ban oil imports from Russia. Despite these limiting factors, demand for energy is expected to grow, as it did in the U.S. in 2022, and energy costs for the average household may continue to increase.
A growing number of Americans are looking towards renewable energy sources to offset the cost of the traditional energy bill, and governments are encouraging this shift through tax incentive programs for renewable energy, such as solar power. The Inflation Reduction Act allocated a 30% tax credit on residential rooftop solar installations and it is estimated that an additional 7.5 million families will have access to rooftop solar because of it.
Because of these types of environmentally-focused programs, there has been a steady shift toward the new and growing solar energy industry. The Solar Energy Industry Association reports that the sector experienced an average annual growth rate of 24% over the last decade, and the U.S. is on track to triple domestic solar manufacturing capacity by 2024. But in order to meet the growing demand for solar energy in the U.S., employment in the industry will need to expand dramatically.
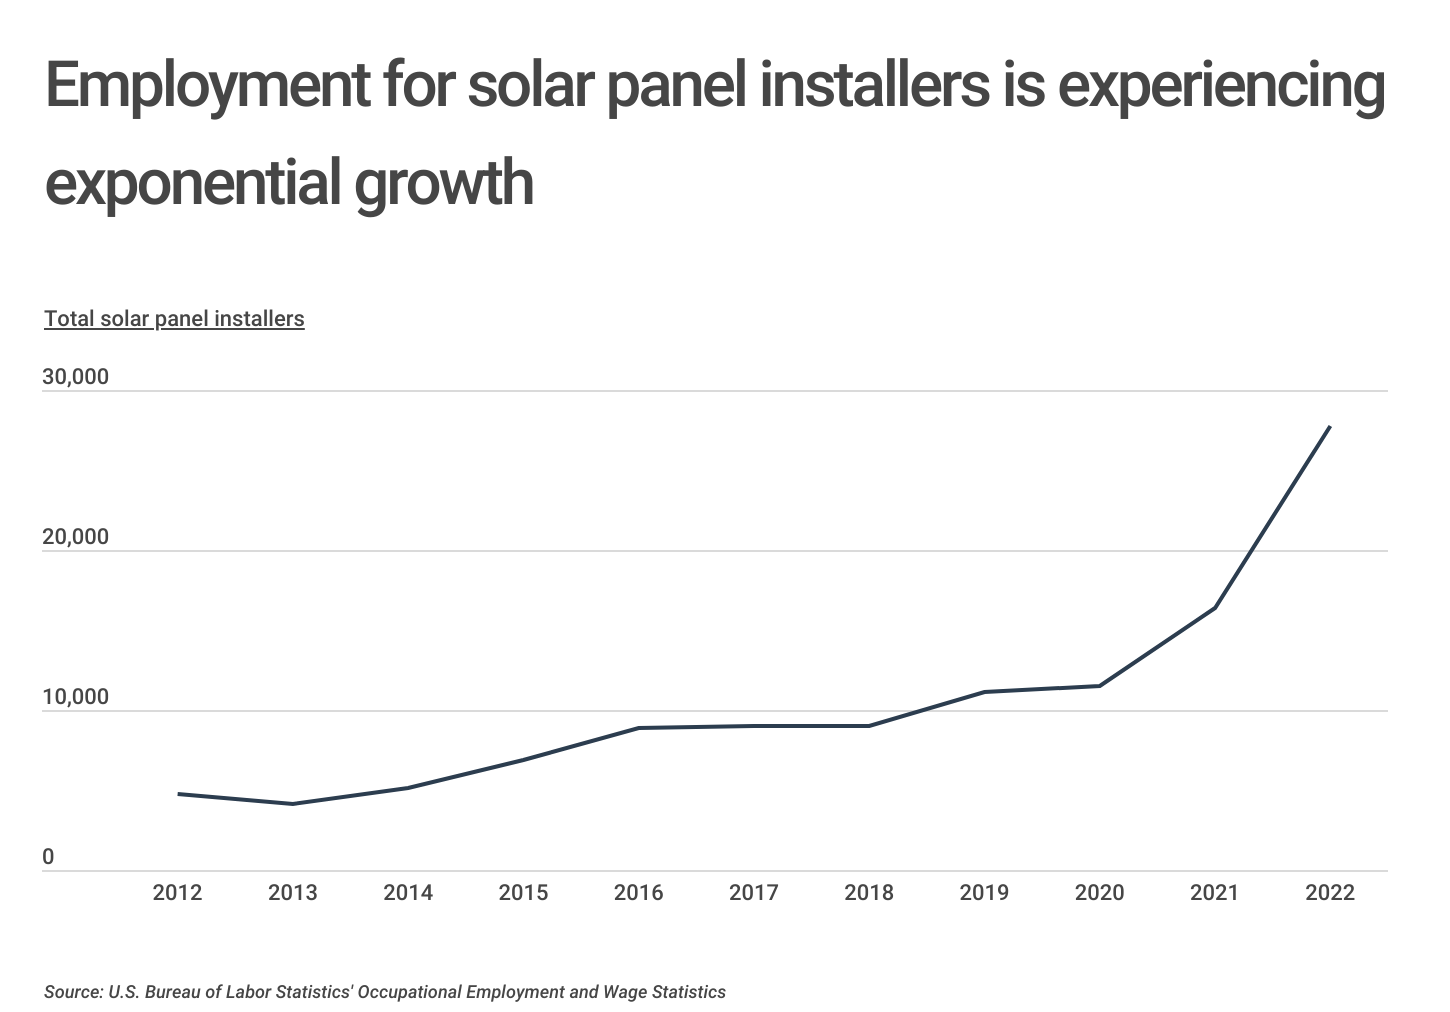
Accordingly, rapid growth in the solar panel installer labor force is already underway. In 2012, there were just over 4,700 solar panel installers employed in the United States. Employment growth remained steady until 2020, but in just two years from 2020 to 2022, the total number of solar panel installers in the U.S. more than doubled from approximately 11,500 to nearly 28,000.
The growth in solar panel installer employment largely coincides with substantial decreases in solar panel costs. Over the past decade, the cost to install solar has dropped by more than 50%. And although widespread inflation caused a small uptick in photovoltaic system costs, the U.S. Department of Energy’s Solar Energy Technologies Office has announced plans to reduce the cost for utility-scale solar panel energy generation even further.
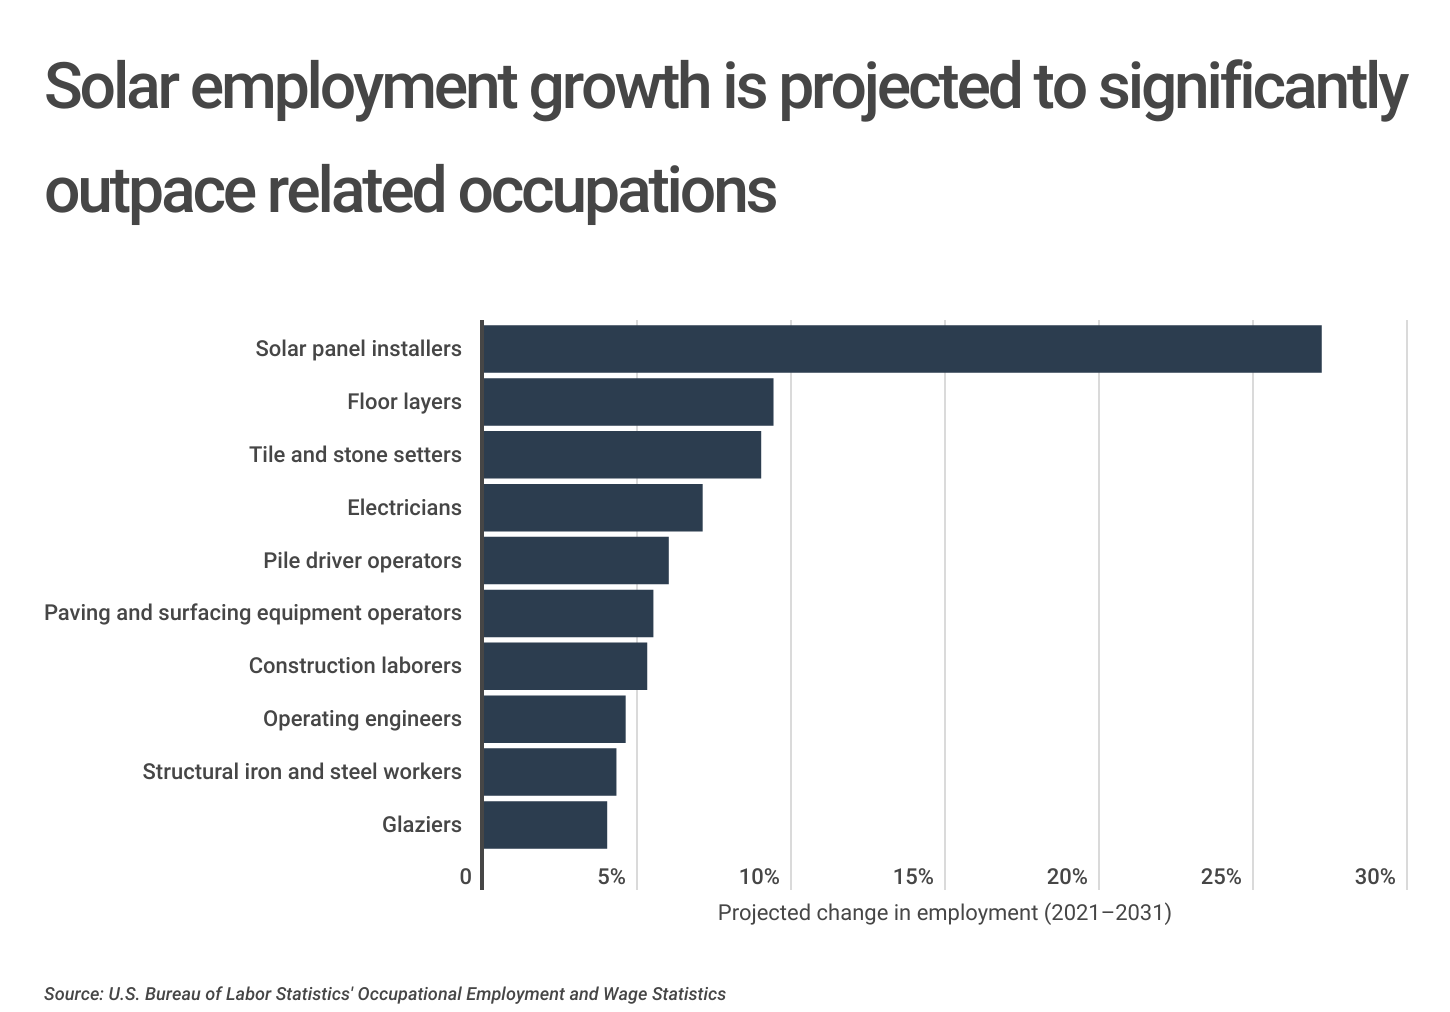
While the occupational outlook for solar panel installers is bright, it particularly stands out from all other construction occupations. The U.S. Bureau of Labor Statistics expects the total number of solar panel installers to increase by over 27% from 2021 to 2031. During that same time period, the next closest construction trade—floor layers—is only projected to grow by 9.4%.
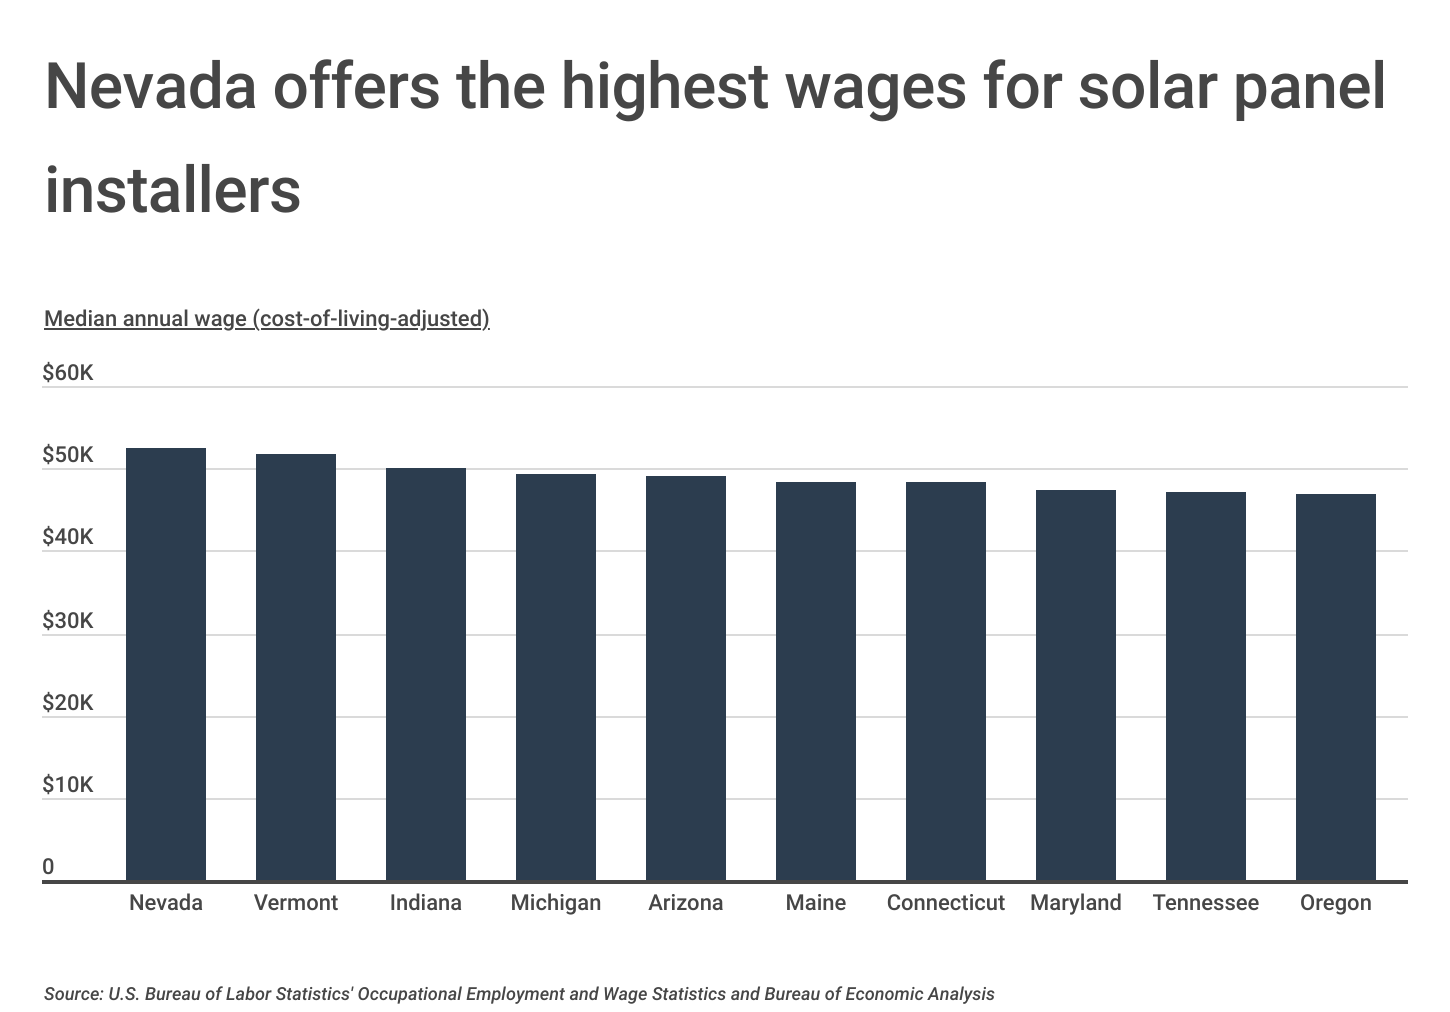
Although demand for the solar panel installer occupation is on the rise, compensation for the profession has yet to significantly benefit from it. The national median wage for solar panel installers was $45,230 in 2022, while the median wage for all occupations was $46,310. However, with differences in economic conditions and cost of living around the country, adjusted wages for solar panel installers can vary dramatically by location.
Nevada leads all states with the highest cost-of-living-adjusted wages for solar panel installers at $52,500 per year. Collectively, there are 10 states where solar panel installers earn above the national median wage for all workers after adjusting for cost of living, and they are located all across the country. Conversely, states like Texas ($38,009) and North Carolina ($38,697) have the lowest wages for solar panel installers.
This analysis used data from the U.S. Bureau of Labor Statistics and the U.S. Bureau of Economic Analysis. Researchers at Construction Coverage determined the best-paying cities for solar panel installers based on the median annual wage adjusted for cost of living in that area. Researchers also calculated the median annual wage for all construction trades and the concentration of solar panel workers’ compared to the national average.
Here are the best-paying cities for solar panel installers in the United States.
Best-Paying Metros for Solar Panel Installers

Photo Credit: stellamc / Shutterstock
15. Fresno, CA
- Median annual wage for solar panel installers (adjusted): $46,043
- Median annual wage for solar panel installers (actual): $46,760
- Median annual wage for all construction trades workers (actual): $59,650
- Concentration of solar panel installers: 229% higher than average

Photo Credit: Andrew Zarivny / Shutterstock
14. Denver-Aurora-Lakewood, CO
- Median annual wage for solar panel installers (adjusted): $46,154
- Median annual wage for solar panel installers (actual): $50,380
- Median annual wage for all construction trades workers (actual): $56,650
- Concentration of solar panel installers: 5% higher than average

Photo Credit: Izabela23 / Shutterstock
13. Urban Honolulu, HI
- Median annual wage for solar panel installers (adjusted): $46,593
- Median annual wage for solar panel installers (actual): $53,460
- Median annual wage for all construction trades workers (actual): $79,210
- Concentration of solar panel installers: 126% higher than average
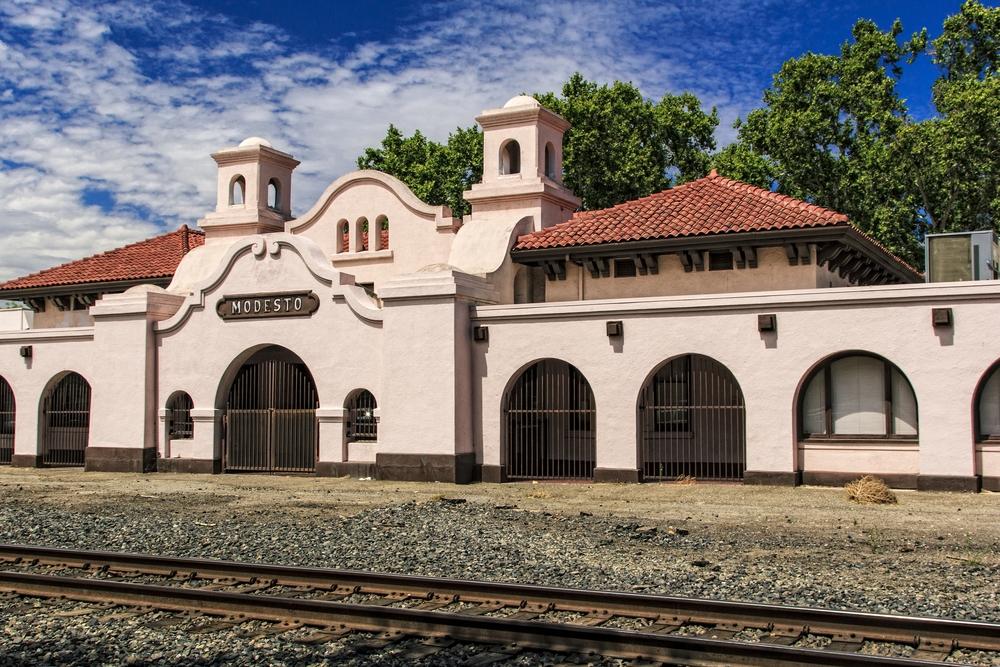
Photo Credit: Scott Prokop / Shutterstock
12. Modesto, CA
- Median annual wage for solar panel installers (adjusted): $46,805
- Median annual wage for solar panel installers (actual): $48,200
- Median annual wage for all construction trades workers (actual): $61,340
- Concentration of solar panel installers: 283% higher than average

Photo Credit: Mihai Andritoiu / Shutterstock
11. Albany-Schenectady-Troy, NY
- Median annual wage for solar panel installers (adjusted): $47,289
- Median annual wage for solar panel installers (actual): $46,890
- Median annual wage for all construction trades workers (actual): $60,970
- Concentration of solar panel installers: 1% lower than average

Photo Credit: Wangkun Jia / Shutterstock
10. Barnstable Town, MA
- Median annual wage for solar panel installers (adjusted): $47,934
- Median annual wage for solar panel installers (actual): $48,480
- Median annual wage for all construction trades workers (actual): $60,820
- Concentration of solar panel installers: 601% higher than average

Photo Credit: Gregory E. Clifford / Shutterstock
9. Phoenix-Mesa-Scottsdale, AZ
- Median annual wage for solar panel installers (adjusted): $47,935
- Median annual wage for solar panel installers (actual): $47,540
- Median annual wage for all construction trades workers (actual): $49,080
- Concentration of solar panel installers: 36% higher than average

Photo Credit: Jon Bilous / Shutterstock
8. Riverside-San Bernardino-Ontario, CA
- Median annual wage for solar panel installers (adjusted): $47,976
- Median annual wage for solar panel installers (actual): $50,630
- Median annual wage for all construction trades workers (actual): $59,850
- Concentration of solar panel installers: 306% higher than average

Photo Credit: Bob Pool / Shutterstock
7. Portland-Vancouver-Hillsboro, OR-WA
- Median annual wage for solar panel installers (adjusted): $48,533
- Median annual wage for solar panel installers (actual): $51,140
- Median annual wage for all construction trades workers (actual): $59,780
- Concentration of solar panel installers: 27% lower than average

Photo Credit: Olivier Le Queinec / Shutterstock
6. Baltimore-Columbia-Towson, MD
- Median annual wage for solar panel installers (adjusted): $48,547
- Median annual wage for solar panel installers (actual): $50,980
- Median annual wage for all construction trades workers (actual): $55,400
- Concentration of solar panel installers: 32% higher than average

Photo Credit: Jessica Kirsh / Shutterstock
5. San Francisco-Oakland-Hayward, CA
- Median annual wage for solar panel installers (adjusted): $50,746
- Median annual wage for solar panel installers (actual): $60,810
- Median annual wage for all construction trades workers (actual): $75,520
- Concentration of solar panel installers: 206% higher than average
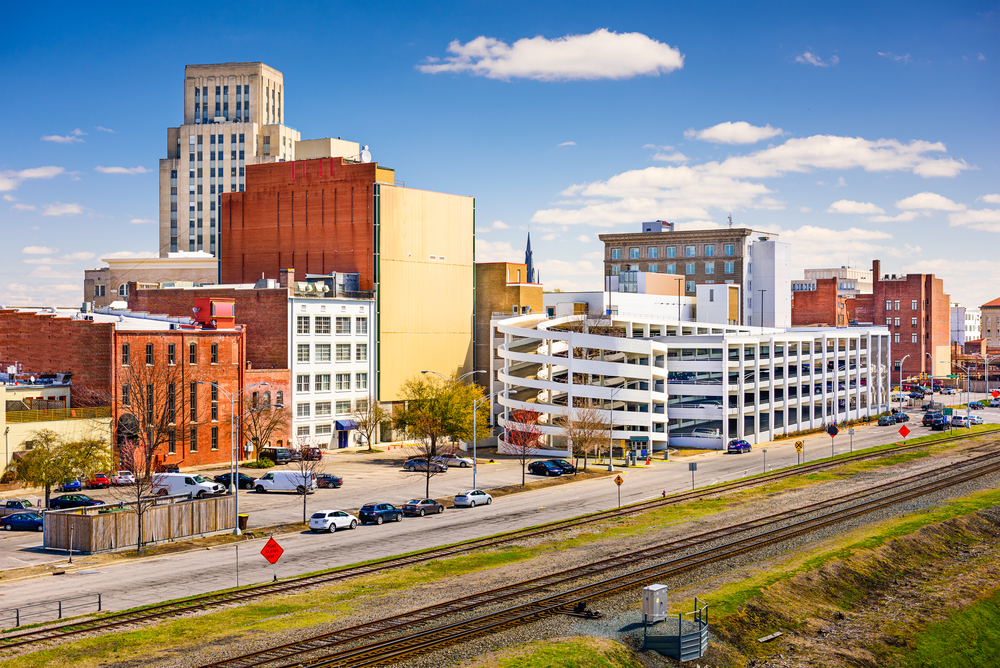
Photo Credit: Sean Pavone / Shutterstock
4. Durham-Chapel Hill, NC
- Median annual wage for solar panel installers (adjusted): $51,181
- Median annual wage for solar panel installers (actual): $49,130
- Median annual wage for all construction trades workers (actual): $46,770
- Concentration of solar panel installers: 62% higher than average
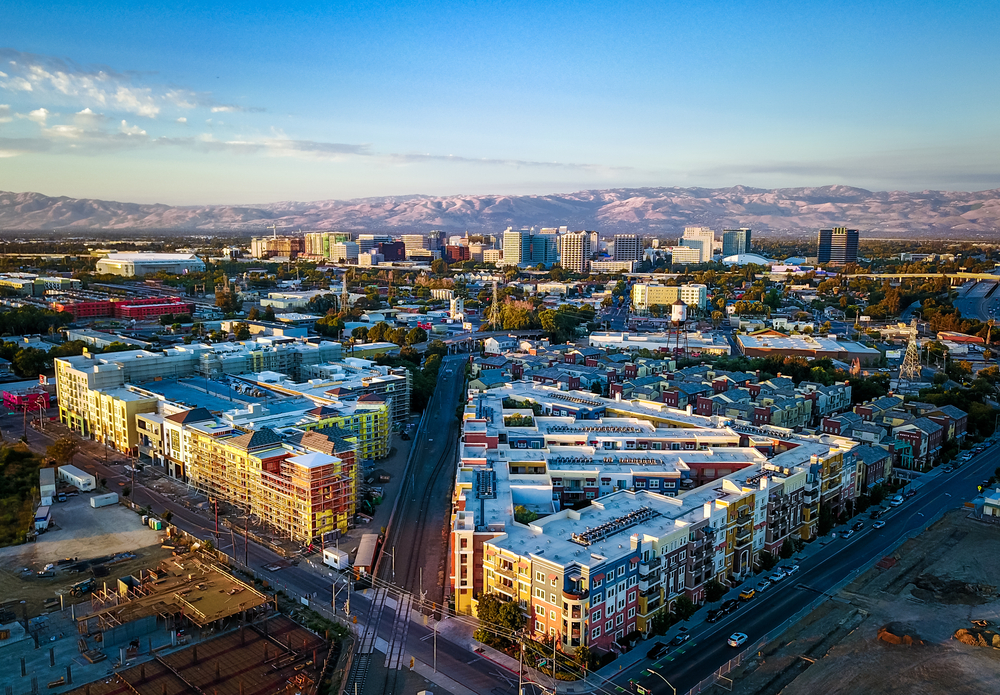
Photo Credit: Uladzik Kryhin / Shutterstock
3. San Jose-Sunnyvale-Santa Clara, CA
- Median annual wage for solar panel installers (adjusted): $51,700
- Median annual wage for solar panel installers (actual): $57,720
- Median annual wage for all construction trades workers (actual): $75,230
- Concentration of solar panel installers: 260% higher than average

Photo Credit: Sundry Photography / Shutterstock
2. Santa Cruz-Watsonville, CA
- Median annual wage for solar panel installers (adjusted): $52,824
- Median annual wage for solar panel installers (actual): $57,620
- Median annual wage for all construction trades workers (actual): $62,550
- Concentration of solar panel installers: N/A
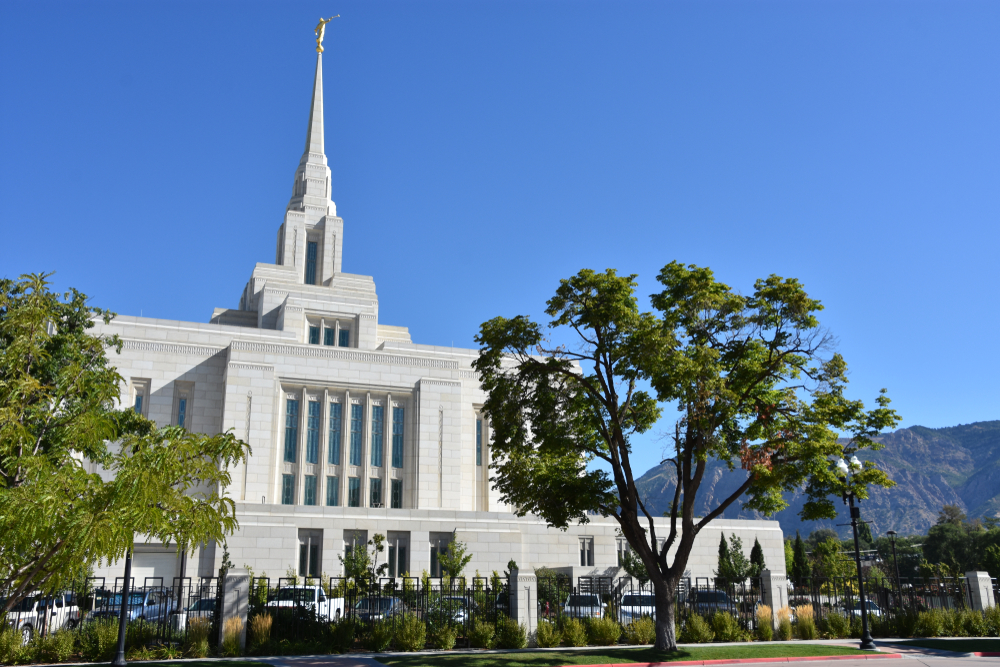
Photo Credit: Ritu Manoj Jethani / Shutterstock
1. Ogden-Clearfield, UT
- Median annual wage for solar panel installers (adjusted): $70,405
- Median annual wage for solar panel installers (actual): $65,930
- Median annual wage for all construction trades workers (actual): $47,480
- Concentration of solar panel installers: 35% higher than average
Detailed Findings & Methodology
The data used in this analysis is from the U.S. Bureau of Labor Statistics Occupational Employment and Wage Statistics and the U.S. Bureau of Economic Analysis Regional Price Parities. To determine the best-paying cities for solar panel installers, researchers at Construction Coverage calculated the median annual wage for solar panel installers, adjusted for cost of living. Researchers also calculated the median annual wage for all construction trades and the concentration of solar panel workers’ compared to the national average. Note, only locations with data available for the solar panel installer occupation in the year 2022 were included in the analysis.