
The Best-Paying American Cities for Welders in 2022
In recent years, policymakers and economic experts have embraced efforts to bring more manufacturing jobs back to the U.S. From the “America First” trade deals in the Trump Administration to historic investments in domestic manufacturing under the Biden Administration, industrial policy has emerged as a major issue on both sides of the aisle. And in light of COVID-19’s impacts on global supply chains, many observers agree that expanding domestic manufacturing is critical for the nation’s economy.
Efforts to bring back American manufacturing would mean overcoming economic forces that have led to the industry’s decline. After being critical to the growth of the middle class in the U.S. for generations, manufacturing roles have faced challenging conditions over the last few decades. The recession and inflationary period of the 1970s led many U.S. manufacturers to cut jobs and offshore factories to create savings. Free trade agreements like NAFTA in the 1990s accelerated the movement of production jobs abroad. And even for factories that have remained in the U.S., automation and technological advances have improved productivity at the expense of many workers’ jobs.
RELATED
A welding business should have commercial property insurance to cover its facilities from damage, as well as general liability insurance to cover the business in the event of a lawsuit.
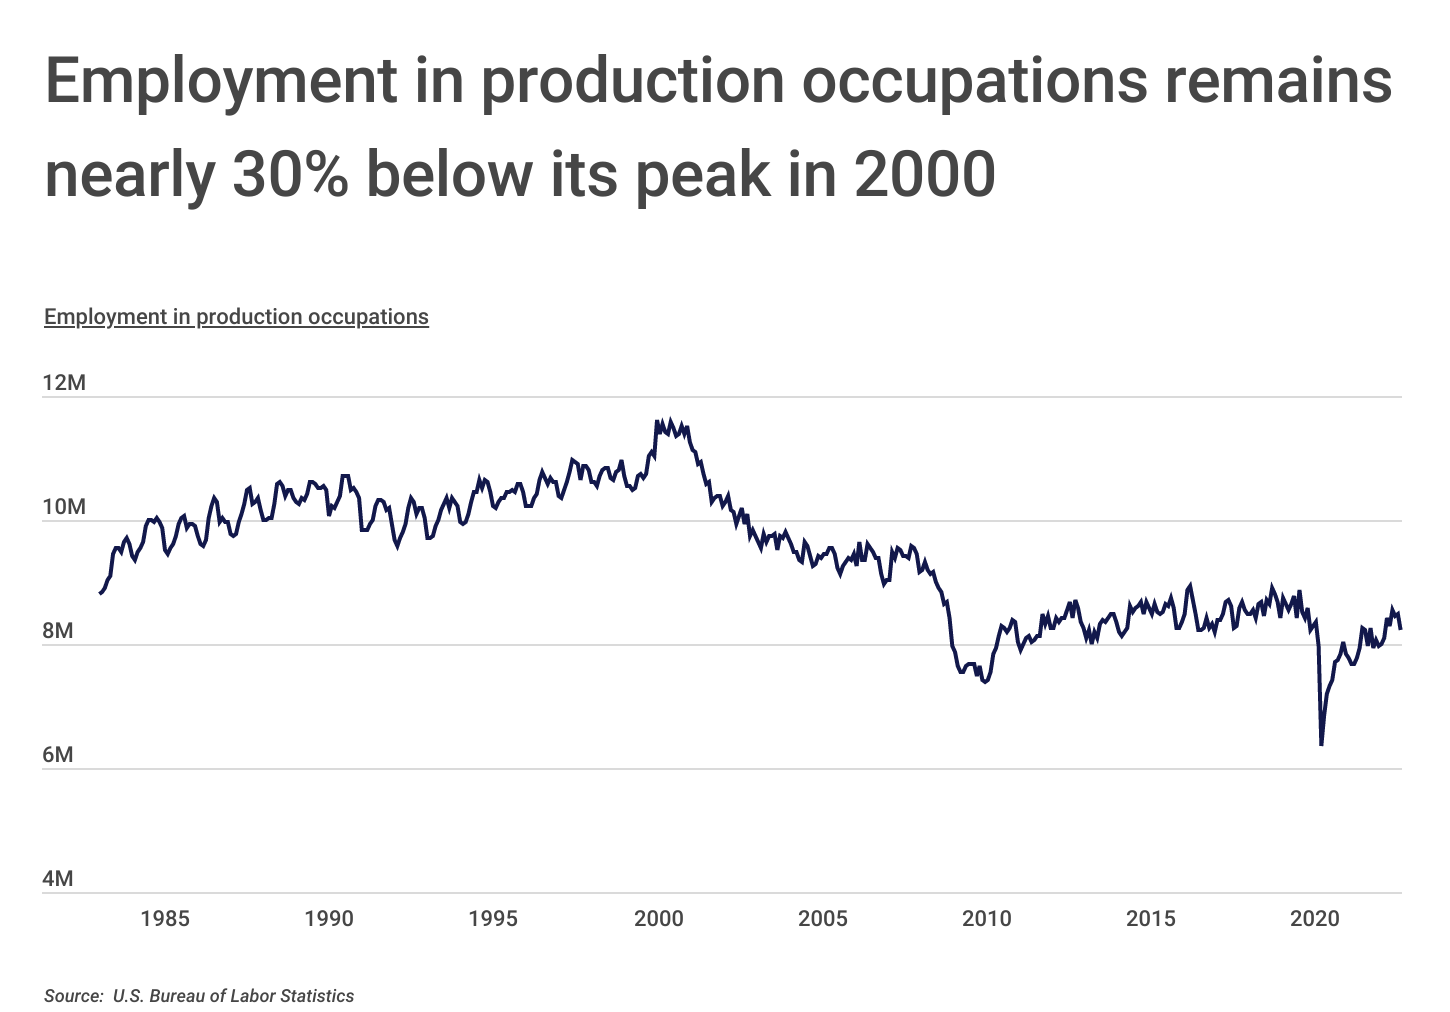
The result has been a rapid decrease in employment in production occupations over the last few decades. In the year 2000, U.S. employment in such roles peaked at 11.6 million workers. Over the following decade, production jobs fell by more than a third to around 7.6 million, with nearly 2 million jobs lost from 2008 to 2010 alone in the wake of the Great Recession.
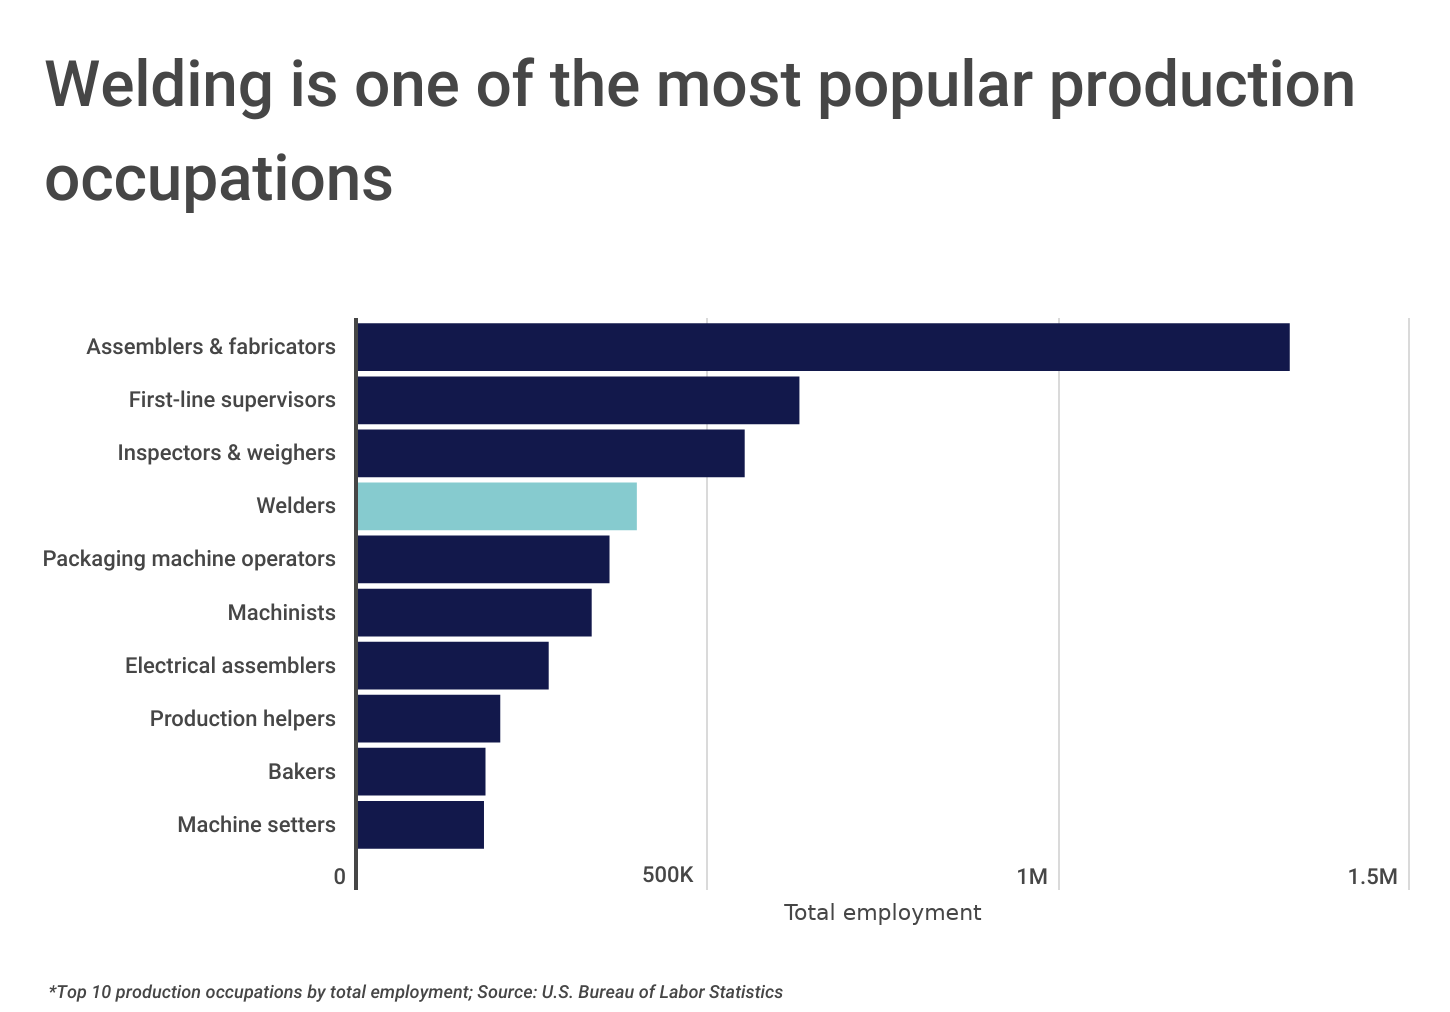
One profession that has continued to provide opportunity for production workers is welding. Welders, cutters, solderers, and brazers play an important role in manufacturing processes for metal parts and products. The U.S. currently employs 397,600 welders, which ranks fourth among all production occupations. However, the job outlook for welders in the years ahead is more challenging: the BLS estimates that employment in the field will grow by only 2% between now and 2031, below the 6% rate of growth for all occupations.
Compensation is one attribute that makes welding a desirable profession. The rate of pay for welders compares favorably not only to other production occupations, but also to U.S. occupations overall. Welders earn a median wage of $47,010, which exceeds the overall U.S. median of $45,760 and ranks toward the top of jobs in production roles.
FOR WELDERS
For welders that perform work at a variety of different locations, tools and equipment insurance can provide financial protection in the event that their tools are damaged or stolen while in transit.
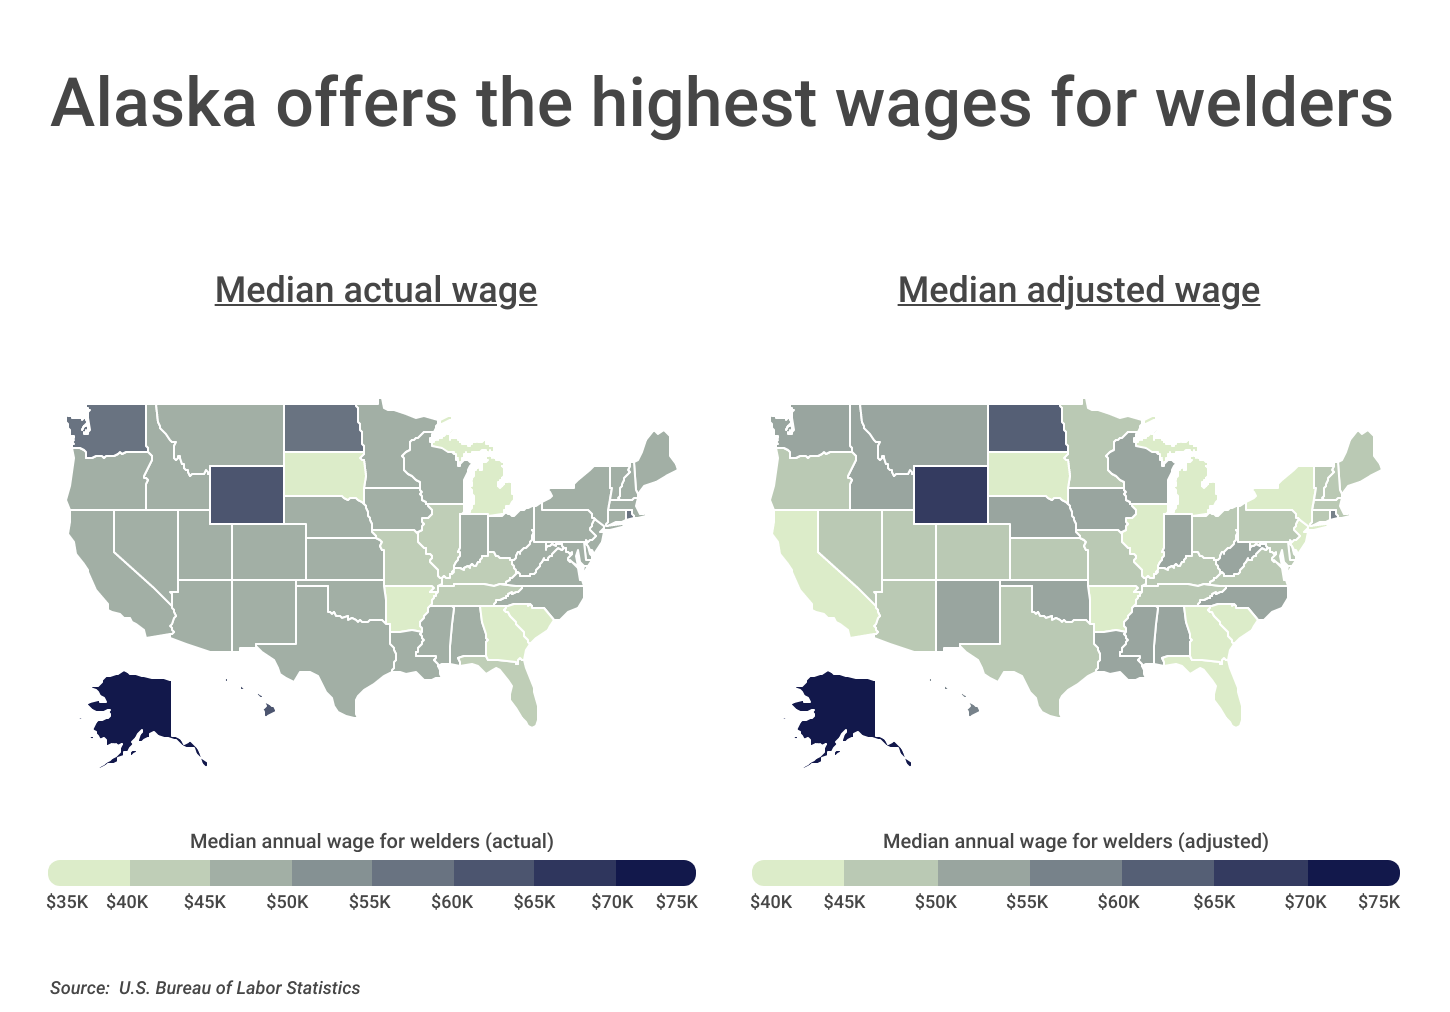
Opportunities for welders can vary across the country depending on local economic makeup. Many of the top-paying states for welders also have industries that rely heavily on welding, like oil and gas extraction, ship and boat building, and aerospace. For example, Alaska, Wyoming, and North Dakota are the top three states for welders’ compensation, and all have economies heavily reliant on oil and gas extraction.
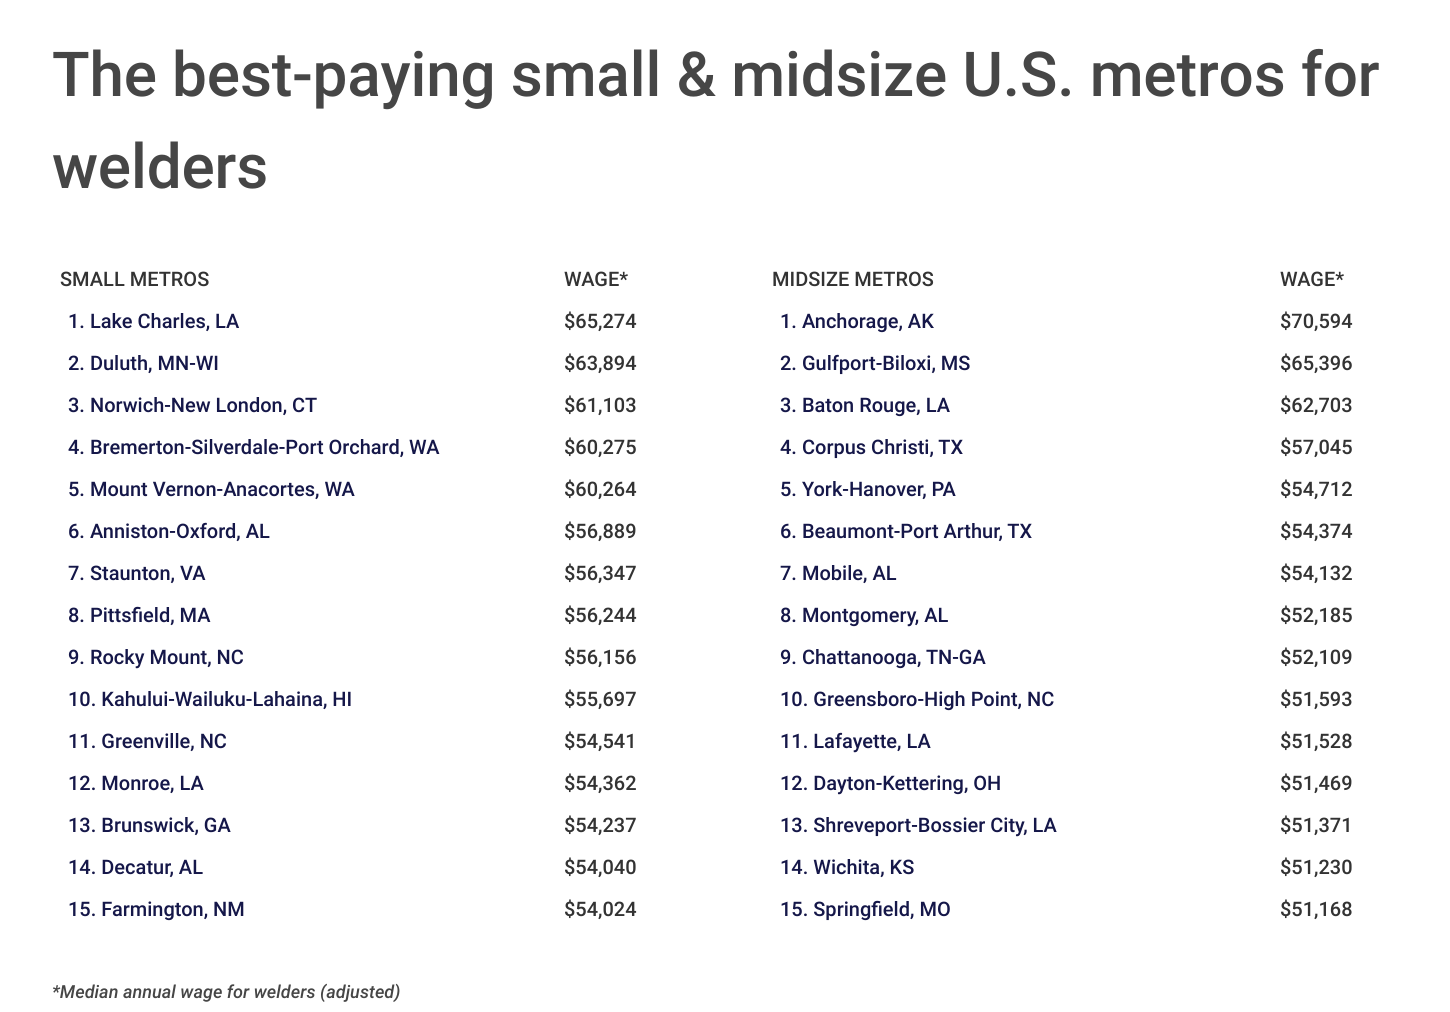
At the metro level, similar patterns hold. Markets with industries that rely heavily on welders tend to have higher compensation to attract those workers. Among the top-paying metros are cities like Norfolk, VA and Honolulu, HI, which are both home to major naval installations, and Seattle, which is a hub for aerospace manufacturing.
The data used in this analysis is from the U.S. Bureau of Labor Statistics and the U.S. Bureau of Economic Analysis. To determine the best-paying locations for welders, researchers at Construction Coverage calculated the median annual wage for welders, adjusted for cost of living differences. In the event of a tie, the location with the greater unadjusted median annual wage for welders was ranked higher.
Here are the best-paying U.S. metropolitan areas for welders.
The Best-Paying Large U.S. Metros for Welders

Photo Credit: Farid Sani / Shutterstock
15. Raleigh-Cary, NC
- Median annual wage for welders (adjusted): $50,251
- Median annual wage for welders (actual): $48,090
- Median annual wage for all production occupations (actual): $36,920
- Concentration of production occupations (compared to average): -35%
RELATED
Workers’ compensation insurance is critical for businesses operating in high-risk industries such as welding. This type of insurance covers lost wages and medical expenses for employees who are injured while performing their job duties. Without workers’ comp insurance, a business may be financially responsible for paying these costs out-of-pocket.

Photo Credit: The Speedy Butterfly / Shutterstock
14. Memphis, TN-MS-AR
- Median annual wage for welders (adjusted): $50,313
- Median annual wage for welders (actual): $46,640
- Median annual wage for all production occupations (actual): $36,940
- Concentration of production occupations (compared to average): -19%
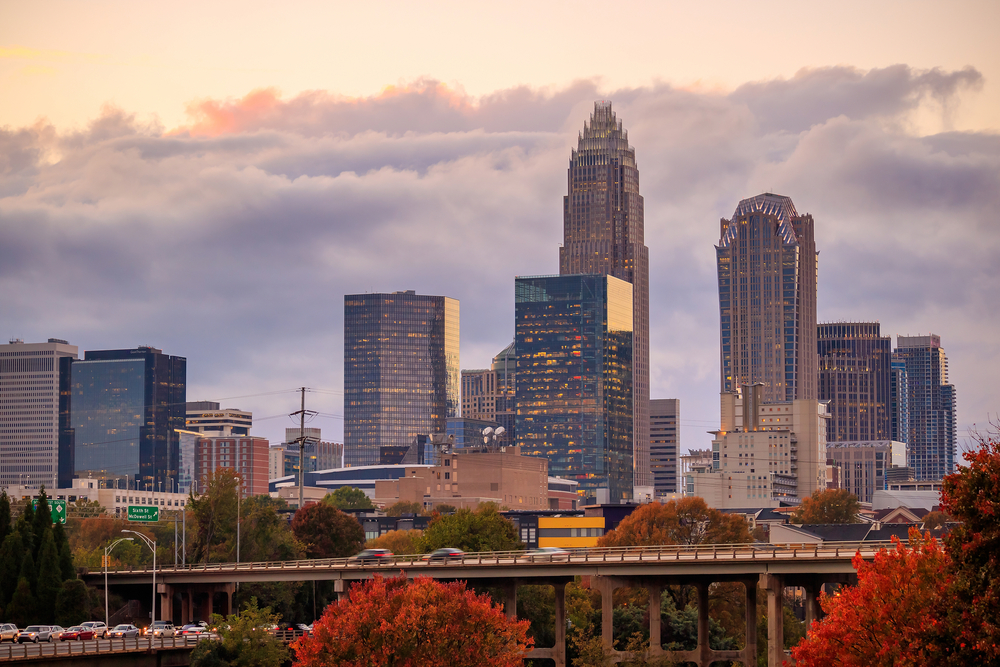
Photo Credit: f11photo / Shutterstock
13. Charlotte-Concord-Gastonia, NC-SC
- Median annual wage for welders (adjusted): $50,571
- Median annual wage for welders (actual): $47,840
- Median annual wage for all production occupations (actual): $37,630
- Concentration of production occupations (compared to average): -5%

Photo Credit: Sean Pavone / Shutterstock
12. Richmond, VA
- Median annual wage for welders (adjusted): $50,671
- Median annual wage for welders (actual): $48,340
- Median annual wage for all production occupations (actual): $37,990
- Concentration of production occupations (compared to average): -52%

Photo Credit: Sean Pavone / Shutterstock
11. Birmingham-Hoover, AL
- Median annual wage for welders (adjusted): $51,048
- Median annual wage for welders (actual): $47,270
- Median annual wage for all production occupations (actual): $36,750
- Concentration of production occupations (compared to average): +57%

Photo Credit: Sean Pavone / Shutterstock
10. New Orleans-Metairie, LA
- Median annual wage for welders (adjusted): $51,146
- Median annual wage for welders (actual): $49,560
- Median annual wage for all production occupations (actual): $46,640
- Concentration of production occupations (compared to average): +29%
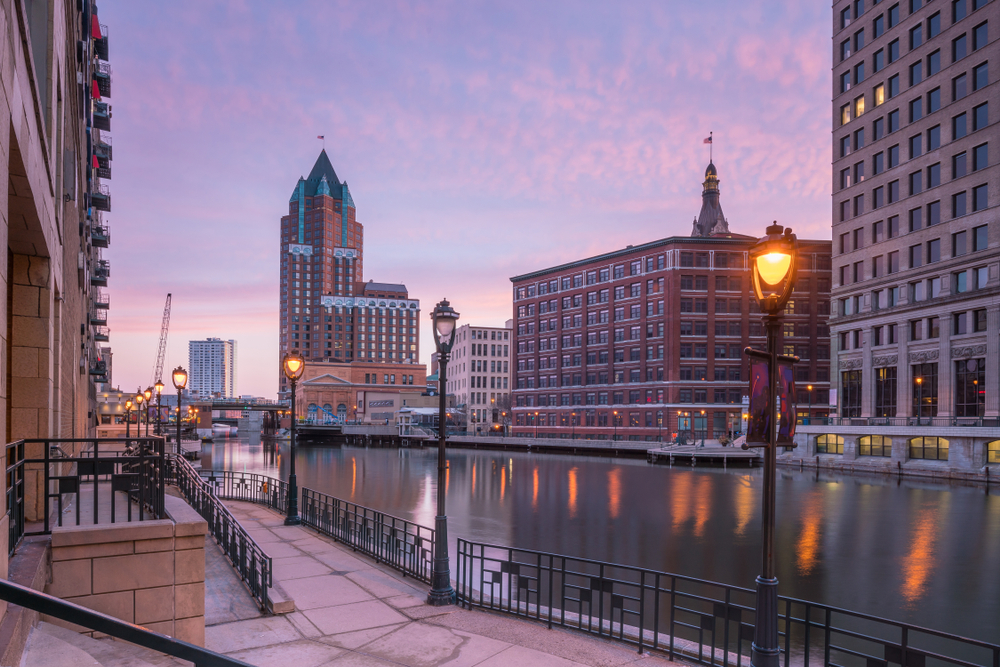
Photo Credit: f11photo / Shutterstock
9. Milwaukee-Waukesha, WI
- Median annual wage for welders (adjusted): $51,283
- Median annual wage for welders (actual): $49,180
- Median annual wage for all production occupations (actual): $39,020
- Concentration of production occupations (compared to average): +83%

Photo Credit: Valiik30 / Shutterstock
8. Tulsa, OK
- Median annual wage for welders (adjusted): $51,389
- Median annual wage for welders (actual): $47,740
- Median annual wage for all production occupations (actual): $39,730
- Concentration of production occupations (compared to average): +240%

Photo Credit: Jeremy Janus / Shutterstock
7. Seattle-Tacoma-Bellevue, WA
- Median annual wage for welders (adjusted): $51,795
- Median annual wage for welders (actual): $58,010
- Median annual wage for all production occupations (actual): $47,740
- Concentration of production occupations (compared to average): -49%

Photo Credit: Sean Pavone / Shutterstock
6. Baltimore-Columbia-Towson, MD
- Median annual wage for welders (adjusted): $51,992
- Median annual wage for welders (actual): $54,800
- Median annual wage for all production occupations (actual): $38,100
- Concentration of production occupations (compared to average): -68%

Photo Credit: f11photo / Shutterstock
5. Washington-Arlington-Alexandria, DC-VA-MD-WV
- Median annual wage for welders (adjusted): $52,081
- Median annual wage for welders (actual): $58,070
- Median annual wage for all production occupations (actual): $44,680
- Concentration of production occupations (compared to average): -81%

Photo Credit: Sundry Photography / Shutterstock
4. San Jose-Sunnyvale-Santa Clara, CA
- Median annual wage for welders (adjusted): $52,105
- Median annual wage for welders (actual): $58,410
- Median annual wage for all production occupations (actual): $46,520
- Concentration of production occupations (compared to average): -53%

Photo Credit: ESB Professional / Shutterstock
3. Providence-Warwick, RI-MA
- Median annual wage for welders (adjusted): $55,534
- Median annual wage for welders (actual): $56,200
- Median annual wage for all production occupations (actual): $38,170
- Concentration of production occupations (compared to average): +6%

Photo Credit: Izabela23 / Shutterstock
2. Urban Honolulu, HI
- Median annual wage for welders (adjusted): $59,438
- Median annual wage for welders (actual): $67,640
- Median annual wage for all production occupations (actual): $46,290
- Concentration of production occupations (compared to average): -47%

Photo Credit: Jon Bilous / Shutterstock
1. Virginia Beach-Norfolk-Newport News, VA-NC
- Median annual wage for welders (adjusted): $61,694
- Median annual wage for welders (actual): $59,350
- Median annual wage for all production occupations (actual): $46,220
- Concentration of production occupations (compared to average): +123%
Detailed Findings & Methodology
The data used in this analysis is from the U.S. Bureau of Labor Statistics Occupational Employment and Wage Statistics and the U.S. Bureau of Economic Analysis Regional Price Parities datasets. To determine the best-paying locations for welders, researchers at Construction Coverage calculated the median annual wage for welders, adjusted for regional-specific cost of living differences. In the event of a tie, the location with the greater unadjusted median annual wage for welders was ranked higher. To improve relevance, only metropolitan areas with at least 100,000 residents were included. Additionally, metros were grouped into cohorts based on population size: small (100,000-349,999), midsize (350,000-999,999), and large (1,000,000 or more).