
U.S. Cities Most Impacted by High Interest Rates
Note: This is the most recent release of our U.S. Cities Most Impacted by High Interest Rates study. To see data from prior years, please visit the Full Results section below.
The path to homeownership has been a tumultuous one for prospective buyers in recent years, characterized by a series of fluctuating trends and economic uncertainties. While buyers benefited from historically low interest rates early in the pandemic, they also faced record price increases due to constrained inventory and intense competition. Now, the landscape has shifted, but not in ways that have provided much relief.
Although high interest rates have moderated home prices to some extent, the adjustments have not proven sufficient to counterbalance the heightened borrowing costs associated with these elevated rates. Compounding these challenges is the enduring scarcity of housing inventory, which persists across various cities, thereby sustaining relatively high price levels and perpetuating affordability concerns for aspiring homeowners.
The result? The estimated monthly mortgage payment for a median-priced U.S. home is nearly 60% higher today than it was just three years ago.
Trends in U.S. Mortgage Rates & Payments
Despite decreasing from the 2023 peak, mortgage rates and payments remain at near-record highs
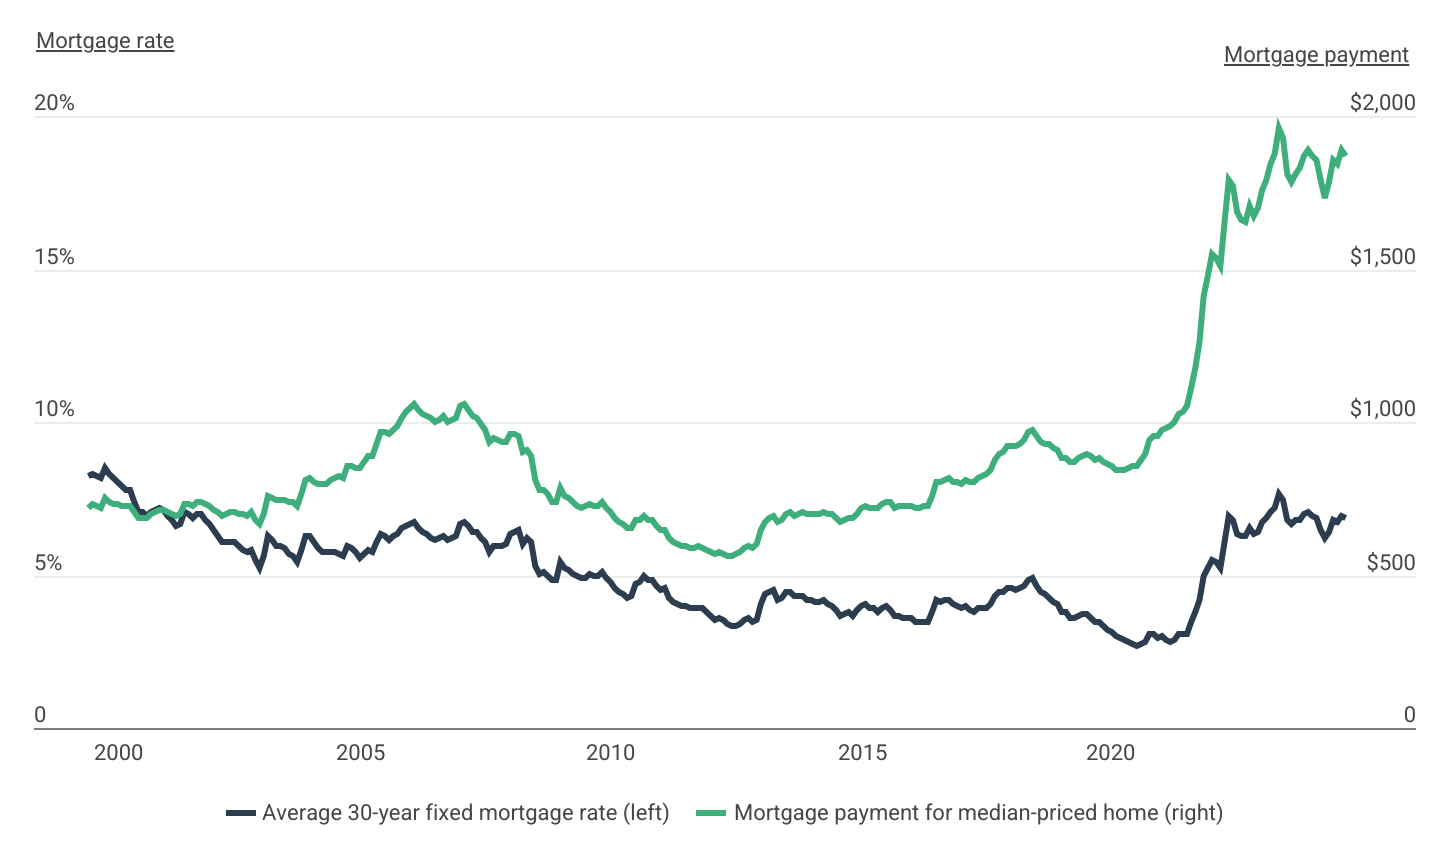
It’s been more than two decades since homebuyers in the U.S. faced interest rates comparable to current levels. Despite a slight decline from its late 2023 peak of 7.6%, the average 30-year fixed mortgage rate today of approximately 6.6% to 6.8% remains at the highest level since 2002 and more than 2.5 times higher than the record lows of early 2021. While this uptick has led to a slight decrease in home prices, the reduction has not been significant enough to offset the increased borrowing costs associated with the higher rates.
For perspective, between February 2022 and February 2025 (the latest three-year period with available data), average mortgage rates climbed 80%, from 3.8% to 6.8%. At the same time, median home prices rose from $317,185 to $357,138. Taken together, this has resulted in the mortgage payment for a median-priced home growing by nearly $700 per month, from $1,177 to $1,870.
RELATED
With the slowdown of the housing market, construction companies may face financial difficulties and have to find ways to reduce operating costs to stay afloat. One approach that businesses can take is to reduce insurance costs that are tied to their business volume. For instance, the cost of general liability insurance for contractors is often calculated based on the size of the business. Therefore, if a company is experiencing a decline in business or working on smaller projects, it may be feasible to reduce its liability coverage. This also applies to errors & omissions insurance and surety bonds.
Where Buyers Are Most Impacted by High Mortgage Rates & Prices
Homebuyers on the East Coast face some of the sharpest increases in mortgage payments
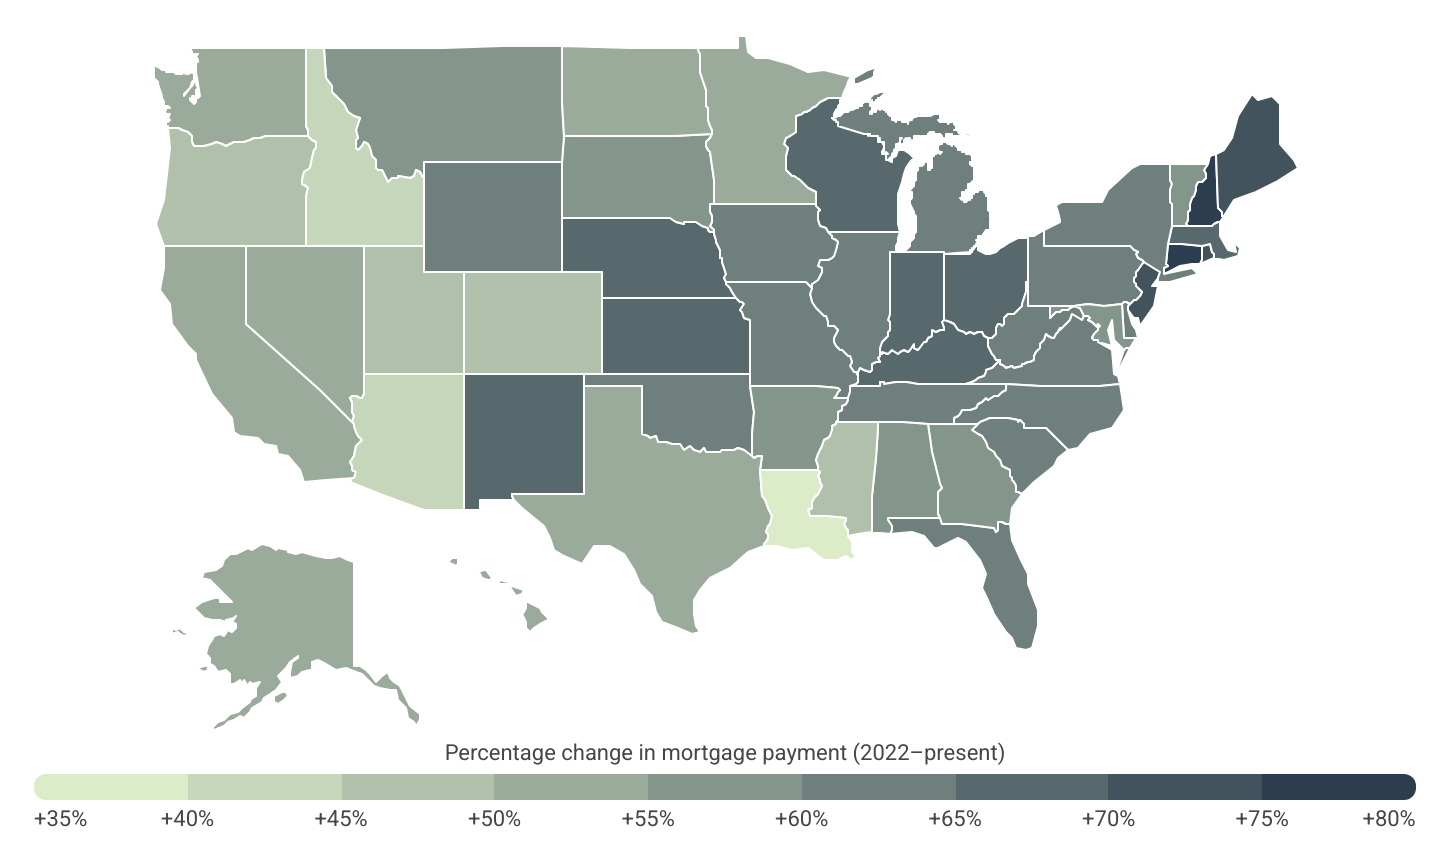
While mortgage rates are up nationally, the impact on home prices has varied regionally. In many western states—such as California and Arizona—home prices declined between 2022 and 2023, followed by minimal or stagnant growth since then. In contrast, several East Coast states experienced smaller or negligible price drops during the same period and have continued to see steady appreciation.
Consequently, prospective buyers on the East Coast confront some of the most substantial hikes in mortgage payments when comparing early 2025 to the corresponding period in 2022. In states like Connecticut, New Hampshire, New Jersey, Rhode Island, and Maine, estimated monthly mortgage payments for median-priced homes have surged by over 70% during this three-year span.
Conversely, buyers in select parts of the South and West have experienced comparatively modest increases in mortgage payments since 2022. Notably, Idaho and Louisiana stand out as the only states where estimated mortgage payments rose by 40% or less during this time. However, it is worth noting that many states with slower increases over the past three years are those that had more significant price increases early on in the pandemic—between 2020 and 2022. Consequently, their slower growth since 2022 is unsurprising given the earlier surge in prices.
Below is a complete breakdown of estimated monthly mortgage payments for nearly 370 U.S. metropolitan areas and all 50 states. The analysis was conducted by Construction Coverage using data from Freddie Mac and Zillow. For more information on the analysis, refer to the methodology section below.
Cities Most Impacted by High Interest Rates
| Top Large Metros | Change* |
|---|---|
| 1. Rochester, NY | +83.6% |
| 2. Hartford-East Hartford-Middletown, CT | +83.4% |
| 3. Miami-Fort Lauderdale-Pompano Beach, FL | +74.2% |
| 4. Providence-Warwick, RI-MA | +73.9% |
| 5. Buffalo-Cheektowaga, NY | +71.9% |
| 6. Cleveland, OH | +71.8% |
| 7. Milwaukee-Waukesha, WI | +71.6% |
| 8. Philadelphia-Camden-Wilmington, PA-NJ-DE-MD | +68.3% |
| 9. Richmond, VA | +67.6% |
| 10. Columbus, OH | +67.3% |
| 11. Boston-Cambridge-Newton, MA-NH | +66.5% |
| 12. Cincinnati, OH-KY-IN | +66.1% |
| 13. Virginia Beach-Norfolk-Newport News, VA-NC | +64.8% |
| 14. Grand Rapids-Kentwood, MI | +64.4% |
| 15. St. Louis, MO-IL | +64.4% |
| Bottom Large Metros | Change* |
|---|---|
| 1. Austin-Round Rock-Georgetown, TX | +24.0% |
| 2. San Francisco-Oakland-Berkeley, CA | +38.7% |
| 3. Sacramento-Roseville-Folsom, CA | +42.4% |
| 4. Phoenix-Mesa-Chandler, AZ | +42.9% |
| 5. San Antonio-New Braunfels, TX | +43.0% |
| 6. Portland-Vancouver-Hillsboro, OR-WA | +45.4% |
| 7. Denver-Aurora-Lakewood, CO | +45.6% |
| 8. Salt Lake City, UT | +47.7% |
| 9. Minneapolis-St. Paul-Bloomington, MN-WI | +49.7% |
| 10. Tucson, AZ | +51.1% |
| 11. Dallas-Fort Worth-Arlington, TX | +51.7% |
| 12. Birmingham-Hoover, AL | +52.0% |
| 13. Seattle-Tacoma-Bellevue, WA | +52.0% |
| 14. Houston-The Woodlands-Sugar Land, TX | +52.2% |
| 15. Memphis, TN-MS-AR | +53.4% |
| Top Midsize Metros | Change* |
|---|---|
| 1. Syracuse, NY | +88.1% |
| 2. Fayetteville, NC | +80.4% |
| 3. Atlantic City-Hammonton, NJ | +80.3% |
| 4. New Haven-Milford, CT | +80.2% |
| 5. Savannah, GA | +80.0% |
| 6. Knoxville, TN | +79.4% |
| 7. Trenton-Princeton, NJ | +79.3% |
| 8. Manchester-Nashua, NH | +78.8% |
| 9. Reading, PA | +77.6% |
| 10. Worcester, MA-CT | +75.1% |
| 11. Bridgeport-Stamford-Norwalk, CT | +73.5% |
| 12. Hickory-Lenoir-Morganton, NC | +73.4% |
| 13. Fort Wayne, IN | +73.4% |
| 14. Lexington-Fayette, KY | +72.5% |
| 15. McAllen-Edinburg-Mission, TX | +72.5% |
| Bottom Midsize Metros | Change* |
|---|---|
| 1. New Orleans-Metairie, LA | +25.4% |
| 2. Boise City, ID | +35.6% |
| 3. Beaumont-Port Arthur, TX | +37.0% |
| 4. Lafayette, LA | +38.2% |
| 5. Vallejo, CA | +41.6% |
| 6. Colorado Springs, CO | +43.0% |
| 7. Corpus Christi, TX | +43.9% |
| 8. Provo-Orem, UT | +44.5% |
| 9. Reno, NV | +44.6% |
| 10. Stockton, CA | +44.9% |
| 11. Greeley, CO | +45.2% |
| 12. Urban Honolulu, HI | +46.4% |
| 13. Santa Rosa-Petaluma, CA | +47.2% |
| 14. Spokane-Spokane Valley, WA | +47.8% |
| 15. Shreveport-Bossier City, LA | +48.4% |
| Top Small Metros | Change* |
|---|---|
| 1. Beckley, WV | +85.0% |
| 2. Rockford, IL | +83.1% |
| 3. Hinesville, GA | +82.1% |
| 4. Springfield, OH | +80.5% |
| 5. Sheboygan, WI | +79.9% |
| 6. Norwich-New London, CT | +79.4% |
| 7. Great Falls, MT | +77.4% |
| 8. Green Bay, WI | +77.4% |
| 9. Binghamton, NY | +77.1% |
| 10. Appleton, WI | +76.7% |
| 11. Vineland-Bridgeton, NJ | +76.7% |
| 12. Lewiston-Auburn, ME | +76.4% |
| 13. Kingsport-Bristol, TN-VA | +76.4% |
| 14. Muncie, IN | +76.4% |
| 15. Jacksonville, NC | +76.2% |
| Bottom Small Metros | Change* |
|---|---|
| 1. Johnstown, PA | +17.6% |
| 2. Lake Charles, LA | +25.7% |
| 3. Houma-Thibodaux, LA | +30.3% |
| 4. Hammond, LA | +34.1% |
| 5. Chico, CA | +36.1% |
| 6. Texarkana, TX-AR | +40.2% |
| 7. Grants Pass, OR | +40.9% |
| 8. Idaho Falls, ID | +41.3% |
| 9. Punta Gorda, FL | +41.4% |
| 10. Santa Cruz-Watsonville, CA | +42.5% |
| 11. Medford, OR | +43.1% |
| 12. Pueblo, CO | +43.3% |
| 13. Lake Havasu City-Kingman, AZ | +43.7% |
| 14. St. George, UT | +44.3% |
| 15. Redding, CA | +44.4% |
RELATED
Increased interest rates have a far-reaching impact beyond just homeowners. Businesses, too, face various consequences due to the rise in interest rates, including higher insurance premiums. Although policies such as commercial real estate insurance or trucking insurance are relatively less affected by interest rate changes than life insurance, customers may still experience a rise in premiums during high-rate environments.
States Most Impacted by High Interest Rates
| Top States | Change* |
|---|---|
| 1. Connecticut | +79.4% |
| 2. New Hampshire | +78.2% |
| 3. New Jersey | +74.8% |
| 4. Rhode Island | +74.8% |
| 5. Maine | +70.5% |
| 6. Ohio | +69.6% |
| 7. Wisconsin | +69.4% |
| 8. Kansas | +69.1% |
| 9. Massachusetts | +68.5% |
| 10. Kentucky | +68.3% |
| 11. Indiana | +66.2% |
| 12. Nebraska | +65.5% |
| 13. New Mexico | +65.3% |
| 14. Illinois | +64.7% |
| 15. New York | +64.3% |
| Bottom States | Change* |
|---|---|
| 1. Louisiana | +38.1% |
| 2. Idaho | +40.0% |
| 3. Arizona | +44.5% |
| 4. Oregon | +46.4% |
| 5. Utah | +46.8% |
| 6. Colorado | +46.8% |
| 7. Mississippi | +48.5% |
| 8. Texas | +50.1% |
| 9. Alaska | +50.9% |
| 10. Washington | +51.2% |
| 11. Minnesota | +52.4% |
| 12. Hawaii | +52.7% |
| 13. Nevada | +53.2% |
| 14. North Dakota | +53.3% |
| 15. California | +53.9% |
*Percentage change in mortgage payment (2022–present)
Full Results
Methodology
To determine the locations where homebuyers are most impacted by rising interest rates, researchers at Construction Coverage analyzed the latest data from Zillow’s Zillow Home Value Index (ZHVI), a measure of typical home value, and Freddie Mac’s Primary Mortgage Market Survey. The researchers ranked metros according to the percentage change in the hypothetical monthly mortgage payment for a median-priced home between February 2022 and February 2025, factoring in changes in mortgage rates and home prices. In the event of a tie, the metro with the largest total change in mortgage payment was ranked higher. The monthly mortgage payments were calculated by assuming a 30-year fixed rate mortgage with a 20% down payment.
To improve relevance, metropolitan areas were grouped into the following cohorts based on population size:
- Small metros: Less than 350,000
- Midsize metros: 350,000–999,999
- Large metros: More than 1,000,000
References
- U.S. Census Bureau and U.S. Department of Housing and Urban Development (May 23, 2025). Median Sales Price of Houses Sold for the United States (MSPUS). https://fred.stlouisfed.org/series/MSPUS.
- Zillow (2025). Housing Data, Zillow Home Value Index (ZHVI). https://www.zillow.com/research/data/.
- Freddie Mac (April 24, 2025). Mortgage Rates. https://www.freddiemac.com/pmms.