U.S. Cities Spending the Most on Construction per Construction Worker [2021 Edition]
In the aftermath of the COVID-19 pandemic, America’s housing boom has surged to new heights thanks to a combination of factors that homebuyers haven’t experienced since before the housing bubble more than a dozen years ago.
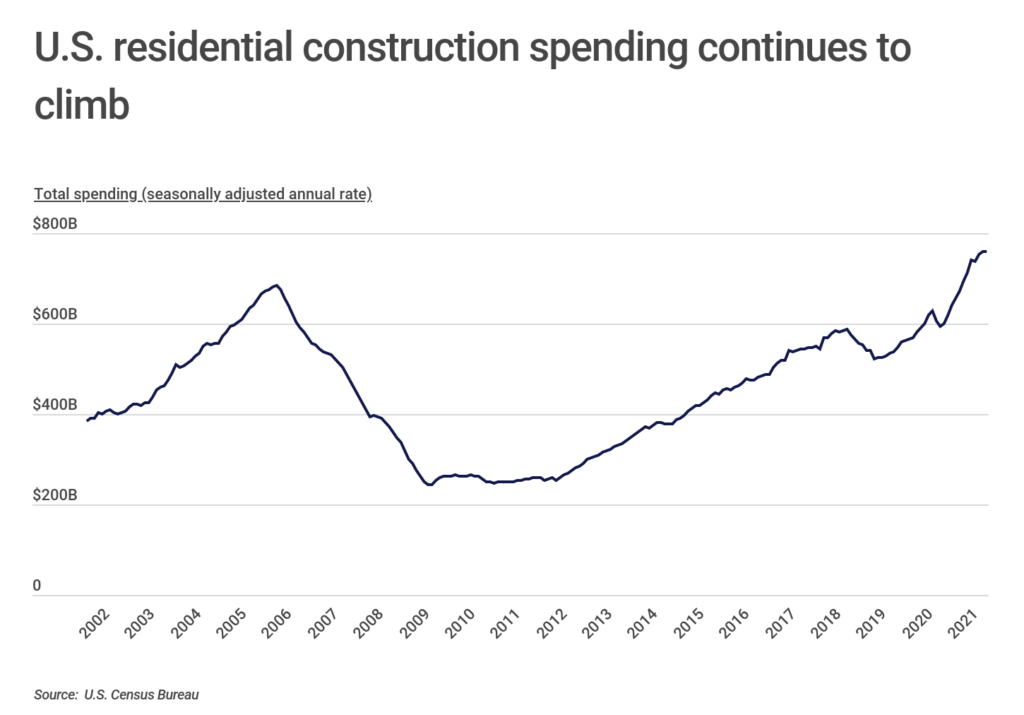
To begin with, fall of 2020 saw the nation’s housing supply hit one of its lowest levels on record since 1963. The severe lack of housing combined with increased demand pushed new home construction to highs not seen in the past 15 years.
On top of that, supply chain disruptions caused by COVID-19 lockdowns caused lumber prices to soar more than 500% in a single year and helped push total residential construction spending to its own record high of more than $760 billion (seasonally adjusted annual rate).
FOR CONSTRUCTION PROFESSIONALS
Is your firm starting a new construction project? Make sure you have the right technology for the job. Construction project management software will help you manage your team, while construction accounting software will help you manage your finances.
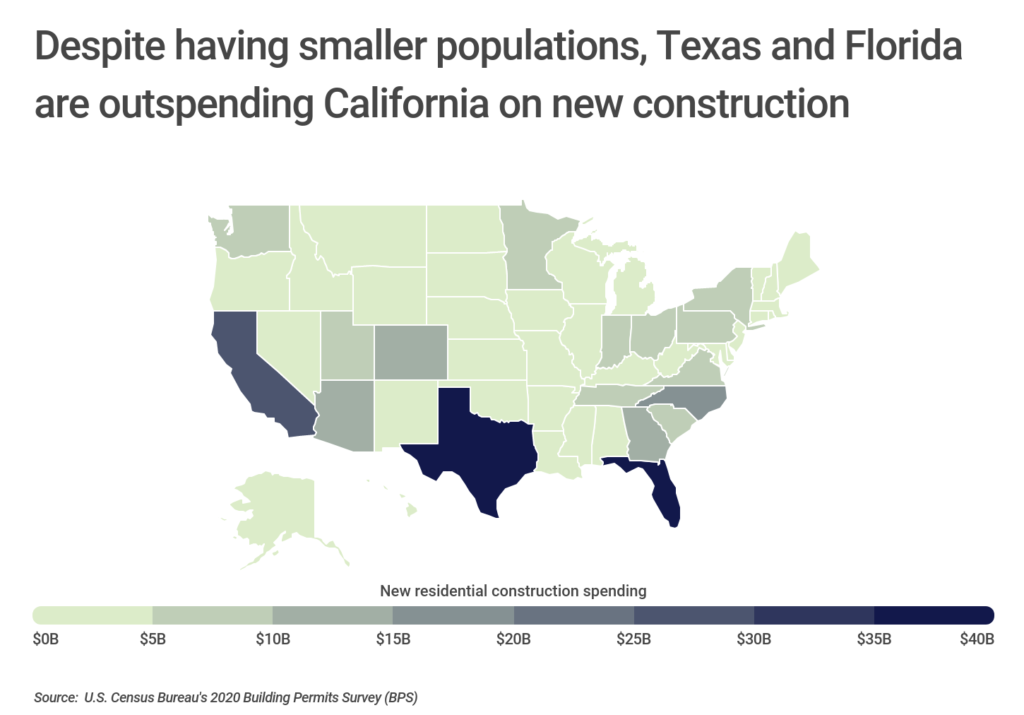
Despite record-setting residential construction nationally, just seven states account for more than half the value of all building permits approved in 2020. Texas led the way with about $43 billion in building permit value last year, followed by Florida ($37 billion), California ($25 billion), North Carolina ($16 billion), and Arizona ($14 billion). Georgia and Colorado were the only other states to clear the $10 billion threshold.
That both Texas and Florida outspent California—despite having smaller populations than the Golden State—underscores the fact that housing growth is shifting to lower-cost destinations in the South.
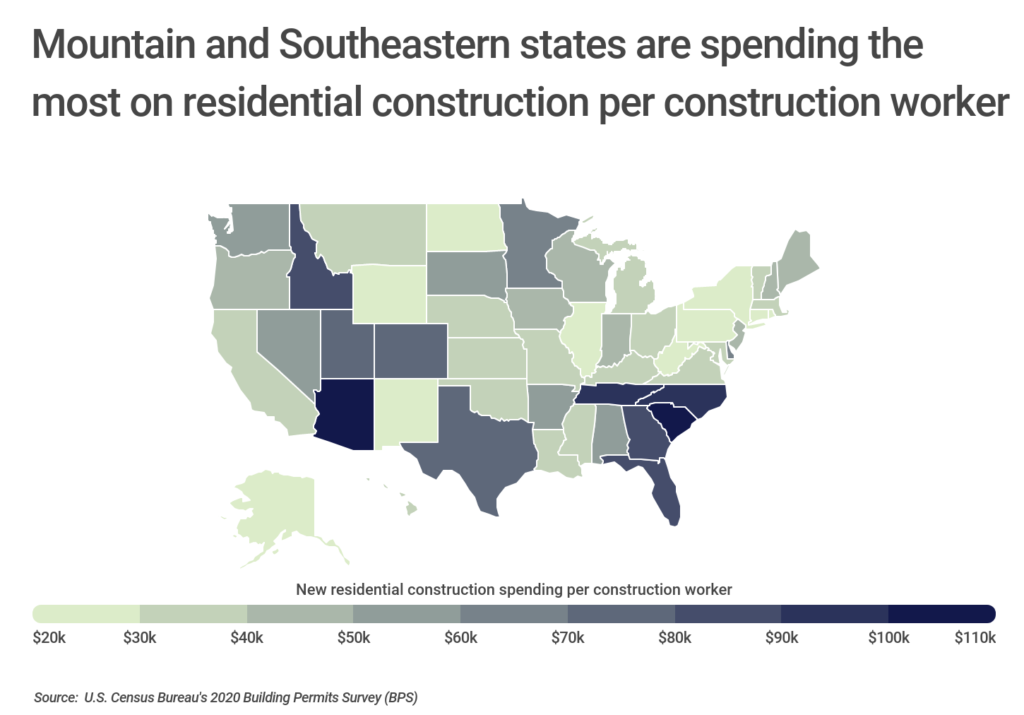
The flood of money into new housing has been a boon for construction companies across the country, but a combination of spending and labor force differences means there has been far more construction activity per worker in certain parts of the country. Several Southeastern and Mountain states reported roughly two times as much new residential spending per construction worker compared to the national average of $51,738 in 2020.
New residential spending in South Carolina and Arizona topped $100,000 per worker, while Tennessee, North Carolina, Idaho, and Florida came in around $90,000. Meanwhile, spending was lowest per worker in and around the Mid-Atlantic Region, where West Virginia claimed just $14,367 and Rhode Island, New York, Connecticut, and Pennsylvania each reported less than $24,000 per construction worker.
To rank individual metropolitan areas on their annual new residential construction spending per construction worker, researchers at Construction Coverage divided the value of building permits authorized in 2020, taken from the U.S. Census Bureau’s Building Permits Survey, by the number of construction workers employed there, according to the Bureau of Labor Statistics. Researchers also included statistics on construction employment and wages in each location.
Here are the metros spending the most on new home construction per construction worker.
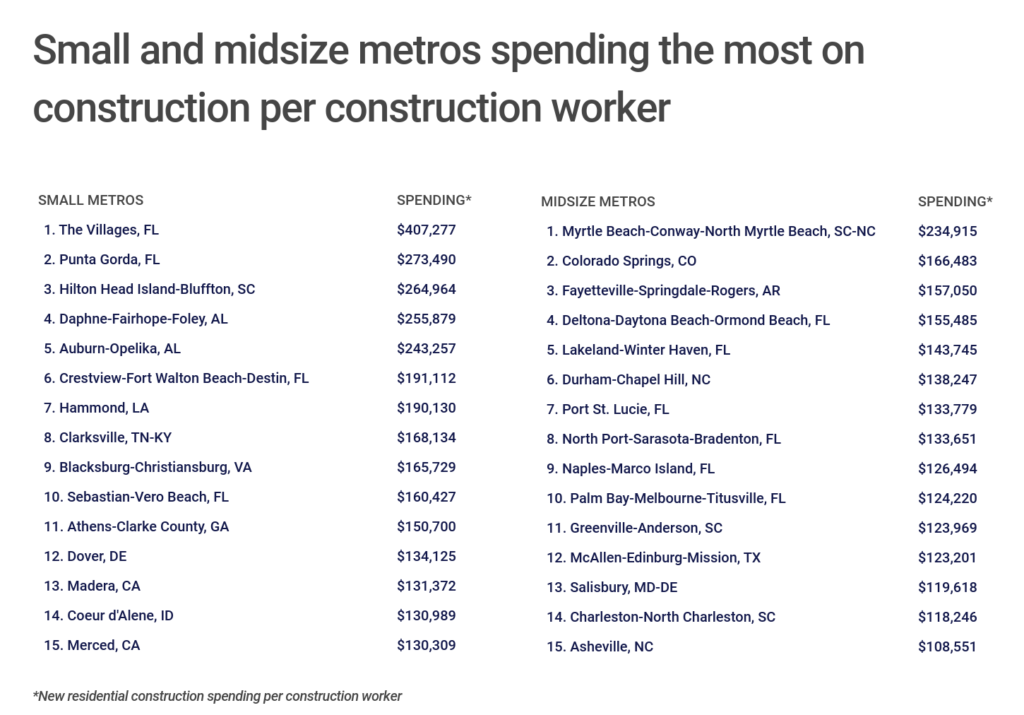
Large Metros Spending the Most on Construction per Construction Worker
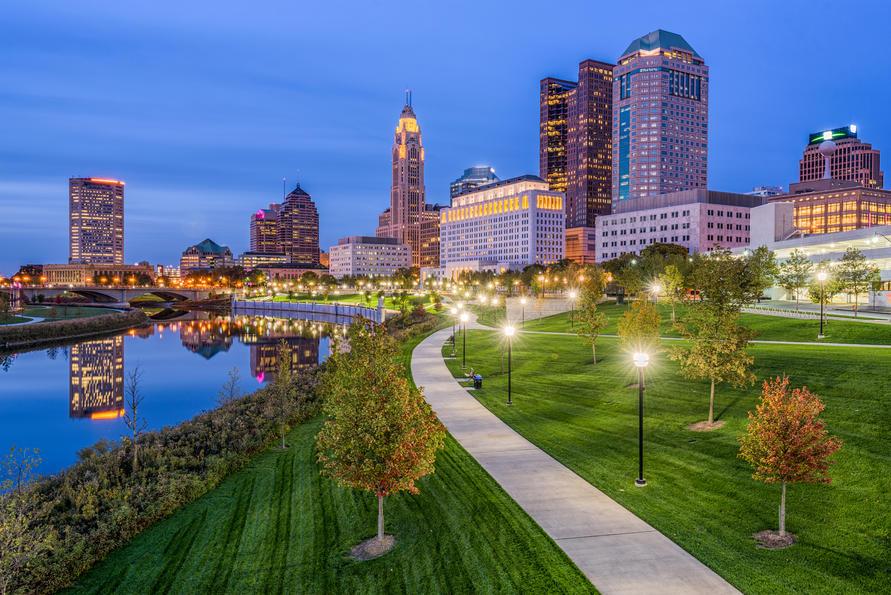
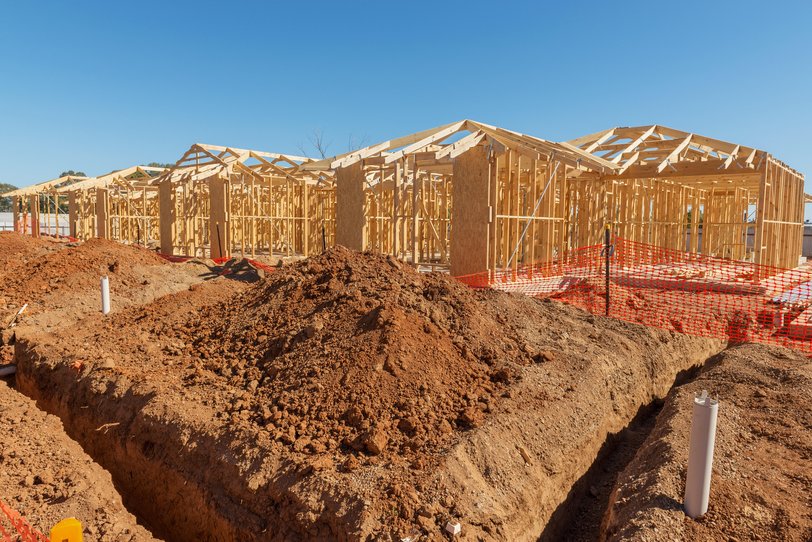
Photo Credit: Alamy Stock Photo
15. Columbus, OH
- New residential construction spending per construction worker: $69,610
- New residential construction spending: $2,226,124,000
- Total construction workers: 31,980
- Relative concentration of construction workers: -27%
- Median annual wage for construction workers: $64,190
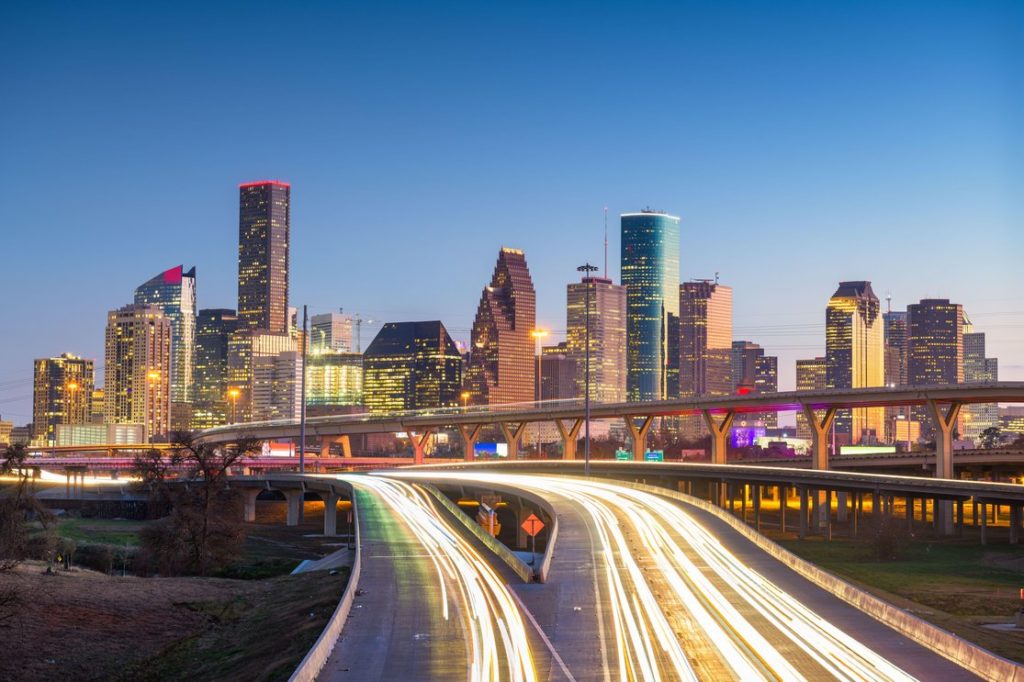
Photo Credit: Alamy Stock Photo
14. Houston-The Woodlands-Sugar Land, TX
- New residential construction spending per construction worker: $72,476
- New residential construction spending: $12,702,945,000
- Total construction workers: 175,270
- Relative concentration of construction workers: +38%
- Median annual wage for construction workers: $58,510
FOR CONSTRUCTION PROFESSIONALS
Managing a construction project involves a lot of risk, which is why there are a handful of insurance products that every construction firm should have:
- Builders risk insurance – covers buildings and other structures while they are under construction.
- Commercial auto insurance – covers vehicles used for business purposes.
- Inland marine insurance – covers tools, equipment, and supplies while in transit.
- Surety bonds – provide a guarantee of work and compliance with state and local regulations.
- Workers’ compensation insurance – protects workers in the event of injury on the job.

Photo Credit: Alamy Stock Photo
13. San Antonio-New Braunfels, TX
- New residential construction spending per construction worker: $73,577
- New residential construction spending: $3,123,325,000
- Total construction workers: 42,450
- Relative concentration of construction workers: -1%
- Median annual wage for construction workers: $51,840

Photo Credit: Alamy Stock Photo
12. Minneapolis-St. Paul-Bloomington, MN-WI
- New residential construction spending per construction worker: $77,508
- New residential construction spending: $4,962,093,000
- Total construction workers: 64,020
- Relative concentration of construction workers: -19%
- Median annual wage for construction workers: $82,140

Photo Credit: Alamy Stock Photo
11. Atlanta-Sandy Springs-Alpharetta, GA
- New residential construction spending per construction worker: $88,236
- New residential construction spending: $7,156,853,000
- Total construction workers: 81,110
- Relative concentration of construction workers: -28%
- Median annual wage for construction workers: $58,280

Photo Credit: Alamy Stock Photo
10. Tampa-St. Petersburg-Clearwater, FL
- New residential construction spending per construction worker: $88,532
- New residential construction spending: $5,299,528,000
- Total construction workers: 59,860
- Relative concentration of construction workers: +8%
- Median annual wage for construction workers: $50,020

Photo Credit: Alamy Stock Photo
9. Tucson, AZ
- New residential construction spending per construction worker: $89,500
- New residential construction spending: $1,394,415,000
- Total construction workers: 15,580
- Relative concentration of construction workers: -1%
- Median annual wage for construction workers: $52,320

Photo Credit: Alamy Stock Photo
8. Dallas-Fort Worth-Arlington, TX
- New residential construction spending per construction worker: $90,848
- New residential construction spending: $13,053,058,000
- Total construction workers: 143,680
- Relative concentration of construction workers: -6%
- Median annual wage for construction workers: $52,740
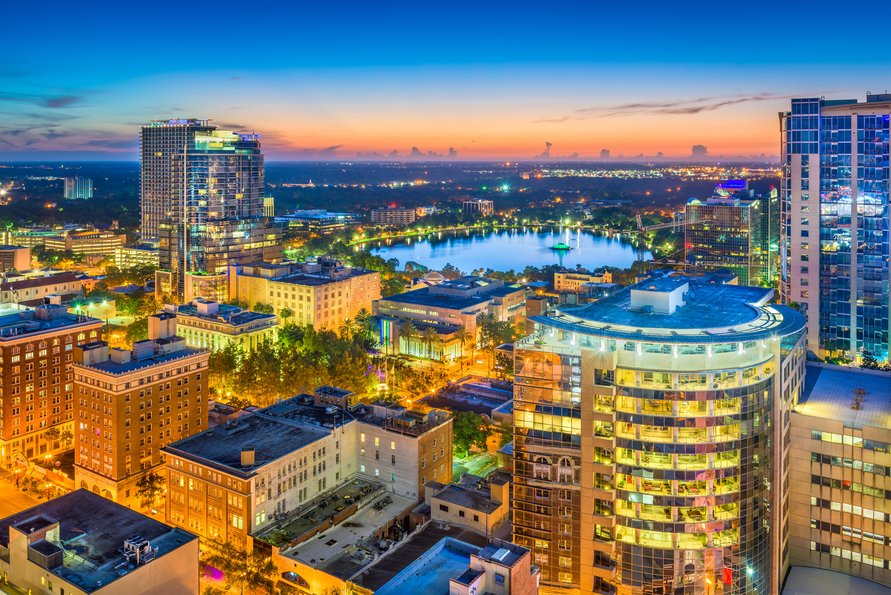
Photo Credit: Alamy Stock Photo
7. Orlando-Kissimmee-Sanford, FL
- New residential construction spending per construction worker: $94,078
- New residential construction spending: $5,478,188,000
- Total construction workers: 58,230
- Relative concentration of construction workers: +14%
- Median annual wage for construction workers: $50,860

Photo Credit: Alamy Stock Photo
6. Jacksonville, FL
- New residential construction spending per construction worker: $96,043
- New residential construction spending: $3,262,575,000
- Total construction workers: 33,970
- Relative concentration of construction workers: +16%
- Median annual wage for construction workers: $48,930

Photo Credit: Alamy Stock Photo
5. Charlotte-Concord-Gastonia, NC-SC
- New residential construction spending per construction worker: $101,366
- New residential construction spending: $5,633,895,000
- Total construction workers: 55,580
- Relative concentration of construction workers: +7%
- Median annual wage for construction workers: $52,650

Photo Credit: Alamy Stock Photo
4. Phoenix-Mesa-Chandler, AZ
- New residential construction spending per construction worker: $104,360
- New residential construction spending: $10,815,836,000
- Total construction workers: 103,640
- Relative concentration of construction workers: +15%
- Median annual wage for construction workers: $59,560
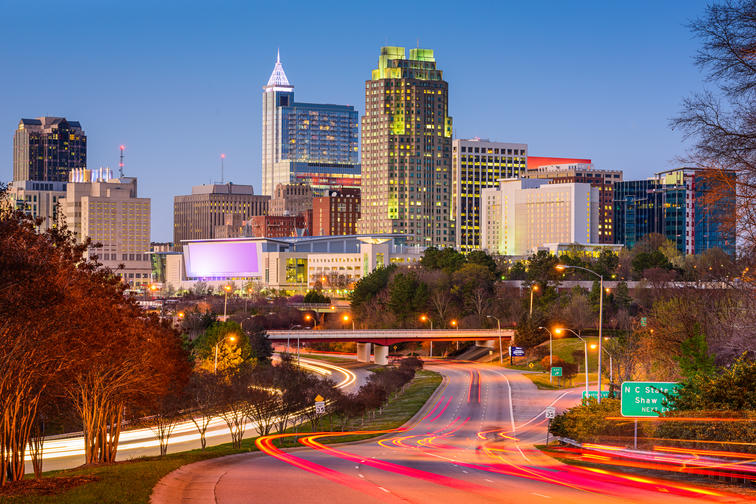
Photo Credit: Alamy Stock Photo
3. Raleigh-Cary, NC
- New residential construction spending per construction worker: $122,805
- New residential construction spending: $3,460,650,000
- Total construction workers: 28,180
- Relative concentration of construction workers: +6%
- Median annual wage for construction workers: $54,810

Photo Credit: Alamy Stock Photo
2. Nashville-Davidson–Murfreesboro–Franklin, TN
- New residential construction spending per construction worker: $150,372
- New residential construction spending: $5,183,315,000
- Total construction workers: 34,470
- Relative concentration of construction workers: -16%
- Median annual wage for construction workers: $52,660

Photo Credit: Alamy Stock Photo
1. Austin-Round Rock-Georgetown, TX
- New residential construction spending per construction worker: $160,551
- New residential construction spending: $7,147,718,000
- Total construction workers: 44,520
- Relative concentration of construction workers: -1%
- Median annual wage for construction workers: $53,050
Methodology & Detailed Findings
To find the metros spending the most on construction per construction worker, researchers at Construction Coverage used the latest data from the U.S. Census Bureau’s Building Permits Survey (BPS) and the Bureau of Labor Statistics’ (BLS) Occupational Employment and Wage Statistics (OEWS). Metropolitan areas were ranked according to the total annual spending on new residential construction per construction worker in the metro. For context, researchers included new residential construction spending totals, as well as the total number, relative concentration of, and median annual wage for construction workers in each location.
To improve relevance, only metropolitan areas with at least 100,000 residents were included in the analysis. Metros were also grouped into the following cohorts based on population size: small (100,000-349,999); midsize (350,000-999,999); and large (1,000,000 or more).