
Homebuyers in These U.S. Cities Get the Best Mortgage Rates
Note: This is the most recent release of our Homebuyers in These U.S. Cities Get the Best Mortgage Rates study. To see data from prior years, please visit the Full Results section below.
Interest rates have become a central concern for both homebuyers and policymakers. The Federal Reserve’s ongoing effort to curb inflation has led to higher borrowing costs, with rates staying elevated longer than many analysts anticipated. This shift has made mortgages significantly more expensive, complicating the path to homeownership for many Americans.
While higher interest rates have somewhat cooled the housing market, they have also driven up the cost to finance a home purchase. As a result, prospective buyers are increasingly caught in a difficult position—facing both elevated home prices and borrowing costs. In this environment, the mortgage rate a buyer can secure has become an important factor in determining housing affordability across different U.S. markets.
Trends in Mortgage Rates
Mortgage interest rates have leveled-off after rising at their fastest pace in more than 50 years
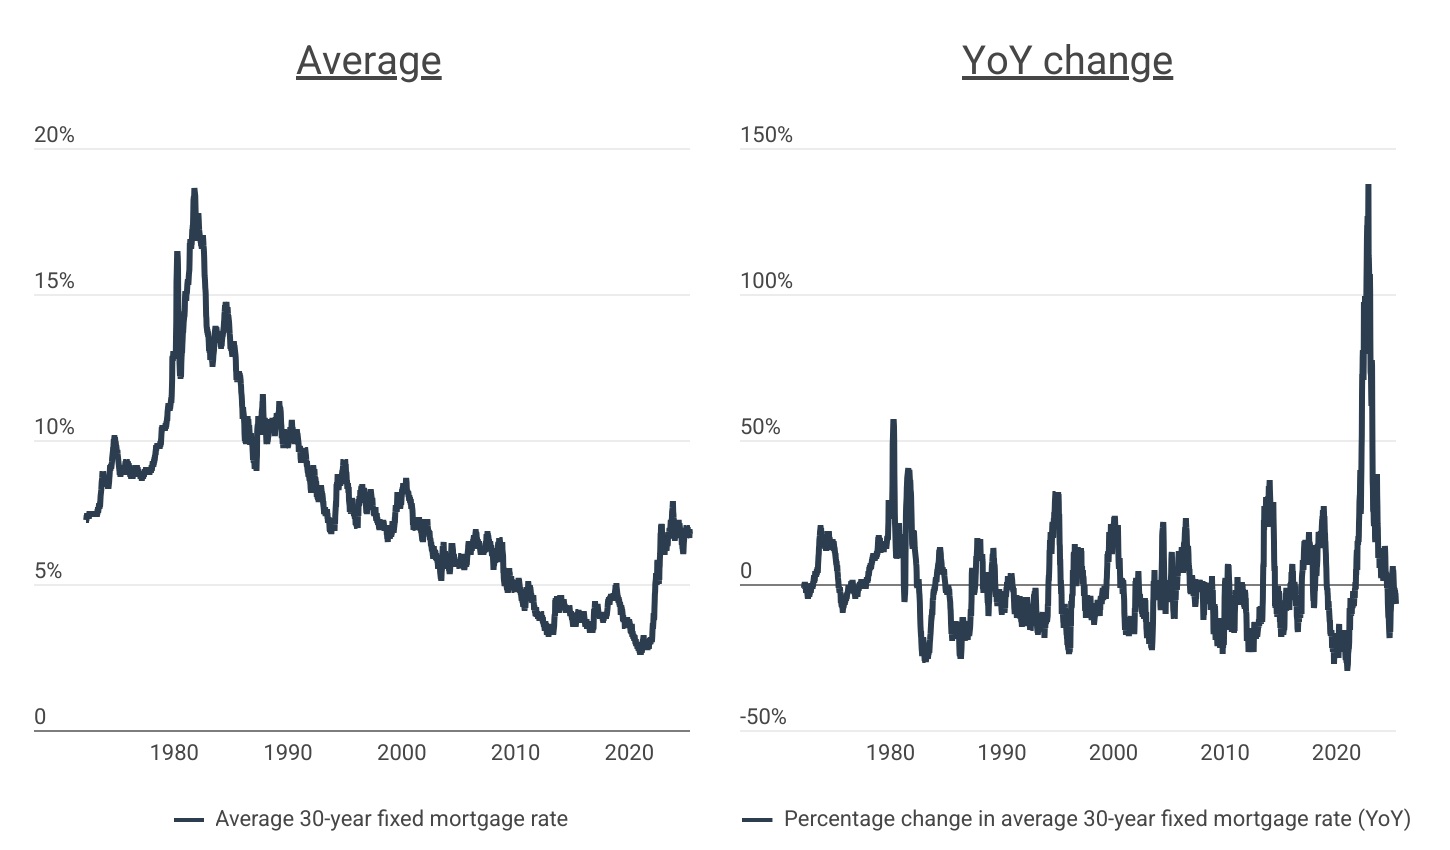
After climbing to a staggering 18.63% in the early 1980s, the average 30-year fixed mortgage interest rate steadily declined for nearly four decades. This long-term downward trend resulted in a historic low of 2.65% in early 2021, driven by both a long period of falling inflation and pandemic-era monetary stimulus.
That period of low inflation came to an abrupt end in the wake of the COVID-19 pandemic. Supply chain disruptions, labor shortages, and expansive fiscal policy contributed to the sharpest price increases in decades. In response, the Federal Reserve launched a series of aggressive interest rate hikes aimed at curbing price growth. Mortgage rates rose rapidly—reaching 7.79% by October 2023—before settling into a range between 6.6% and 7.0% in early 2025.
While current rates remain well below the highs of the 1980s, the speed of the increase has been unprecedented. In November 2022, the year-over-year increase in mortgage rates peaked at 138%—far outpacing the roughly 50% increase seen during the early 1980s. The result has been a dramatic reduction in housing affordability: the estimated monthly mortgage payment for a median-priced U.S. home is now nearly 60% higher than it was just three years ago, primarily due to increased borrowing costs.
Mortgage Rates by Location
Homebuyers in Alaska and North Dakota landed the best mortgage rates in 2024
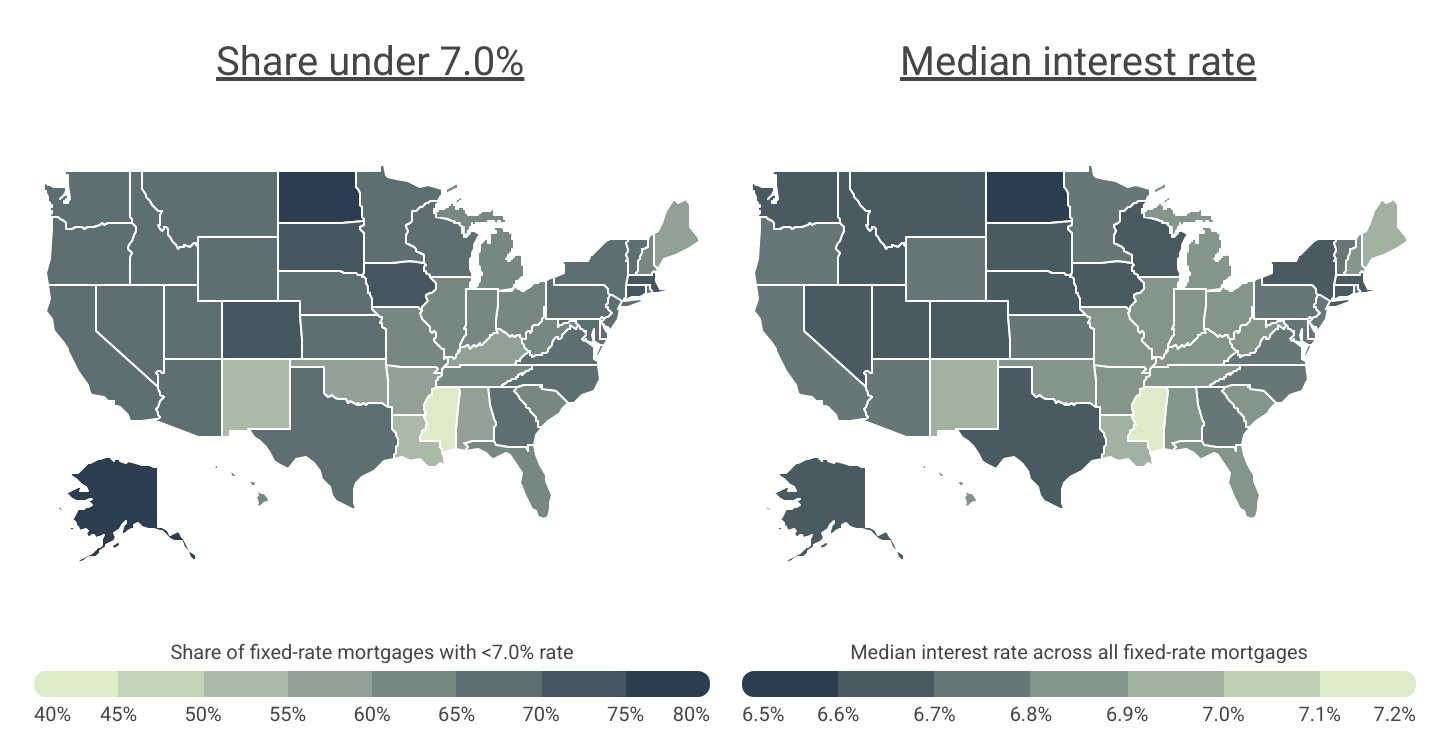
Interest rates vary geographically due to local market conditions, the financial health of residents, and laws governing lenders. Across the U.S., 65.1% of all approved home purchase loans had interest rates below 7% in 2024. Yet, the likelihood of securing a more favorable rate differed significantly by location.
At the state level, buyers in Alaska and North Dakota were most successful in locking in lower rates. In Alaska, 77.3% of fixed-rate mortgages approved in 2024 had rates under 7%, while in North Dakota, the figure was 75.6%. In contrast, Southern states tended to fare worse. Mississippi, for example, had the lowest share of sub-7% mortgages in the country, with just 43.1% of approved loans falling below that threshold.
Local-level data mirrors these broader regional patterns. Several Southern metropolitan areas recorded some of the least favorable borrowing conditions in the nation. In Eagle Pass, TX, only 28.9% of buyers obtained rates below 7%—the lowest share of any metro area. Meanwhile, markets such as Madison, WI and Anchorage, AK stood out for their high share of sub-7% loans, with nearly 80% of borrowers in those cities securing lower rates.
Below is a breakdown of the home mortgage rate landscape for over 380 metropolitan areas and all 50 states. Researchers at Construction Coverage analyzed the latest data from the 2024 Home Mortgage Disclosure Act. For more detailed information on data sources and calculations, see the methodology section.
Cities With the Best Mortgage Rates
| Top Large Metros | Share* |
|---|---|
| 1. Washington-Arlington-Alexandria, DC-VA-MD-WV | 75.2% |
| 2. Boston-Cambridge-Newton, MA-NH | 74.8% |
| 3. Austin-Round Rock-San Marcos, TX | 74.7% |
| 4. Raleigh-Cary, NC | 74.7% |
| 5. Hartford-West Hartford-East Hartford, CT | 74.1% |
| 6. Denver-Aurora-Centennial, CO | 73.2% |
| 7. Pittsburgh, PA | 72.5% |
| 8. Fresno, CA | 71.5% |
| 9. Sacramento-Roseville-Folsom, CA | 71.4% |
| 10. New York-Newark-Jersey City, NY-NJ | 71.2% |
| 11. Nashville-Davidson–Murfreesboro–Franklin, TN | 71.2% |
| 12. Charlotte-Concord-Gastonia, NC-SC | 70.7% |
| 13. Buffalo-Cheektowaga, NY | 70.7% |
| 14. San Francisco-Oakland-Fremont, CA | 70.5% |
| 15. Dallas-Fort Worth-Arlington, TX | 70.4% |
| Bottom Large Metros | Share* |
|---|---|
| 1. Miami-Fort Lauderdale-West Palm Beach, FL | 57.9% |
| 2. Oklahoma City, OK | 59.5% |
| 3. St. Louis, MO-IL | 60.0% |
| 4. Los Angeles-Long Beach-Anaheim, CA | 60.7% |
| 5. Birmingham, AL | 60.8% |
| 6. Rochester, NY | 61.2% |
| 7. Virginia Beach-Chesapeake-Norfolk, VA-NC | 61.2% |
| 8. Tulsa, OK | 61.4% |
| 9. Detroit-Warren-Dearborn, MI | 63.1% |
| 10. Louisville/Jefferson County, KY-IN | 63.3% |
| 11. Orlando-Kissimmee-Sanford, FL | 63.6% |
| 12. Riverside-San Bernardino-Ontario, CA | 63.8% |
| 13. Chicago-Naperville-Elgin, IL-IN | 64.2% |
| 14. Cleveland, OH | 64.6% |
| 15. San Diego-Chula Vista-Carlsbad, CA | 64.6% |
FOR CONSTRUCTION PROFESSIONALS
Did you know that personal auto insurance often won’t cover you when using your vehicle for work? If you use your personal car for work, it’s important to have a commercial policy. Our guide on the best commercial vehicle insurance explains everything you need to know.
| Top Midsize Metros | Share* |
|---|---|
| 1. Anchorage, AK | 79.5% |
| 2. Madison, WI | 78.8% |
| 3. Des Moines-West Des Moines, IA | 76.8% |
| 4. Davenport-Moline-Rock Island, IA-IL | 75.7% |
| 5. Huntsville, AL | 74.7% |
| 6. Albany-Schenectady-Troy, NY | 74.5% |
| 7. Durham-Chapel Hill, NC | 74.1% |
| 8. Springfield, MA | 74.0% |
| 9. Provo-Orem-Lehi, UT | 73.3% |
| 10. Fayetteville-Springdale-Rogers, AR | 72.2% |
| 11. Colorado Springs, CO | 72.0% |
| 12. Fort Collins-Loveland, CO | 71.9% |
| 13. Vallejo, CA | 71.8% |
| 14. Stockton-Lodi, CA | 71.6% |
| 15. Waterbury-Shelton, CT | 71.5% |
| Bottom Midsize Metros | Share* |
|---|---|
| 1. Jackson, MS | 47.5% |
| 2. Huntington-Ashland, WV-KY-OH | 49.1% |
| 3. Beaumont-Port Arthur, TX | 50.0% |
| 4. Gulfport-Biloxi, MS | 51.2% |
| 5. Albuquerque, NM | 54.8% |
| 6. Naples-Marco Island, FL | 55.2% |
| 7. Montgomery, AL | 55.2% |
| 8. Shreveport-Bossier City, LA | 55.3% |
| 9. Myrtle Beach-Conway-North Myrtle Beach, SC | 55.7% |
| 10. Atlantic City-Hammonton, NJ | 56.0% |
| 11. Fayetteville, NC | 56.4% |
| 12. Corpus Christi, TX | 57.1% |
| 13. Killeen-Temple, TX | 57.6% |
| 14. Lakeland-Winter Haven, FL | 57.7% |
| 15. Mobile, AL | 57.8% |
| Top Small Metros | Share* |
|---|---|
| 1. Dubuque, IA | 80.0% |
| 2. Fargo, ND-MN | 79.4% |
| 3. Great Falls, MT | 77.8% |
| 4. Grand Forks, ND-MN | 77.3% |
| 5. Appleton, WI | 77.0% |
| 6. Altoona, PA | 76.8% |
| 7. Sioux Falls, SD-MN | 76.6% |
| 8. Oshkosh-Neenah, WI | 76.2% |
| 9. Cedar Rapids, IA | 76.1% |
| 10. Johnstown, PA | 75.8% |
| 11. Amherst Town-Northampton, MA | 75.5% |
| 12. Kennewick-Richland, WA | 75.2% |
| 13. Minot, ND | 75.2% |
| 14. Iowa City, IA | 74.9% |
| 15. Burlington-South Burlington, VT | 74.8% |
| Bottom Small Metros | Share* |
|---|---|
| 1. Eagle Pass, TX | 28.9% |
| 2. Odessa, TX | 36.5% |
| 3. Hammond, LA | 39.2% |
| 4. Texarkana, TX-AR | 39.4% |
| 5. Farmington, NM | 42.0% |
| 6. Longview, TX | 42.8% |
| 7. Alexandria, LA | 42.9% |
| 8. Monroe, LA | 43.1% |
| 9. Lawton, OK | 45.3% |
| 10. Lake Charles, LA | 46.8% |
| 11. Victoria, TX | 47.0% |
| 12. Houma-Bayou Cane-Thibodaux, LA | 47.0% |
| 13. Vineland, NJ | 47.3% |
| 14. Abilene, TX | 47.3% |
| 15. Michigan City-La Porte, IN | 48.0% |
RELATED
States With the Best Mortgage Rates
| Top States | Share* |
|---|---|
| 1. Alaska | 77.3% |
| 2. North Dakota | 75.6% |
| 3. Iowa | 74.3% |
| 4. Massachusetts | 73.3% |
| 5. South Dakota | 71.1% |
| 6. Colorado | 71.0% |
| 7. Connecticut | 71.0% |
| 8. Nebraska | 69.7% |
| 9. Maryland | 69.5% |
| 10. New York | 69.2% |
| 11. Pennsylvania | 69.1% |
| 12. Wisconsin | 68.9% |
| 13. Washington | 68.7% |
| 14. Montana | 68.4% |
| 15. Idaho | 68.2% |
| Bottom States | Share* |
|---|---|
| 1. Mississippi | 43.1% |
| 2. New Mexico | 51.0% |
| 3. Louisiana | 53.5% |
| 4. Oklahoma | 55.5% |
| 5. Alabama | 57.8% |
| 6. Maine | 57.9% |
| 7. Arkansas | 58.4% |
| 8. Kentucky | 59.8% |
| 9. West Virginia | 60.4% |
| 10. Florida | 60.9% |
| 11. Indiana | 61.4% |
| 12. Missouri | 61.6% |
| 13. New Hampshire | 62.3% |
| 14. South Carolina | 62.8% |
| 15. Michigan | 62.9% |
*Share of fixed-rate mortgages with <7.0% rate
Full Results
Methodology
To determine the locations where homebuyers get the best mortgage interest rates, researchers at Construction Coverage analyzed the latest data from the Federal Financial Institutions Examination Council’s 2024 Home Mortgage Disclosure Act. The researchers ranked metros according to the share of all fixed-rate mortgages with less than a 7% interest rate. Only conventional home purchase loans approved in 2024 were included in the analysis. In the event of a tie, the metro with the greater share of 30-year mortgages with less than a 7% interest rate was ranked higher. Researchers also calculated the share of 15-year mortgages with less than a 7% rate, and the median interest rate across all fixed-rate mortgages, the change in median interest rate across all fixed-rate mortgages (2023–2024), and the median home sale prices for homes financed with 30-year and 15-year mortgages.
To improve relevance, only records with complete data were included in the analysis, and metro areas were grouped into the following cohorts based on population size:
- Small metros: less than 350,000
- Midsize metros: 350,000–999,999
- Large metros: 1,000,000 or more
Additionally, due to data limitations, calculations for metropolitan areas in Connecticut were approximated using county boundaries instead of county equivalent planning regions.
References
- Board of Governors of the Federal Reserve System. (2025, March 19). Federal Reserve issues FOMC statement. Retrieved on May 9, 2025 from https://www.federalreserve.gov/newsevents/pressreleases/monetary20250319a.htm.
- Zillow. (2025). Housing Data, Zillow Home Value Index (ZHVI) [Data set]. Retrieved on May 9, 2025 from https://www.zillow.com/home-values/102001/united-states/.
- Board of Governors of the Federal Reserve System. (2025, May 1). Federal Funds Effective Rate. Retrieved on May 9, 2025 from https://fred.stlouisfed.org/series/FEDFUNDS.
- Federal Financial Institutions Examination Council (FFIEC). (2024). The Home Mortgage Disclosure Act (HMDA) [Data set]. Retrieved on May 9, 2025 from https://ffiec.cfpb.gov/.