
Cities Where It’s Cheaper to Buy Than Rent
Is it cheaper to buy or rent in 2026? In most U.S. markets, buying now costs about 20% more than renting—but a small group of cities, primarily in the South and Midwest, still favor homebuyers.
Note: This is the most recent release of our Cities Where It’s Cheaper to Buy Than Rent study. To see data from prior years, please visit the Full Results section below.
Price increases throughout the U.S. economy over the past few years have made nearly everything more expensive, but perhaps no spending category has squeezed Americans’ budgets like the cost of housing. Between high costs to buy a home and skyrocketing rents, non-homeowners are faced with impossible choices throughout the market.
Throughout 2020 and 2021, low interest rates and rising household savings and incomes positioned many Americans to buy real estate. But high competition and low supply created a boom in the residential real estate market that sent home prices in the U.S. to record highs. With home prices persistently high and interest rates remaining elevated to tamp down inflation, more would-be buyers have been priced out, increasing the competitiveness of the rental market and in turn driving rents upward.
These shifting conditions have made things difficult for households debating whether to buy or rent. Shelter is already the largest spending category for most U.S. households, but larger economic trends have raised the financial stakes on the buy-or-rent decision.
Key Takeaways
- The affordability gap flipped fast: Since the start of 2021, mortgage rates have more than doubled and home prices remain approximately 33% higher, driving a surge in the “buying premium” across most U.S. markets.
- Buying remains more expensive than renting: As of early 2026, the national median monthly mortgage payment is 20% higher than the median rent, a dramatic reversal from the 2010s when buying was often cheaper.
- Only a small fraction of cities favor buyers: Just 95 out of the 838 U.S. cities analyzed still offer a cost advantage to buying—mostly in lower-cost Southern and Rust Belt markets.
- Location drives extreme differences: In over 100 cities, the median monthly mortgage payment is now more than double the median rent. But places like Detroit and Cleveland offer 40% to 60% savings for buyers compared to renters.
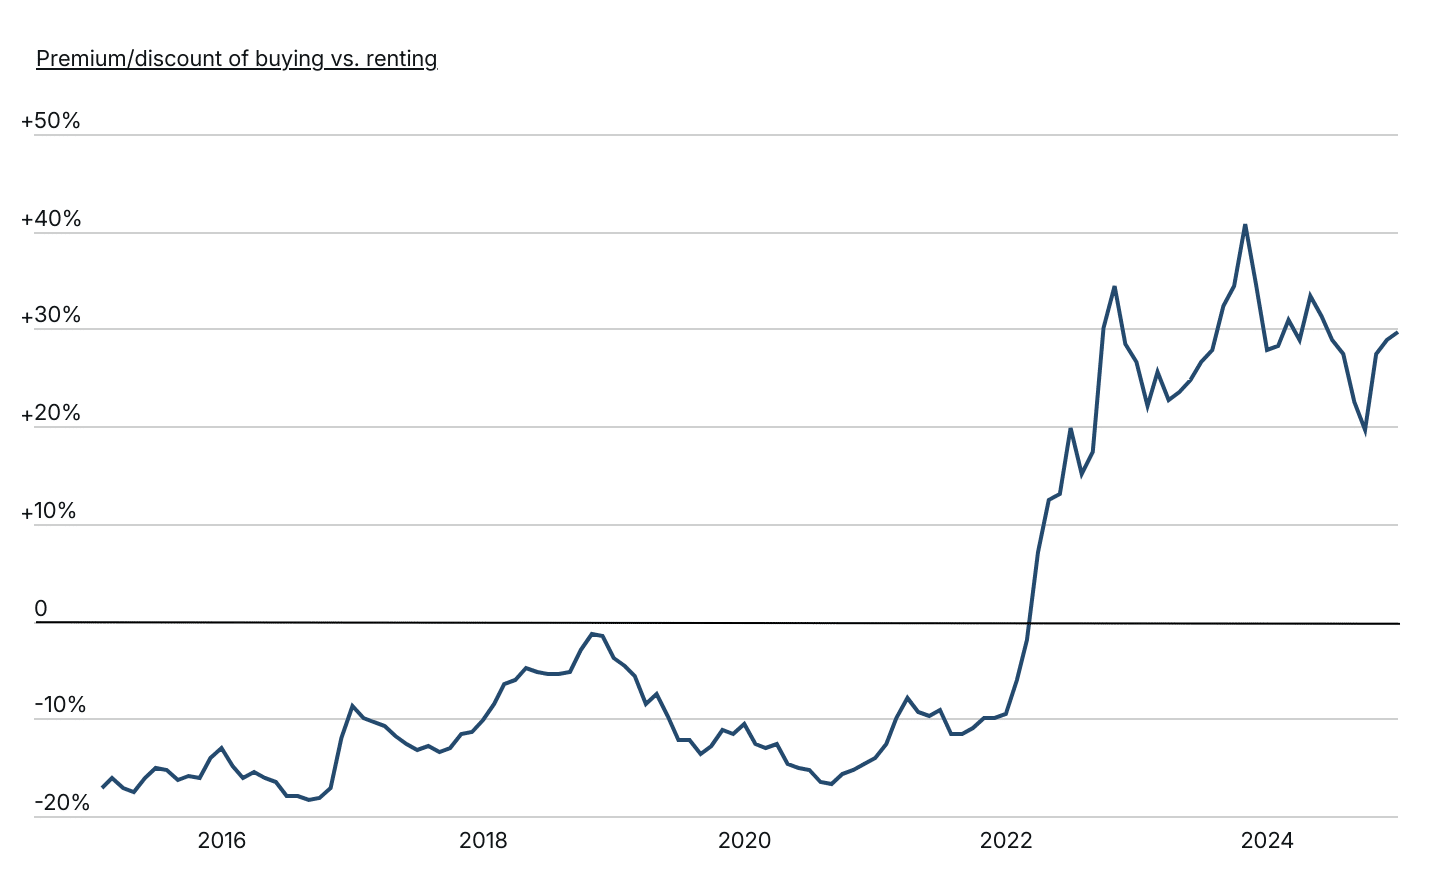
The Cost of Buying Versus Renting Over Time
Amid high interest rates and home prices, the buying premium has skyrocketed
Data: The Cost of Buying vs. Renting Over Time
| Date | Premium/discount of buying vs. renting |
|---|---|
| 1/31/2015 | -17.1% |
| 2/28/2015 | -16.1% |
| 3/31/2015 | -17.2% |
| 4/30/2015 | -17.6% |
| 5/31/2015 | -16.2% |
| 6/30/2015 | -15.0% |
| 7/31/2015 | -15.3% |
| 8/31/2015 | -16.3% |
| 9/30/2015 | -15.8% |
| 10/31/2015 | -16.1% |
| 11/30/2015 | -14.1% |
| 12/31/2015 | -13.1% |
| 1/31/2016 | -14.9% |
| 2/29/2016 | -16.2% |
| 3/31/2016 | -15.5% |
| 4/30/2016 | -16.1% |
| 5/31/2016 | -16.5% |
| 6/30/2016 | -18.0% |
| 7/31/2016 | -18.0% |
| 8/31/2016 | -18.3% |
| 9/30/2016 | -18.1% |
| 10/31/2016 | -17.2% |
| 11/30/2016 | -11.9% |
| 12/31/2016 | -8.8% |
| 1/31/2017 | -9.9% |
| 2/28/2017 | -10.3% |
| 3/31/2017 | -10.7% |
| 4/30/2017 | -11.8% |
| 5/31/2017 | -12.7% |
| 6/30/2017 | -13.3% |
| 7/31/2017 | -12.9% |
| 8/31/2017 | -13.5% |
| 9/30/2017 | -13.0% |
| 10/31/2017 | -11.5% |
| 11/30/2017 | -11.4% |
| 12/31/2017 | -10.1% |
| 1/31/2018 | -8.6% |
| 2/28/2018 | -6.4% |
| 3/31/2018 | -6.1% |
| 4/30/2018 | -4.9% |
| 5/31/2018 | -5.2% |
| 6/30/2018 | -5.4% |
| 7/31/2018 | -5.4% |
| 8/31/2018 | -5.3% |
| 9/30/2018 | -3.0% |
| 10/31/2018 | -1.3% |
| 11/30/2018 | -1.5% |
| 12/31/2018 | -3.7% |
| 1/31/2019 | -4.6% |
| 2/28/2019 | -5.6% |
| 3/31/2019 | -8.5% |
| 4/30/2019 | -7.5% |
| 5/31/2019 | -9.7% |
| 6/30/2019 | -12.2% |
| 7/31/2019 | -12.2% |
| 8/31/2019 | -13.6% |
| 9/30/2019 | -12.8% |
| 10/31/2019 | -11.1% |
| 11/30/2019 | -11.5% |
| 12/31/2019 | -10.6% |
| 1/31/2020 | -12.6% |
| 2/29/2020 | -13.1% |
| 3/31/2020 | -12.6% |
| 4/30/2020 | -14.6% |
| 5/31/2020 | -15.1% |
| 6/30/2020 | -15.2% |
| 7/31/2020 | -16.5% |
| 8/31/2020 | -16.7% |
| 9/30/2020 | -15.7% |
| 10/31/2020 | -15.2% |
| 11/30/2020 | -14.7% |
| 12/31/2020 | -14.0% |
| 1/31/2021 | -12.7% |
| 2/28/2021 | -10.0% |
| 3/31/2021 | -7.9% |
| 4/30/2021 | -9.4% |
| 5/31/2021 | -9.7% |
| 6/30/2021 | -9.2% |
| 7/31/2021 | -11.6% |
| 8/31/2021 | -11.5% |
| 9/30/2021 | -10.9% |
| 10/31/2021 | -9.9% |
| 11/30/2021 | -10.0% |
| 12/31/2021 | -9.5% |
| 1/31/2022 | -6.0% |
| 2/28/2022 | -1.9% |
| 3/31/2022 | +7.1% |
| 4/30/2022 | +12.5% |
| 5/31/2022 | +13.1% |
| 6/30/2022 | +19.9% |
| 7/31/2022 | +15.2% |
| 8/31/2022 | +17.4% |
| 9/30/2022 | +30.0% |
| 10/31/2022 | +34.3% |
| 11/30/2022 | +28.5% |
| 12/31/2022 | +26.5% |
| 1/31/2023 | +22.1% |
| 2/28/2023 | +25.6% |
| 3/31/2023 | +22.6% |
| 4/30/2023 | +23.5% |
| 5/31/2023 | +24.8% |
| 6/30/2023 | +26.6% |
| 7/31/2023 | +27.8% |
| 8/31/2023 | +32.4% |
| 9/30/2023 | +34.4% |
| 10/31/2023 | +40.8% |
| 11/30/2023 | +34.6% |
| 12/31/2023 | +27.8% |
| 1/31/2024 | +28.2% |
| 2/29/2024 | +30.9% |
| 3/31/2024 | +28.9% |
| 4/30/2024 | +33.3% |
| 5/31/2024 | +31.4% |
| 6/30/2024 | +28.9% |
| 7/31/2024 | +27.5% |
| 8/31/2024 | +22.5% |
| 9/30/2024 | +19.7% |
| 10/31/2024 | +27.4% |
| 11/30/2024 | +28.8% |
| 12/31/2024 | +29.7% |
For years, the typical monthly cost of homeownership—after accounting for sale prices, mortgage rates, and property taxes—remained well below the cost of renting in the U.S. The aftermath of the Great Recession, combined with an extended period of low interest rates, kept mortgage payments affordable throughout much of the 2010s. Even as home prices surged in the competitive housing market of 2020 and 2021, historically low borrowing costs continued to make buying a home more financially attractive than renting.
However, by 2022, the equation shifted. A combination of soaring home prices and rapidly rising interest rates made renting the more affordable option in most markets. Mortgage rates have more than doubled since reaching record lows in January 2021, and while home price growth has slowed, the median home price remains approximately 33% higher over the same period. As of February 2026, the typical monthly mortgage payment (including property taxes) for a home in the U.S. is now 20% higher than the typical monthly rent.
The Cost of Buying Versus Renting by City
Residents in California & Washington will pay the largest premium to buy
Data: The Cost of Renting vs. Buying by U.S. City
| City | Premium/discount of buying vs. renting |
|---|---|
| Detroit, MI | -62.4% |
| Gary, IN | -59.0% |
| Jackson, MS | -58.4% |
| Youngstown, OH | -57.3% |
| Flint, MI | -56.3% |
| Cleveland, OH | -42.6% |
| Camden, NJ | -39.1% |
| Birmingham, AL | -38.9% |
| Montgomery, AL | -34.9% |
| Pontiac, MI | -34.4% |
| Decatur, IL | -32.8% |
| Shreveport, LA | -29.3% |
| Deerfield Beach, FL | -29.3% |
| Lauderhill, FL | -27.8% |
| Baltimore, MD | -26.8% |
| Enid, OK | -25.6% |
| Memphis, TN | -25.3% |
| Port Arthur, TX | -24.5% |
| Hammond, IN | -24.1% |
| Dayton, OH | -23.2% |
| Coconut Creek, FL | -23.2% |
| Delray Beach, FL | -23.2% |
| Anderson, IN | -23.0% |
| Abilene, TX | -21.9% |
| Lawton, OK | -21.2% |
| Dundalk, MD | -19.3% |
| Toledo, OH | -19.1% |
| Brownsville, TX | -18.9% |
| Akron, OH | -18.8% |
| Florissant, MO | -18.5% |
| Augusta-Richmond County, GA | -18.3% |
| Midwest City, OK | -17.7% |
| Gulfport, MS | -17.6% |
| Philadelphia, PA | -17.5% |
| Taylor, MI | -16.9% |
| Peoria, IL | -16.5% |
| Pine Hills, FL | -16.2% |
| Warner Robins, GA | -14.2% |
| Tamarac, FL | -14.1% |
| St. Louis, MO | -13.4% |
| Columbus, GA | -12.9% |
| Saint Clair Shores, MI | -12.5% |
| Macon-Bibb County, GA | -12.1% |
| Lansing, MI | -12.1% |
| South Bend, IN | -11.9% |
| Albany, GA | -10.9% |
| Lorain, OH | -10.8% |
| Mishawaka, IN | -10.8% |
| Hartford, CT | -10.8% |
| Rocky Mount, NC | -10.7% |
| Beaumont, TX | -10.5% |
| Texas City, TX | -10.5% |
| Mobile, AL | -10.4% |
| Tuscaloosa, AL | -10.4% |
| Syracuse, NY | -9.8% |
| Moore, OK | -9.7% |
| Sunrise, FL | -8.9% |
| Cuyahoga Falls, OH | -8.5% |
| Poinciana, FL | -8.2% |
| Chicago, IL | -8.2% |
| New Orleans, LA | -8.0% |
| Port Charlotte, FL | -7.4% |
| Dearborn Heights, MI | -7.0% |
| Wichita Falls, TX | -6.8% |
| Margate, FL | -6.6% |
| Columbia, SC | -6.4% |
| Deltona, FL | -6.4% |
| Dearborn, MI | -6.2% |
| Lehigh Acres, FL | -5.8% |
| North Little Rock, AR | -5.6% |
| Pinellas Park, FL | -5.4% |
| Bossier City, LA | -5.3% |
| Muncie, IN | -4.9% |
| Valdosta, GA | -4.4% |
| Pompano Beach, FL | -4.4% |
| Waco, TX | -3.7% |
| Jonesboro, AR | -3.5% |
| Winter Haven, FL | -3.5% |
| Terre Haute, IN | -3.0% |
| Pittsburgh, PA | -3.0% |
| Dothan, AL | -2.5% |
| Pensacola, FL | -2.4% |
| Joplin, MO | -1.9% |
| Palm Bay, FL | -1.9% |
| North Port, FL | -1.9% |
| Pharr, TX | -1.8% |
| Spring Hill, FL | -1.6% |
| Kansas City, KS | -1.4% |
| Daytona Beach, FL | -1.4% |
| Warren, MI | -1.3% |
| Southaven, MS | -1.1% |
| Jackson, TN | -1.0% |
| The Villages, FL | -0.9% |
| Fayetteville, NC | -0.8% |
| Independence, MO | -0.5% |
| Kenner, LA | +0.5% |
| Owensboro, KY | +0.7% |
| Parma, OH | +1.2% |
| Lubbock, TX | +1.5% |
| Oklahoma City, OK | +2.0% |
| Duluth, MN | +2.4% |
| Springfield, IL | +2.5% |
| Baton Rouge, LA | +2.9% |
| Aurora, IL | +3.0% |
| Odessa, TX | +3.1% |
| Corpus Christi, TX | +3.3% |
| Port St. Lucie, FL | +3.3% |
| Lafayette, LA | +3.7% |
| Ocala, FL | +3.7% |
| St. Petersburg, FL | +3.7% |
| Portsmouth, VA | +4.1% |
| Boynton Beach, FL | +4.1% |
| Indianapolis, IN | +4.5% |
| Bartlett, TN | +4.7% |
| Toms River, NJ | +5.0% |
| Utica, NY | +5.1% |
| Miami Gardens, FL | +5.2% |
| High Point, NC | +5.9% |
| Royal Oak, MI | +6.0% |
| Battle Creek, MI | +6.1% |
| Canton, OH | +6.3% |
| Greenville, NC | +6.7% |
| Lake Charles, LA | +6.8% |
| Topeka, KS | +6.8% |
| Scranton, PA | +7.0% |
| San Jacinto, CA | +7.1% |
| Springfield, OH | +7.2% |
| Westland, MI | +7.5% |
| Buffalo, NY | +7.5% |
| Kannapolis, NC | +7.5% |
| Kokomo, IN | +7.7% |
| Riverview, FL | +7.8% |
| Pasadena, TX | +7.9% |
| Broken Arrow, OK | +7.9% |
| Kenosha, WI | +8.0% |
| Cathedral City, CA | +8.1% |
| Baytown, TX | +8.3% |
| Mission, TX | +8.7% |
| Hampton, VA | +8.7% |
| St. Cloud, FL | +8.8% |
| West Palm Beach, FL | +9.0% |
| Clearwater, FL | +9.1% |
| Milwaukee, WI | +9.4% |
| Palm Coast, FL | +9.6% |
| Largo, FL | +9.7% |
| Kissimmee, FL | +10.0% |
| Hialeah, FL | +10.0% |
| Waukegan, IL | +10.1% |
| Amarillo, TX | +10.4% |
| Jacksonville, FL | +10.4% |
| Cape Coral, FL | +10.4% |
| North Charleston, SC | +10.9% |
| Warwick, RI | +11.0% |
| Killeen, TX | +11.1% |
| New Haven, CT | +11.1% |
| Chicopee, MA | +11.5% |
| Commerce City, CO | +11.5% |
| Kansas City, MO | +11.7% |
| Mableton, GA | +11.7% |
| Des Plaines, IL | +12.0% |
| Norfolk, VA | +12.1% |
| Waterloo, IA | +12.3% |
| Tulsa, OK | +12.3% |
| Southfield, MI | +12.3% |
| Springfield, MA | +12.3% |
| Palmdale, CA | +12.3% |
| North Miami, FL | +12.5% |
| Madera, CA | +12.5% |
| Winston-Salem, NC | +12.7% |
| Laredo, TX | +12.8% |
| Wilmington, DE | +12.9% |
| Lakeland, FL | +13.0% |
| Conway, AR | +13.1% |
| Jeffersonville, IN | +13.1% |
| El Paso, TX | +13.1% |
| Rockford, IL | +13.3% |
| Kingsport, TN | +13.4% |
| Newport News, VA | +13.4% |
| Grand Rapids, MI | +13.4% |
| Little Rock, AR | +13.8% |
| Houston, TX | +13.8% |
| Fort Myers, FL | +13.8% |
| Livonia, MI | +13.8% |
| Missouri City, TX | +13.8% |
| Elyria, OH | +14.1% |
| Wichita, KS | +14.1% |
| Rochester, NY | +14.2% |
| Fort Smith, AR | +14.3% |
| Columbus, OH | +14.3% |
| Sanford, FL | +14.4% |
| Florin, CA | +14.6% |
| San Angelo, TX | +15.0% |
| Gainesville, FL | +15.0% |
| Rio Rancho, NM | +15.0% |
| Savannah, GA | +15.2% |
| Wesley Chapel, FL | +15.2% |
| Burlington, NC | +15.3% |
| New Brunswick, NJ | +15.3% |
| Harlingen, TX | +15.5% |
| Sioux City, IA | +15.5% |
| Cincinnati, OH | +15.5% |
| Schaumburg, IL | +15.5% |
| Homestead, FL | +15.5% |
| Perris, CA | +16.0% |
| Gastonia, NC | +16.3% |
| Tampa, FL | +16.4% |
| Metairie, LA | +16.7% |
| Bolingbrook, IL | +16.7% |
| Atascocita, TX | +16.8% |
| Fort Lauderdale, FL | +16.8% |
| Miami Beach, FL | +16.8% |
| Decatur, AL | +17.2% |
| Melbourne, FL | +17.2% |
| Buckeye, AZ | +17.7% |
| San Tan Valley, AZ | +17.8% |
| Sarasota, FL | +17.8% |
| Maricopa, AZ | +17.9% |
| Trenton, NJ | +18.0% |
| Waldorf, MD | +18.0% |
| Apopka, FL | +18.3% |
| Bonita Springs, FL | +18.3% |
| Greensboro, NC | +18.6% |
| Champaign, IL | +18.7% |
| Joliet, IL | +18.7% |
| Oak Lawn, IL | +18.7% |
| Pembroke Pines, FL | +18.7% |
| Wyoming, MI | +18.9% |
| Apple Valley, MN | +19.0% |
| Jacksonville, NC | +19.1% |
| Bradenton, FL | +19.1% |
| Beaumont, CA | +19.2% |
| Louisville/Jefferson County, KY | +19.4% |
| Doral, FL | +19.4% |
| Temple, TX | +19.5% |
| Boca Raton, FL | +19.6% |
| Evansville, IN | +19.8% |
| Tallahassee, FL | +20.1% |
| Tulare, CA | +20.1% |
| Victoria, TX | +20.4% |
| Brandon, FL | +20.5% |
| Cedar Rapids, IA | +20.8% |
| Athens-Clarke County, GA | +20.8% |
| St. Joseph, MO | +21.1% |
| Elkhart, IN | +21.3% |
| Springfield, MO | +21.3% |
| DeSoto, TX | +21.3% |
| Hempstead, NY | +21.3% |
| Blaine, MN | +21.7% |
| Miami, FL | +21.7% |
| McAllen, TX | +21.9% |
| Tinley Park, IL | +21.9% |
| Lynchburg, VA | +22.0% |
| Hesperia, CA | +22.1% |
| Council Bluffs, IA | +22.4% |
| Port Orange, FL | +22.8% |
| Hollywood, FL | +22.8% |
| Greenville, SC | +22.9% |
| Antioch, CA | +22.9% |
| Victorville, CA | +23.1% |
| Harrisonburg, VA | +23.2% |
| Casa Grande, AZ | +23.3% |
| Lancaster, CA | +23.4% |
| Des Moines, IA | +23.5% |
| Garland, TX | +23.6% |
| Saint Peters, MO | +23.6% |
| Providence, RI | +23.6% |
| Bridgeport, CT | +23.7% |
| Columbus, IN | +24.2% |
| Reading, PA | +24.2% |
| Mesquite, TX | +24.4% |
| Racine, WI | +24.6% |
| San Antonio, TX | +24.7% |
| Kalamazoo, MI | +24.8% |
| Allentown, PA | +24.8% |
| Plantation, FL | +24.8% |
| Orlando, FL | +24.9% |
| Marana, AZ | +25.0% |
| Suffolk, VA | +25.1% |
| Rock Hill, SC | +25.3% |
| Kentwood, MI | +25.3% |
| Summerville, SC | +25.6% |
| Newark, OH | +25.7% |
| Norman, OK | +25.7% |
| Tyler, TX | +25.8% |
| Bryan, TX | +25.9% |
| Indio, CA | +25.9% |
| Huntsville, AL | +26.0% |
| Blue Springs, MO | +26.0% |
| Miramar, FL | +26.2% |
| Burleson, TX | +26.7% |
| Roanoke, VA | +26.9% |
| Levittown, PA | +26.9% |
| Fontana, CA | +27.3% |
| Florence-Graham, CA | +27.5% |
| Middletown, OH | +27.6% |
| Chesapeake, VA | +27.6% |
| West Haven, CT | +27.6% |
| Greenwood, IN | +27.7% |
| Fort Wayne, IN | +27.8% |
| Maple Grove, MN | +27.8% |
| St. Paul, MN | +27.9% |
| Bethlehem, PA | +27.9% |
| Longview, TX | +28.2% |
| Johnson City, TN | +28.2% |
| O’Fallon, MO | +28.2% |
| Danbury, CT | +28.2% |
| Pueblo, CO | +28.5% |
| Brooklyn Park, MN | +28.6% |
| Atlanta, GA | +28.6% |
| Springdale, AR | +28.8% |
| Surprise, AZ | +29.0% |
| Coon Rapids, MN | +29.1% |
| Knoxville, TN | +29.1% |
| West New York, NJ | +29.1% |
| Chattanooga, TN | +29.2% |
| Lawrence, MA | +29.2% |
| Dallas, TX | +29.3% |
| Bloomington, IN | +29.7% |
| Worcester, MA | +29.7% |
| Palm Harbor, FL | +29.9% |
| Stockton, CA | +30.1% |
| Minneapolis, MN | +30.3% |
| Weston, FL | +30.4% |
| Little Elm, TX | +30.5% |
| Kyle, TX | +30.6% |
| Fort Worth, TX | +30.7% |
| Grand Island, NE | +30.8% |
| Fayetteville, AR | +30.8% |
| Germantown, MD | +30.9% |
| Bakersfield, CA | +31.0% |
| Modesto, CA | +31.1% |
| Palm Desert, CA | +31.4% |
| Merced, CA | +31.5% |
| Lafayette, IN | +31.6% |
| Orland Park, IL | +31.7% |
| Lowell, MA | +31.7% |
| Rochester, MN | +31.8% |
| Rialto, CA | +31.9% |
| North Las Vegas, NV | +32.2% |
| Virginia Beach, VA | +32.3% |
| Harrisburg, PA | +32.5% |
| Yuma, AZ | +32.6% |
| Sterling Heights, MI | +32.6% |
| Apple Valley, CA | +32.6% |
| Hamilton, OH | +32.7% |
| Boston, MA | +33.2% |
| College Station, TX | +33.4% |
| Visalia, CA | +33.6% |
| Skokie, IL | +33.7% |
| New York, NY | +33.7% |
| Davenport, IA | +33.9% |
| Edmond, OK | +34.0% |
| Lincoln, CA | +34.0% |
| Grand Prairie, TX | +34.2% |
| Las Cruces, NM | +34.5% |
| Midland, TX | +34.7% |
| Milford, CT | +34.9% |
| Lexington-Fayette, KY | +35.0% |
| St. Cloud, MN | +35.3% |
| Erie, PA | +35.6% |
| Elgin, IL | +35.7% |
| West Allis, WI | +35.8% |
| Waterbury, CT | +35.9% |
| Meriden, CT | +36.0% |
| Wellington, FL | +36.1% |
| Twin Falls, ID | +36.2% |
| Concord, NC | +36.4% |
| Bowie, MD | +36.4% |
| Hanford, CA | +36.5% |
| Palatine, IL | +36.7% |
| Jupiter, FL | +37.3% |
| New Britain, CT | +37.4% |
| Bowling Green, KY | +37.5% |
| Grand Junction, CO | +37.7% |
| Evanston, IL | +37.7% |
| Perth Amboy, NJ | +38.1% |
| Menifee, CA | +38.1% |
| Revere, MA | +38.3% |
| Clovis, CA | +38.4% |
| Avondale, AZ | +38.5% |
| Woodbury, MN | +38.6% |
| Troy, NY | +38.8% |
| Clarksville, TN | +38.9% |
| The Hammocks, FL | +38.9% |
| Conroe, TX | +39.0% |
| Eagle Mountain, UT | +39.0% |
| Hoffman Estates, IL | +39.1% |
| Coral Springs, FL | +39.5% |
| Pasco, WA | +39.6% |
| Hemet, CA | +39.6% |
| Hoboken, NJ | +39.6% |
| Tucson, AZ | +39.7% |
| Cicero, IL | +39.8% |
| Davie, FL | +39.8% |
| Bloomington, IL | +40.2% |
| Highland, CA | +40.2% |
| Omaha, NE | +40.3% |
| Pawtucket, RI | +40.6% |
| Fresno, CA | +40.8% |
| Turlock, CA | +40.9% |
| Noblesville, IN | +41.0% |
| Columbia, MO | +41.2% |
| Kettering, OH | +41.3% |
| Charlotte, NC | +41.3% |
| League City, TX | +41.5% |
| New Bedford, MA | +41.5% |
| Downers Grove, IL | +41.7% |
| Ann Arbor, MI | +41.8% |
| Arlington, TX | +42.3% |
| Albany, NY | +42.3% |
| Bloomington, MN | +42.3% |
| Moreno Valley, CA | +42.3% |
| Brockton, MA | +42.4% |
| Pittsburg, CA | +42.7% |
| Auburn, AL | +43.0% |
| New Braunfels, TX | +43.2% |
| Everett, MA | +43.2% |
| Frederick, MD | +43.5% |
| Jersey City, NJ | +43.6% |
| Richmond, VA | +43.8% |
| Washington, DC | +43.8% |
| Glen Burnie, MD | +43.9% |
| Chino, CA | +43.9% |
| Dubuque, IA | +44.8% |
| Bellevue, NE | +45.0% |
| East Hartford, CT | +45.1% |
| Irving, TX | +45.2% |
| Sacramento, CA | +45.2% |
| Lakewood, OH | +45.4% |
| Yuba City, CA | +45.4% |
| Manteca, CA | +45.4% |
| Albuquerque, NM | +45.5% |
| Smyrna, TN | +45.5% |
| Palm Beach Gardens, FL | +45.5% |
| Nashville-Davidson, TN | +45.7% |
| Lehi, UT | +45.7% |
| Rowlett, TX | +45.9% |
| Redding, CA | +46.1% |
| Euless, TX | +46.4% |
| Gaithersburg, MD | +46.6% |
| Cranston, RI | +46.7% |
| Carson, CA | +46.7% |
| Manchester, NH | +46.9% |
| Lake Elsinore, CA | +46.9% |
| Mount Vernon, NY | +47.3% |
| Bristol, CT | +47.7% |
| Wheaton, IL | +47.9% |
| Durham, NC | +48.1% |
| Casper, WY | +48.4% |
| Severn, MD | +48.4% |
| Citrus Heights, CA | +48.5% |
| Wilmington, NC | +48.6% |
| Haverhill, MA | +48.7% |
| Eugene, OR | +48.8% |
| Lincoln, NE | +48.9% |
| Lawrence, KS | +49.1% |
| Madison, AL | +49.1% |
| Las Vegas, NV | +49.1% |
| Elk Grove, CA | +49.3% |
| Galveston, TX | +49.5% |
| Vacaville, CA | +49.6% |
| Spring, TX | +50.0% |
| Murfreesboro, TN | +50.0% |
| West Sacramento, CA | +50.1% |
| Caldwell, ID | +50.4% |
| Pearland, TX | +50.5% |
| Vallejo, CA | +50.9% |
| Cheyenne, WY | +51.7% |
| Oshkosh, WI | +51.8% |
| Edinburg, TX | +51.9% |
| Peabody, MA | +52.0% |
| Lee’s Summit, MO | +52.1% |
| Lakeville, MN | +52.2% |
| Medford, OR | +52.3% |
| Columbia, MD | +52.3% |
| Iowa City, IA | +52.4% |
| Fishers, IN | +52.5% |
| Colton, CA | +52.5% |
| Marysville, WA | +52.5% |
| Great Falls, MT | +52.8% |
| Lakewood, CA | +52.8% |
| San Marcos, TX | +53.1% |
| Richmond, CA | +53.1% |
| Taunton, MA | +53.2% |
| Eagan, MN | +53.3% |
| Towson, MD | +53.3% |
| San Bernardino, CA | +53.3% |
| Fairfield, CA | +53.3% |
| St. Charles, MO | +53.4% |
| Carson CITY, NV | +53.4% |
| Burnsville, MN | +53.6% |
| Fall River, MA | +53.8% |
| Wylie, TX | +54.1% |
| Rancho Cordova, CA | +54.1% |
| Glendale, AZ | +54.4% |
| Woodland, CA | +54.4% |
| Olathe, KS | +54.5% |
| Sugar Land, TX | +54.6% |
| Porterville, CA | +54.7% |
| Newark, NJ | +54.7% |
| Phoenix, AZ | +54.8% |
| Brentwood, CA | +54.8% |
| Rogers, AR | +55.4% |
| Grand Forks, ND | +55.6% |
| Janesville, WI | +56.0% |
| Springfield, OR | +56.0% |
| Nashua, NH | +56.0% |
| Oxnard, CA | +56.1% |
| Nampa, ID | +56.3% |
| Portland, ME | +56.3% |
| Schenectady, NY | +56.4% |
| Westfield, IN | +56.4% |
| West Hartford, CT | +56.6% |
| Lacey, WA | +56.7% |
| Lynn, MA | +56.7% |
| Asheville, NC | +57.0% |
| Troy, MI | +57.0% |
| Quincy, MA | +57.0% |
| Paramount, CA | +57.1% |
| Sparks, NV | +57.4% |
| Lodi, CA | +57.4% |
| Denton, TX | +57.5% |
| Colorado Springs, CO | +57.6% |
| Loveland, CO | +57.6% |
| Baldwin Park, CA | +57.6% |
| Peoria, AZ | +57.8% |
| West Des Moines, IA | +58.1% |
| Goodyear, AZ | +58.4% |
| Weymouth, MA | +58.6% |
| Anchorage, AK | +58.8% |
| Malden, MA | +58.8% |
| Meridian, ID | +59.1% |
| Norwalk, CT | +59.4% |
| Pflugerville, TX | +59.5% |
| National City, CA | +59.6% |
| Methuen, MA | +59.8% |
| Thornton, CO | +59.9% |
| Albany, OR | +60.1% |
| Medford, MA | +60.1% |
| Roseville, CA | +60.2% |
| Watsonville, CA | +60.5% |
| Stamford, CT | +60.6% |
| Plainfield, NJ | +60.7% |
| Tracy, CA | +60.7% |
| Waltham, MA | +61.2% |
| Reston, VA | +61.8% |
| Charleston, SC | +61.9% |
| Spring Hill, TN | +62.1% |
| Santa Maria, CA | +62.1% |
| Kennewick, WA | +62.3% |
| Henderson, NV | +62.6% |
| Ontario, CA | +62.8% |
| Jurupa Valley, CA | +63.0% |
| Aurora, CO | +63.1% |
| Marietta, GA | +63.5% |
| Gilbert, AZ | +63.7% |
| Ankeny, IA | +63.9% |
| Mesa, AZ | +64.2% |
| Centreville, VA | +64.5% |
| Redlands, CA | +64.9% |
| Tempe, AZ | +65.1% |
| Minnetonka, MN | +65.1% |
| Lakewood, NJ | +65.1% |
| Spokane, WA | +65.4% |
| Pomona, CA | +65.6% |
| White Plains, NY | +65.9% |
| Riverside, CA | +66.0% |
| Ames, IA | +66.1% |
| Sioux Falls, SD | +66.1% |
| Leander, TX | +66.1% |
| Smyrna, GA | +66.6% |
| Chandler, AZ | +66.8% |
| Spokane Valley, WA | +67.0% |
| Queen Creek, AZ | +67.2% |
| Plymouth, MN | +67.3% |
| Temecula, CA | +67.3% |
| North Richland Hills, TX | +67.4% |
| Somerville, MA | +67.6% |
| Raleigh, NC | +67.7% |
| Lewisville, TX | +67.7% |
| Union City, NJ | +67.7% |
| Fort Collins, CO | +67.8% |
| Passaic, NJ | +67.9% |
| Bismarck, ND | +68.0% |
| Oak Park, IL | +68.0% |
| Appleton, WI | +68.1% |
| Murrieta, CA | +68.2% |
| Rockville, MD | +68.6% |
| Brookline, MA | +68.6% |
| Shawnee, KS | +69.0% |
| Hacienda Heights, CA | +69.0% |
| Lake Havasu City, AZ | +69.3% |
| Norwalk, CA | +69.3% |
| Rancho Cucamonga, CA | +69.4% |
| Hilo, HI | +69.5% |
| Ogden, UT | +70.0% |
| Novi, MI | +70.1% |
| Flagstaff, AZ | +70.2% |
| Richland, WA | +70.3% |
| East Orange, NJ | +70.3% |
| Berwyn, IL | +70.5% |
| Corvallis, OR | +70.5% |
| Santa Rosa, CA | +70.6% |
| Olympia, WA | +71.1% |
| Silver Spring, MD | +71.1% |
| Salem, OR | +71.3% |
| Hillsboro, OR | +71.5% |
| Yonkers, NY | +71.5% |
| Arlington Heights, IL | +72.0% |
| Huntersville, NC | +72.2% |
| Urban Honolulu, HI | +72.3% |
| Novato, CA | +72.4% |
| Corona, CA | +72.5% |
| Greeley, CO | +72.7% |
| Denver, CO | +72.8% |
| Round Rock, TX | +72.9% |
| Tacoma, WA | +73.0% |
| Mount Prospect, IL | +73.0% |
| Salinas, CA | +73.0% |
| Collierville, TN | +73.3% |
| Elizabeth, NJ | +73.6% |
| Santa Fe, NM | +73.9% |
| Westminster, CO | +74.0% |
| La Crosse, WI | +74.1% |
| Oakland, CA | +74.2% |
| Rochester Hills, MI | +74.3% |
| Manhattan, KS | +74.5% |
| Chico, CA | +74.5% |
| Highlands Ranch, CO | +74.5% |
| St. George, UT | +74.6% |
| Billings, MT | +74.7% |
| Yucaipa, CA | +74.9% |
| Madison, WI | +75.0% |
| Wake Forest, NC | +75.0% |
| Rapid City, SD | +75.4% |
| Vancouver, WA | +75.4% |
| Aliso Viejo, CA | +75.6% |
| Boise City, ID | +76.0% |
| Flower Mound, TX | +76.1% |
| Eastvale, CA | +76.5% |
| Green Bay, WI | +77.0% |
| Carrollton, TX | +77.0% |
| Simi Valley, CA | +77.0% |
| Oceanside, CA | +77.1% |
| Idaho Falls, ID | +77.3% |
| Richardson, TX | +77.5% |
| Chula Vista, CA | +78.1% |
| Concord, CA | +78.3% |
| Arvada, CO | +78.6% |
| Rocklin, CA | +79.0% |
| Longmont, CO | +79.1% |
| Santa Clarita, CA | +79.2% |
| West Valley City, UT | +79.3% |
| Mooresville, NC | +79.4% |
| Cambridge, MA | +79.5% |
| Clifton, NJ | +79.8% |
| Farmington Hills, MI | +80.0% |
| Waukesha, WI | +80.6% |
| Overland Park, KS | +80.9% |
| Reno, NV | +80.9% |
| Georgetown, TX | +81.1% |
| Rockwall, TX | +81.1% |
| Santee, CA | +81.3% |
| Yakima, WA | +81.4% |
| Santa Ana, CA | +81.5% |
| Mansfield, TX | +81.6% |
| Bayonne, NJ | +82.0% |
| Compton, CA | +82.1% |
| Framingham, MA | +82.1% |
| Inglewood, CA | +82.2% |
| Hoover, AL | +82.5% |
| Gresham, OR | +82.6% |
| Layton, UT | +83.6% |
| Lakewood, WA | +83.6% |
| Camarillo, CA | +84.3% |
| Fargo, ND | +84.4% |
| El Monte, CA | +84.4% |
| Johns Creek, GA | +84.5% |
| Logan, UT | +84.6% |
| Apex, NC | +85.0% |
| Beaverton, OR | +85.1% |
| San Buenaventura (Ventura), CA | +85.5% |
| Carmichael, CA | +85.6% |
| Thousand Oaks, CA | +85.6% |
| Taylorsville, UT | +85.7% |
| Centennial, CO | +86.3% |
| Eden Prairie, MN | +86.4% |
| Lynwood, CA | +87.5% |
| Paterson, NJ | +87.6% |
| Glendora, CA | +88.3% |
| Alexandria, VA | +88.5% |
| Auburn, WA | +88.8% |
| Castle Rock, CO | +89.0% |
| Chino Hills, CA | +89.2% |
| East Los Angeles, CA | +90.4% |
| Hendersonville, TN | +90.7% |
| Folsom, CA | +90.7% |
| San Marcos, CA | +90.8% |
| El Dorado Hills, CA | +91.2% |
| Petaluma, CA | +92.7% |
| Pocatello, ID | +92.9% |
| Parker, CO | +92.9% |
| Broomfield, CO | +93.3% |
| Eau Claire, WI | +93.6% |
| Buena Park, CA | +94.2% |
| Vista, CA | +94.3% |
| Carmel, IN | +94.4% |
| Plano, TX | +94.6% |
| Lakewood, CO | +94.7% |
| Edina, MN | +94.9% |
| Arlington, VA | +95.1% |
| Naperville, IL | +95.3% |
| Lenexa, KS | +95.6% |
| Portland, OR | +95.9% |
| Federal Way, WA | +96.0% |
| Provo, UT | +96.5% |
| West Covina, CA | +96.5% |
| McKinney, TX | +97.0% |
| Napa, CA | +97.2% |
| Diamond Bar, CA | +97.8% |
| Tigard, OR | +98.2% |
| La Habra, CA | +98.2% |
| Rosemead, CA | +98.3% |
| Orem, UT | +98.6% |
| Bend, OR | +99.4% |
| Hayward, CA | +99.5% |
| San Leandro, CA | +99.7% |
| West Jordan, UT | +100.4% |
| Escondido, CA | +101.0% |
| Gardena, CA | +101.6% |
| La Mesa, CA | +103.6% |
| Davis, CA | +104.5% |
| Bellflower, CA | +104.6% |
| Herriman, UT | +105.0% |
| Grapevine, TX | +105.1% |
| South San Francisco, CA | +105.1% |
| Ellicott City, MD | +105.9% |
| Coeur d’Alene, ID | +106.1% |
| Kent, WA | +107.0% |
| Whittier, CA | +107.6% |
| San Francisco, CA | +107.8% |
| San Diego, CA | +107.9% |
| Los Angeles, CA | +108.2% |
| Anaheim, CA | +108.3% |
| Everett, WA | +108.5% |
| Huntington Park, CA | +109.3% |
| Allen, TX | +109.5% |
| Salt Lake City, UT | +109.7% |
| Bellingham, WA | +109.7% |
| Cedar Park, TX | +109.9% |
| Upland, CA | +110.2% |
| Orange, CA | +110.6% |
| Gilroy, CA | +111.7% |
| South Jordan, UT | +113.0% |
| Montebello, CA | +113.2% |
| Mount Pleasant, SC | +113.4% |
| Pico Rivera, CA | +114.7% |
| Alpharetta, GA | +115.0% |
| Renton, WA | +115.1% |
| El Cajon, CA | +116.4% |
| Austin, TX | +117.0% |
| South Gate, CA | +118.2% |
| Yorba Linda, CA | +120.0% |
| Boulder, CO | +123.3% |
| Tustin, CA | +124.3% |
| Monterey Park, CA | +125.5% |
| Long Beach, CA | +126.1% |
| Walnut Creek, CA | +126.6% |
| Fullerton, CA | +127.2% |
| Burien, WA | +128.0% |
| Santa Cruz, CA | +128.9% |
| Livermore, CA | +129.6% |
| Cary, NC | +130.0% |
| Alhambra, CA | +131.0% |
| Lake Forest, CA | +131.4% |
| New Rochelle, NY | +132.6% |
| Missoula, MT | +132.8% |
| Scottsdale, AZ | +133.8% |
| Chapel Hill, NC | +134.0% |
| Torrance, CA | +134.4% |
| Murray, UT | +135.7% |
| Carlsbad, CA | +136.3% |
| Roswell, GA | +136.5% |
| Seattle, WA | +137.8% |
| Downey, CA | +138.2% |
| Garden Grove, CA | +139.7% |
| Pasadena, CA | +140.8% |
| Placentia, CA | +142.2% |
| Dunwoody, GA | +142.6% |
| Bethesda, MD | +143.9% |
| Burbank, CA | +147.1% |
| Brookhaven, GA | +147.2% |
| Sandy Springs, GA | +148.3% |
| Sandy, UT | +148.5% |
| Castro Valley, CA | +149.4% |
| Frisco, TX | +150.0% |
| Daly City, CA | +150.7% |
| Shoreline, WA | +150.9% |
| Arcadia, CA | +155.5% |
| Redondo Beach, CA | +155.5% |
| Westminster, CA | +155.6% |
| Dublin, CA | +161.1% |
| Franklin, TN | +161.4% |
| Glendale, CA | +162.4% |
| Huntington Beach, CA | +164.2% |
| San Rafael, CA | +165.6% |
| Alameda, CA | +166.0% |
| Costa Mesa, CA | +167.0% |
| Encinitas, CA | +167.0% |
| Milpitas, CA | +167.7% |
| Millcreek, UT | +167.9% |
| Laguna Niguel, CA | +172.3% |
| Hawthorne, CA | +172.8% |
| San Jose, CA | +173.4% |
| Newton, MA | +178.9% |
| Berkeley, CA | +180.3% |
| Santa Barbara, CA | +183.0% |
| Irvine, CA | +184.2% |
| Draper, UT | +186.7% |
| Santa Clara, CA | +186.9% |
| Fountain Valley, CA | +187.2% |
| San Mateo, CA | +189.4% |
| Santa Monica, CA | +191.8% |
| Union City, CA | +198.6% |
| Mountain View, CA | +199.4% |
| Redwood City, CA | +201.4% |
| Fremont, CA | +204.4% |
| Kirkland, WA | +208.4% |
| San Clemente, CA | +212.1% |
| Sammamish, WA | +212.5% |
| Pleasanton, CA | +230.6% |
| San Ramon, CA | +239.6% |
| Bellevue, WA | +252.1% |
| Redmond, WA | +255.4% |
| Sunnyvale, CA | +265.8% |
| Cupertino, CA | +377.0% |
| Newport Beach, CA | +428.5% |
| Palo Alto, CA | +463.9% |
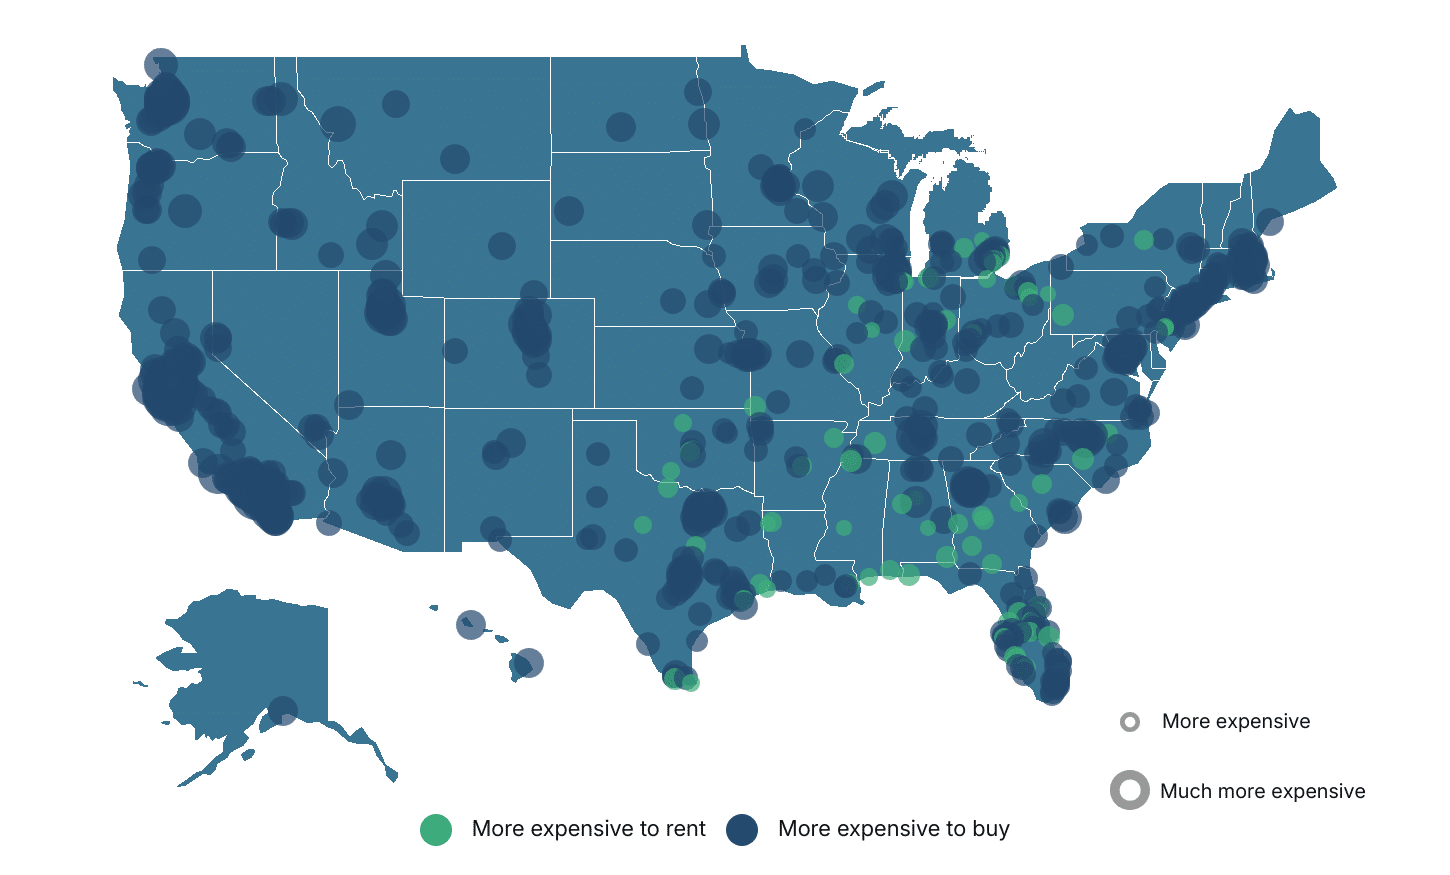
And within some geographic markets, buying is unquestionably more difficult. Locations that face low supply, competitive markets, and high home prices—like cities throughout California and in the greater Seattle, WA region—can be four or even close to five times more expensive for buyers. Cities like fast-growing Draper, UT, and historic Newton, MA, are also proving especially challenging for buyers.
Out of the 838 U.S. cities considered in this analysis, only 95 are currently more affordable for buyers than renters. Most of these locations are found in Southern states like Alabama, Georgia, and Texas or in Rust Belt locations like Ohio and Michigan. In these locations, home costs remain relatively low, allowing buyers to save relative to the cost of renting.
Below is a complete breakdown of nearly 838 U.S. cities and 1,265 counties. The analysis was conducted by Construction Coverage using data from Zillow, the U.S. Census Bureau, and Freddie Mac. For more information, refer to the methodology section.
The Cheapest Large Cities for Homebuyers
| Top Large Cities | Premium* |
|---|---|
| 1. Detroit, MI | -62.4% |
| 2. Cleveland, OH | -42.6% |
| 3. Baltimore, MD | -26.8% |
| 4. Memphis, TN | -25.3% |
| 5. Philadelphia, PA | -17.5% |
| 6. Chicago, IL | -8.2% |
| 7. New Orleans, LA | -8.0% |
| 8. Oklahoma City, OK | +2.0% |
| 9. Indianapolis, IN | +4.5% |
| 10. Milwaukee, WI | +9.4% |
| 11. Jacksonville, FL | +10.4% |
| 12. Kansas City, MO | +11.7% |
| 13. Tulsa, OK | +12.3% |
| 14. El Paso, TX | +13.1% |
| 15. Houston, TX | +13.8% |
| Bottom Large Cities | Premium* |
|---|---|
| 1. San Jose, CA | +173.4% |
| 2. Seattle, WA | +137.8% |
| 3. Long Beach, CA | +126.1% |
| 4. Austin, TX | +117.0% |
| 5. Los Angeles, CA | +108.2% |
| 6. San Diego, CA | +107.9% |
| 7. San Francisco, CA | +107.8% |
| 8. Portland, OR | +95.9% |
| 9. Oakland, CA | +74.2% |
| 10. Denver, CO | +72.8% |
| 11. Raleigh, NC | +67.7% |
| 12. Mesa, AZ | +64.2% |
| 13. Aurora, CO | +63.1% |
| 14. Colorado Springs, CO | +57.6% |
| 15. Phoenix, AZ | +54.8% |
The Cheapest Counties for Homebuyers
| Top Counties | Premium* |
|---|---|
| 1. Pike County, KY | -65.1% |
| 2. Halifax County, NC | -45.7% |
| 3. Hinds County, MS | -40.8% |
| 4. Halifax County, VA | -36.6% |
| 5. Walker County, AL | -36.4% |
| 6. Whitley County, KY | -35.4% |
| 7. Iberia Parish, LA | -33.1% |
| 8. Tallapoosa County, AL | -31.3% |
| 9. Dale County, AL | -31.2% |
| 10. Orangeburg County, SC | -30.9% |
| 11. Darlington County, SC | -30.6% |
| 12. Danville City, VA | -30.4% |
| 13. Montgomery County, AL | -30.4% |
| 14. Kleberg County, TX | -29.2% |
| 15. Lauderdale County, MS | -28.9% |
| Bottom Counties | Premium* |
|---|---|
| 1. Santa Clara County, CA | +191.7% |
| 2. Falls Church City, VA | +174.4% |
| 3. San Mateo County, CA | +170.5% |
| 4. Williamson County, TN | +161.2% |
| 5. Codington County, SD | +152.8% |
| 6. Marin County, CA | +147.1% |
| 7. Teton County, WY | +146.7% |
| 8. Kendall County, TX | +145.9% |
| 9. Blaine County, ID | +143.3% |
| 10. Summit County, UT | +140.3% |
| 11. Alameda County, CA | +137.3% |
| 12. King County, WA | +134.6% |
| 13. Latah County, ID | +132.8% |
| 14. Missoula County, MT | +130.7% |
| 15. Orange County, CA | +126.0% |
*Premium/discount of buying vs. renting
Full Results
Methodology
The data used in this study is from Zillow’s Home Value Index (ZHVI) and Observed Rent Index (ZORI), U.S. Census Bureau’s 2024 American Community Survey (ACS), and Freddie Mac’s Primary Mortgage Market Survey. To determine the relative cost of buying vs. renting by location, researchers calculated the percentage difference in the monthly mortgage payment and property taxes for a median price home compared to the monthly rent payment for a median price rental. The monthly mortgage payment reflects a 30-year mortgage with a 10% down payment at a 6.22% interest rate based on the current ZHVI as of February 2026. Monthly property tax estimates were obtained using ACS data by dividing aggregate annual property taxes paid in each location by the aggregate value of all homes. The resulting percentage was multiplied by the median home price and divided by 12. Only locations with available data from all sources were included in the analysis. To improve relevance, cities were divided into groups based on population size: large (350,000+), midsize (150,000–349,999), and small (100,000–149,999).
References
- Duca, J. and Murphy, A. (December 28, 2021). Why House Prices Surged as the COVID-19 Pandemic Took Hold. Federal Reserve Bank of Dallas. https://www.dallasfed.org/research/economics/2021/1228.
- U.S. Census Bureau and the U.S. Department of Housing and Urban Development (March 23, 2026). Median Sales Price of Houses Sold for the United States. https://fred.stlouisfed.org/series/MSPUS.
- U.S. Bureau of Labor Statistics (March 23, 2026). Consumer Price Index for All Urban Consumers: Rent of Primary Residence in U.S. City Average. https://fred.stlouisfed.org/series/CUUR0000SEHA.
- Zillow (2026). Zillow Home Value Index. https://www.zillow.com/research/data/.
- Zillow (2026). Zillow Observed Rent Index. https://www.zillow.com/research/data/.
- U.S. Census Bureau (2026). American Community Survey 5-Year Estimates. https://www.census.gov/programs-surveys/acs.
- Freddie Mac (March 23, 2026). Primary Mortgage Market Survey. https://www.freddiemac.com/pmms.