
Cities Where Millennials Are Buying the Most Expensive Homes
Note: This is the most recent release of our Cities Where Millennials Are Buying the Most Expensive Homes study. To see data from prior years, please visit the Full Results section below.
The shift to remote work during the COVID-19 pandemic coincided with a significant increase in Americans relocating from high-cost urban centers like New York, Los Angeles, and the Bay Area to smaller and more affordable communities. This large-scale migration, however, has contributed to a growing challenge of housing affordability in these previously lower-cost areas, and the resulting surge in demand pushed U.S. home prices to record highs.
Despite a modest recent decline in prices from COVID-era highs, housing affordability remains a challenge for Americans, particularly millennials entering their prime homeownership years. Nearly half of U.S. homeowners and renters report struggling to afford their housing payments—often resorting to significant sacrifices to manage these expenses—and 14% of millennials have tapped into their retirement savings to cover housing payments, despite the oldest millennials still being two decades from the traditional retirement age. With low inventory and high interest rates a persistent challenge, millennials could be facing home affordability difficulties for years to come.
Trends in Millennial Homebuying
Millennial home purchase prices have stabilized after rising faster than their incomes
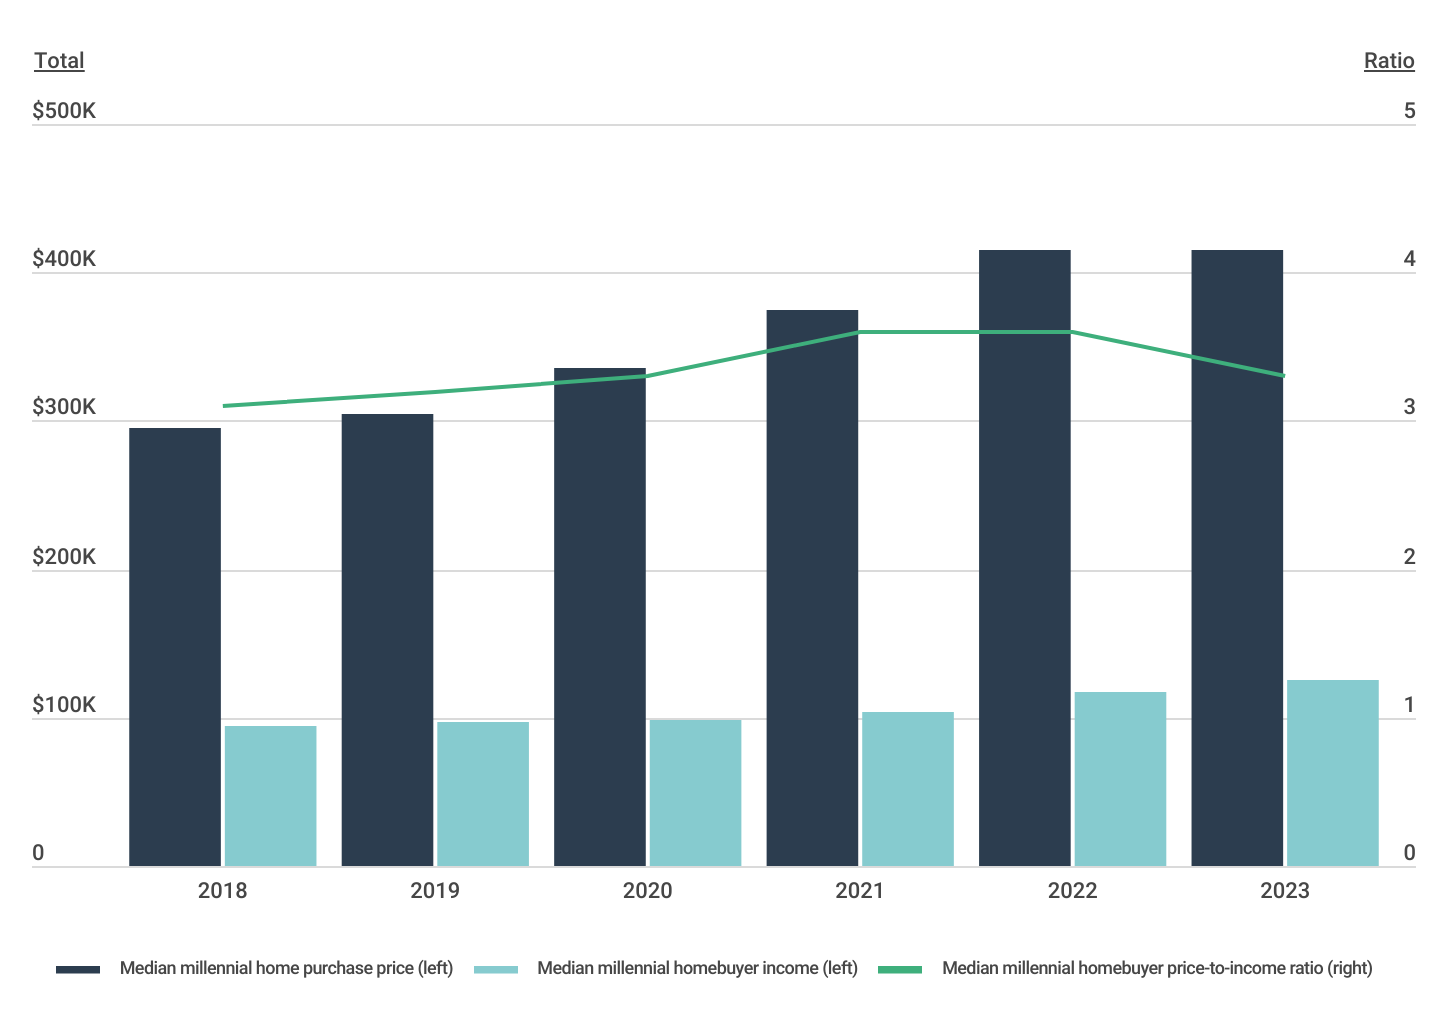
Millennials are squarely in the age range where Americans typically get ready to settle down, form households, and have children—all of which require more space, and for many, buying property. Millennials are also deep enough into their careers to have accumulated savings and paid down student loans, a significant barrier to homeownership. Yet while median millennial income has increased in the last five years, it was not until recent years that it outpaced the growth in home purchase prices for millennials.
The millennial homebuyer price-to-income ratio—or the ratio between what millennials are spending on homes versus what they make in a year—has finally stabilized after increasing significantly during the pandemic. In 2018 and 2019, the millennial homebuyer price-to-income ratio was 3.1 and 3.2, respectively. By 2021, the millennial homebuyer price-to-income ratio increased to a striking 3.6, and as of 2023, it sits at 3.3. Despite the millennial price-to-income ratio slightly easing last year, millennial home prices increased 40.7% since 2018 while their incomes only rose 31.6%, highlighting the mounting financial barriers for millennials when it comes to homeownership.
Home Purchase Price and Income by Age
Millennials are nearing their peak years for homebuyer income and home purchase price
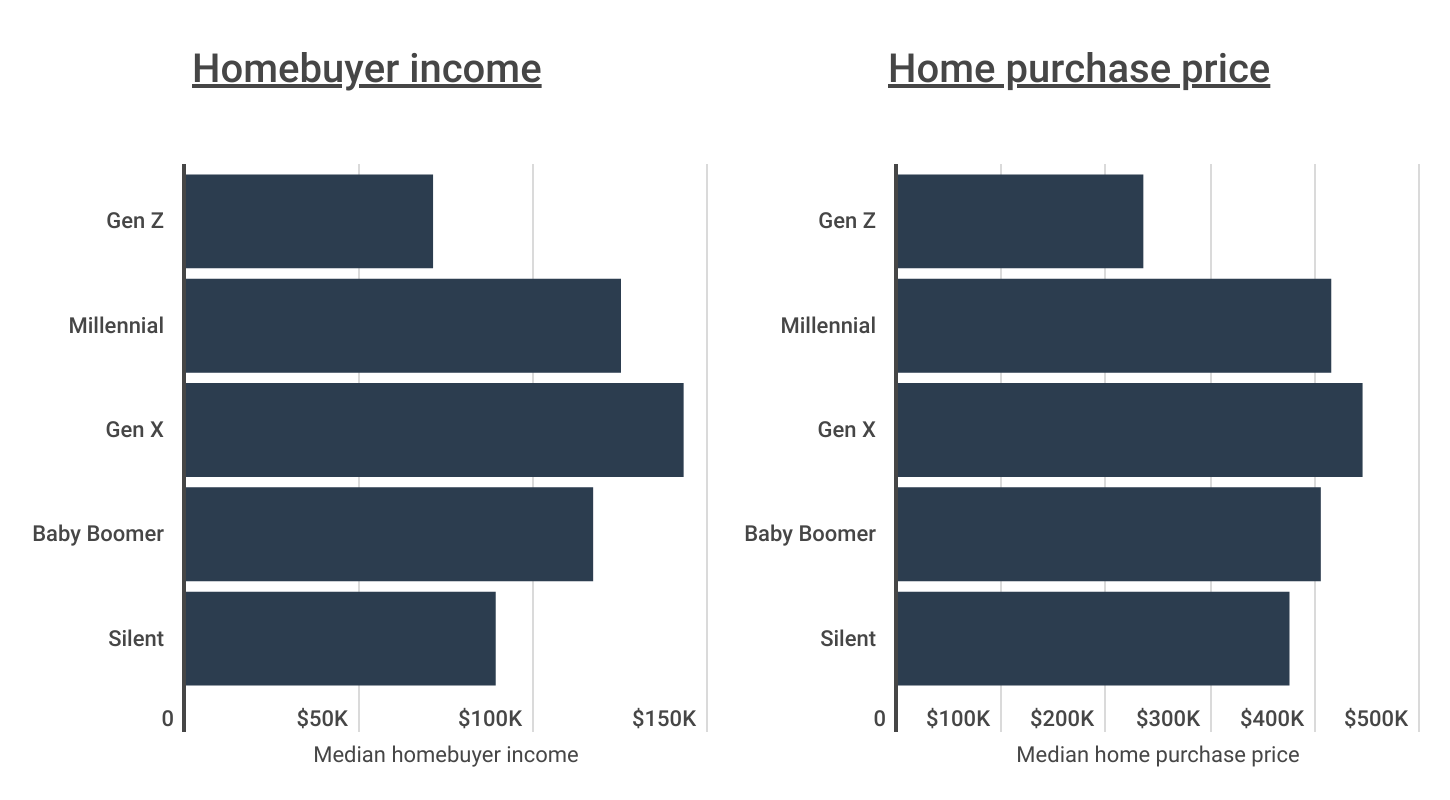
In spite of the elevated gap between home prices and incomes for millennial buyers, millennials are entering their prime earning years, making it a pivotal time to buy. In 2023, the median income for millennial homebuyers stood at $125,000, which was 76% higher than the $71,000 median income of Gen Z buyers. Gen X homebuyers had the highest median income at $143,000, while older generations tended to have lower incomes. This suggests that millennial purchasing power is likely nearing its peak.
However, this advantage may be offset by the fact that millennials are also entering the years where they are likely to purchase more expensive homes. The median home purchase price for millennials in 2023 was $415,000. That’s nearly 77% higher than the median home purchase price for Gen Z buyers, and second only to the Gen X median purchase price of $445,000.
FOR HOMEOWNERS
Looking to increase the value of your home with an updated kitchen or a renovated bathroom? Be sure to consider builders risk insurance for homeowners which will provide coverage for your home while it’s under renovation.
Geographical Differences in Millennial Home Purchase Price
Millennials in Arkansas, North Dakota, and Illinois are buying homes priced well above their state averages
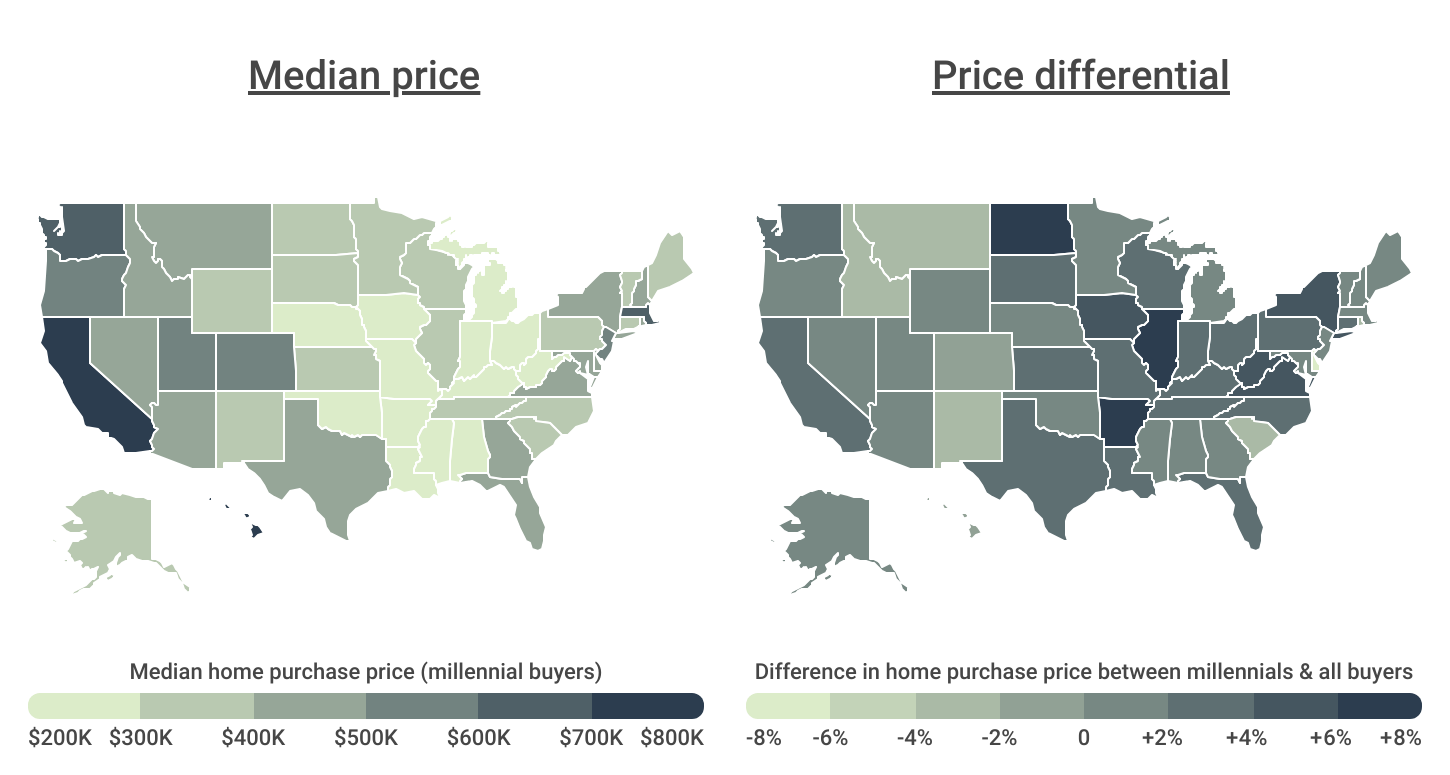
The nation’s largest generation has begun buying homes at a time when housing inflation is necessitating more expensive home purchases. At the state level, millennials are buying the most expensive homes in coastal areas like Hawaii ($785,000), California ($755,000), Washington ($635,000), and Massachusetts ($605,000).
However, it’s important to note that the median prices for homebuyers of all ages in these states—Hawaii ($795,000), California ($735,000), Washington ($615,000), and Massachusetts ($605,000)—are also the highest in the country. So while millennial purchases are more expensive in these coastal states in absolute terms, the gap between millennial home purchase prices and the median purchase price across all buyers is greatest in parts of the South and Midwest. In states like Arkansas, North Dakota, and Illinois, millennials are spending at least 6% more on homes than what is typical across all buyers.
Below is a breakdown of where millennials are buying the most expensive homes across nearly 400 metros and all 50 states conducted by Construction Coverage, using data from the Federal Financial Institutions Examination Council’s Home Mortgage Disclosure Act dataset. For more detailed information, refer to the methodology section.
Large Metros Where Millennials Are Buying the Most Expensive Homes
| Metros With Largest Millennial Home Purchase Price | Price* |
|---|---|
| 1. San Jose-Sunnyvale-Santa Clara, CA | $1,435,000 |
| 2. San Francisco-Oakland-Berkeley, CA | $1,135,000 |
| 3. Los Angeles-Long Beach-Anaheim, CA | $885,000 |
| 4. San Diego-Chula Vista-Carlsbad, CA | $835,000 |
| 5. Seattle-Tacoma-Bellevue, WA | $765,000 |
| 6. Boston-Cambridge-Newton, MA-NH | $675,000 |
| 7. New York-Newark-Jersey City, NY-NJ-PA | $645,000 |
| 8. Denver-Aurora-Lakewood, CO | $605,000 |
| 9. Riverside-San Bernardino-Ontario, CA | $585,000 |
| 10. Washington-Arlington-Alexandria, DC-VA-MD-WV | $585,000 |
| 11. Sacramento-Roseville-Folsom, CA | $585,000 |
| 12. Portland-Vancouver-Hillsboro, OR-WA | $555,000 |
| 13. Salt Lake City, UT | $535,000 |
| 14. Miami-Fort Lauderdale-Pompano Beach, FL | $535,000 |
| 15. Austin-Round Rock-Georgetown, TX | $505,000 |
| Metros With Largest Millennial Purchase Price Difference | Difference** |
|---|---|
| 1. Chicago-Naperville-Elgin, IL-IN-WI | +5.8% |
| 2. Buffalo-Cheektowaga, NY | +3.9% |
| 3. Cleveland-Elyria, OH | +3.9% |
| 4. Detroit-Warren-Dearborn, MI | +3.5% |
| 5. Birmingham-Hoover, AL | +3.3% |
| 6. Cincinnati, OH-KY-IN | +3.3% |
| 7. Grand Rapids-Kentwood, MI | +3.2% |
| 8. San Francisco-Oakland-Berkeley, CA | +2.7% |
| 9. Seattle-Tacoma-Bellevue, WA | +2.7% |
| 10. Minneapolis-St. Paul-Bloomington, MN-WI | +2.7% |
| 11. Houston-The Woodlands-Sugar Land, TX | +2.7% |
| 12. Tampa-St. Petersburg-Clearwater, FL | +2.4% |
| 13. Atlanta-Sandy Springs-Alpharetta, GA | +2.3% |
| 14. Raleigh-Cary, NC | +2.2% |
| 15. Dallas-Fort Worth-Arlington, TX | +2.2% |
Midsize Metros Where Millennials Are Buying the Most Expensive Homes
| Metros With Largest Millennial Home Purchase Price | Price* |
|---|---|
| 1. Urban Honolulu, HI | $815,000 |
| 2. Oxnard-Thousand Oaks-Ventura, CA | $795,000 |
| 3. Santa Rosa-Petaluma, CA | $755,000 |
| 4. Salinas, CA | $755,000 |
| 5. Santa Maria-Santa Barbara, CA | $735,000 |
| 6. Stockton, CA | $655,000 |
| 7. Bridgeport-Stamford-Norwalk, CT | $615,000 |
| 8. Vallejo, CA | $615,000 |
| 9. Naples-Marco Island, FL | $565,000 |
| 10. Greeley, CO | $535,000 |
| 11. Fort Collins, CO | $535,000 |
| 12. Reno, NV | $525,000 |
| 13. Provo-Orem, UT | $515,000 |
| 14. Ogden-Clearfield, UT | $485,000 |
| 15. Modesto, CA | $485,000 |
| Metros With Largest Millennial Purchase Price Difference | Difference** |
|---|---|
| 1. Davenport-Moline-Rock Island, IA-IL | +10.3% |
| 2. Canton-Massillon, OH | +9.3% |
| 3. Akron, OH | +8.5% |
| 4. Shreveport-Bossier City, LA | +8.5% |
| 5. Youngstown-Warren-Boardman, OH-PA | +5.7% |
| 6. Huntington-Ashland, WV-KY-OH | +5.7% |
| 7. Peoria, IL | +5.7% |
| 8. Flint, MI | +4.7% |
| 9. Scranton–Wilkes-Barre, PA | +4.7% |
| 10. Beaumont-Port Arthur, TX | +4.4% |
| 11. Dayton-Kettering, OH | +4.3% |
| 12. Mobile, AL | +4.1% |
| 13. Lafayette, LA | +4.1% |
| 14. El Paso, TX | +3.9% |
| 15. York-Hanover, PA | +3.5% |
Small Metros Where Millennials Are Buying the Most Expensive Homes
| Metros With Largest Millennial Home Purchase Price | Price* |
|---|---|
| 1. Santa Cruz-Watsonville, CA | $975,000 |
| 2. Kahului-Wailuku-Lahaina, HI | $855,000 |
| 3. San Luis Obispo-Paso Robles, CA | $775,000 |
| 4. Napa, CA | $755,000 |
| 5. Boulder, CO | $715,000 |
| 6. Barnstable Town, MA | $615,000 |
| 7. Bend, OR | $605,000 |
| 8. Flagstaff, AZ | $585,000 |
| 9. Bellingham, WA | $585,000 |
| 10. Mount Vernon-Anacortes, WA | $555,000 |
| 11. Bremerton-Silverdale-Port Orchard, WA | $545,000 |
| 12. Corvallis, OR | $535,000 |
| 13. Missoula, MT | $535,000 |
| 14. St. George, UT | $525,000 |
| 15. Coeur d’Alene, ID | $525,000 |
| Metros With Largest Millennial Purchase Price Difference | Difference** |
|---|---|
| 1. Lima, OH | +17.1% |
| 2. Johnstown, PA | +14.8% |
| 3. Decatur, IL | +13.8% |
| 4. Terre Haute, IN | +12.1% |
| 5. Anniston-Oxford, AL | +10.8% |
| 6. Waterloo-Cedar Falls, IA | +10.8% |
| 7. Springfield, OH | +10.8% |
| 8. Odessa, TX | +9.3% |
| 9. Dothan, AL | +8.9% |
| 10. Bloomsburg-Berwick, PA | +8.9% |
| 11. Danville, IL | +8.7% |
| 12. Bloomington, IL | +8.5% |
| 13. Dalton, GA | +8.2% |
| 14. Grand Island, NE | +8.2% |
| 15. Houma-Thibodaux, LA | +8.2% |
States Where Millennials Are Buying the Most Expensive Homes
| States With Largest Millennial Home Purchase Price | Price* |
|---|---|
| 1. Hawaii | $785,000 |
| 2. California | $755,000 |
| 3. Washington | $635,000 |
| 4. Massachusetts | $605,000 |
| 5. Colorado | $575,000 |
| 6. New Jersey | $525,000 |
| 7. Oregon | $515,000 |
| 8. Utah | $515,000 |
| 9. Montana | $475,000 |
| 10. New York | $475,000 |
| 11. Arizona | $465,000 |
| 12. Nevada | $465,000 |
| 13. New Hampshire | $455,000 |
| 14. Virginia | $455,000 |
| 15. Maryland | $445,000 |
| States With Largest Millennial Purchase Price Difference | Difference** |
|---|---|
| 1. Arkansas | +7.3% |
| 2. North Dakota | +6.8% |
| 3. Illinois | +6.6% |
| 4. Virginia | +4.6% |
| 5. New York | +4.4% |
| 6. West Virginia | +4.4% |
| 7. Iowa | +4.1% |
| 8. Kentucky | +3.8% |
| 9. Ohio | +3.8% |
| 10. Louisiana | +3.8% |
| 11. Indiana | +3.6% |
| 12. Missouri | +3.5% |
| 13. Kansas | +3.4% |
| 14. Washington | +3.3% |
| 15. Wisconsin | +3.3% |
*Median home purchase price for millennial buyers
**Difference in home purchase price between millennials and all buyers
Methodology
The data used in this analysis comes from the Federal Financial Institutions Examination Council’s 2023 Home Mortgage Disclosure Act. To determine the locations where millennials are buying the most expensive homes, researchers at Construction Coverage compared the median price for conventional residential homes with an originated mortgage in 2023 for millennials and all buyers. Millennials were defined to be ages 25 to 44 in the year 2023. In the event of a tie, the location with the greater median millennial home value was ranked higher. To improve relevance, only metropolitan areas with complete data were included, and metros were grouped into cohorts based on population size: small (less than 350,000), midsize (350,000–999,999), and large (1,000,000 or more).
References
- Ozimek, A. (April 13, 2022). How Remote Work is Shifting Population Growth Across the U.S. Economic Innovation Group. https://eig.org/how-remote-work-is-shifting-population-growth-across-the-u-s/.
- Katz, L. (April 5, 2024). Skipping Meals and Working Overtime: The Sacrifices Americans Make to Afford Housing. Redfin. https://www.redfin.com/news/homebuying-sacrifices-survey-2024/.
- U.S. Government Accountability Office (GAO) (October 12, 2023). The Affordable Housing Crisis Grows While Efforts to Increase Supply Fall Short. https://www.gao.gov/blog/affordable-housing-crisis-grows-while-efforts-increase-supply-fall-short.
- Hanson, M. (October 25, 2023). Average Student Loan Debt by Year. Education Data Initiative. https://educationdata.org/average-student-loan-debt-by-year.
- Schneider, H. (March 5, 2024). Why US housing inflation relief may be short-lived. Reuters. https://www.reuters.com/world/us/supply-still-matters-why-us-housing-inflation-relief-may-be-short-lived-2024-02-28/.
- Federal Financial Institutions Examination Council (2023). The Home Mortgage Disclosure Act. https://ffiec.cfpb.gov/.