
American Cities Where Renters Never Move [2021 Edition]
Approximately 44 million U.S. households (or 35% of total) are renters, according to data from the U.S. Census Bureau. Renters tend to move much more frequently than homeowners. For example, 51% of renters surveyed in the 2019 American Community Survey reported moving into their current home within the past two years compared to just 15% of homeowners. While the majority of renters move frequently, about 5.5% of U.S. renter households have been in the same residence for more than 20 years. For a variety of demographic, economic, and cultural reasons, this percentage is far higher in certain parts of the country.
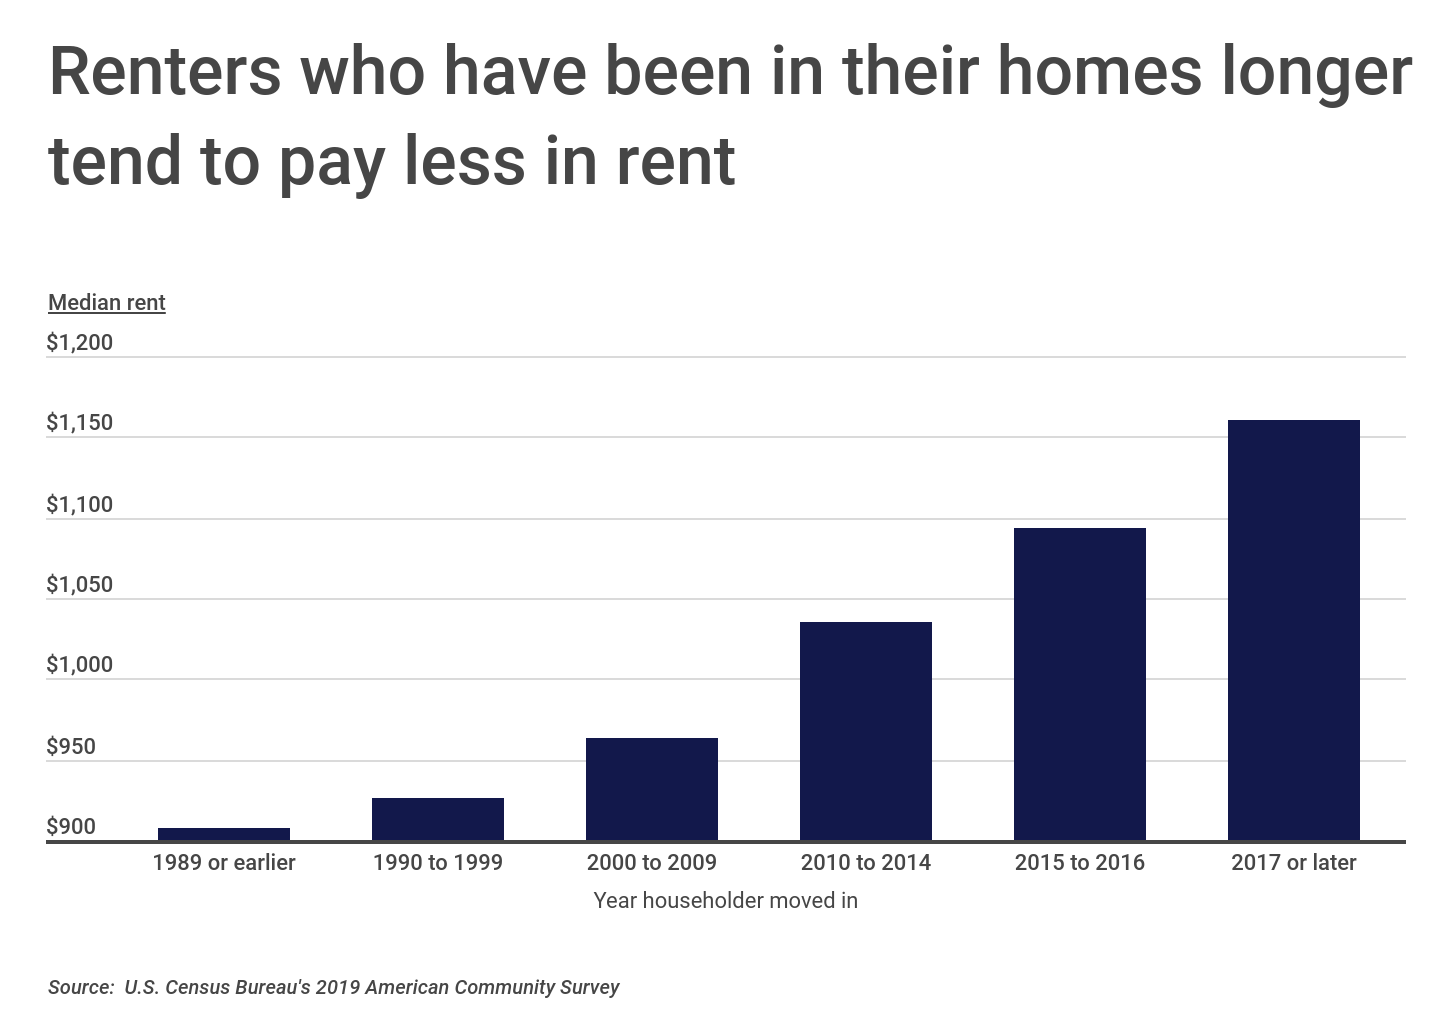
One advantage of staying in a rental unit longer is that landlords tend to raise rent more slowly for existing tenants—a factor that is especially important when market rents are growing faster than wages. Census Bureau data shows that renters who have been in their homes longer pay much less in rent, on average, than renters who have been in their homes for less time. In 2019, the median rent for households who moved into their homes within the past two years was $1,160 per month, or nearly 30% higher than the median rent paid by those who last moved in 1989 or earlier.
FOR LANDLORDS
If you own a rental property, it’s important to have the right insurance. Depending on the property, you might need either a standard commercial property insurance policy or a more specific landlord insurance policy.
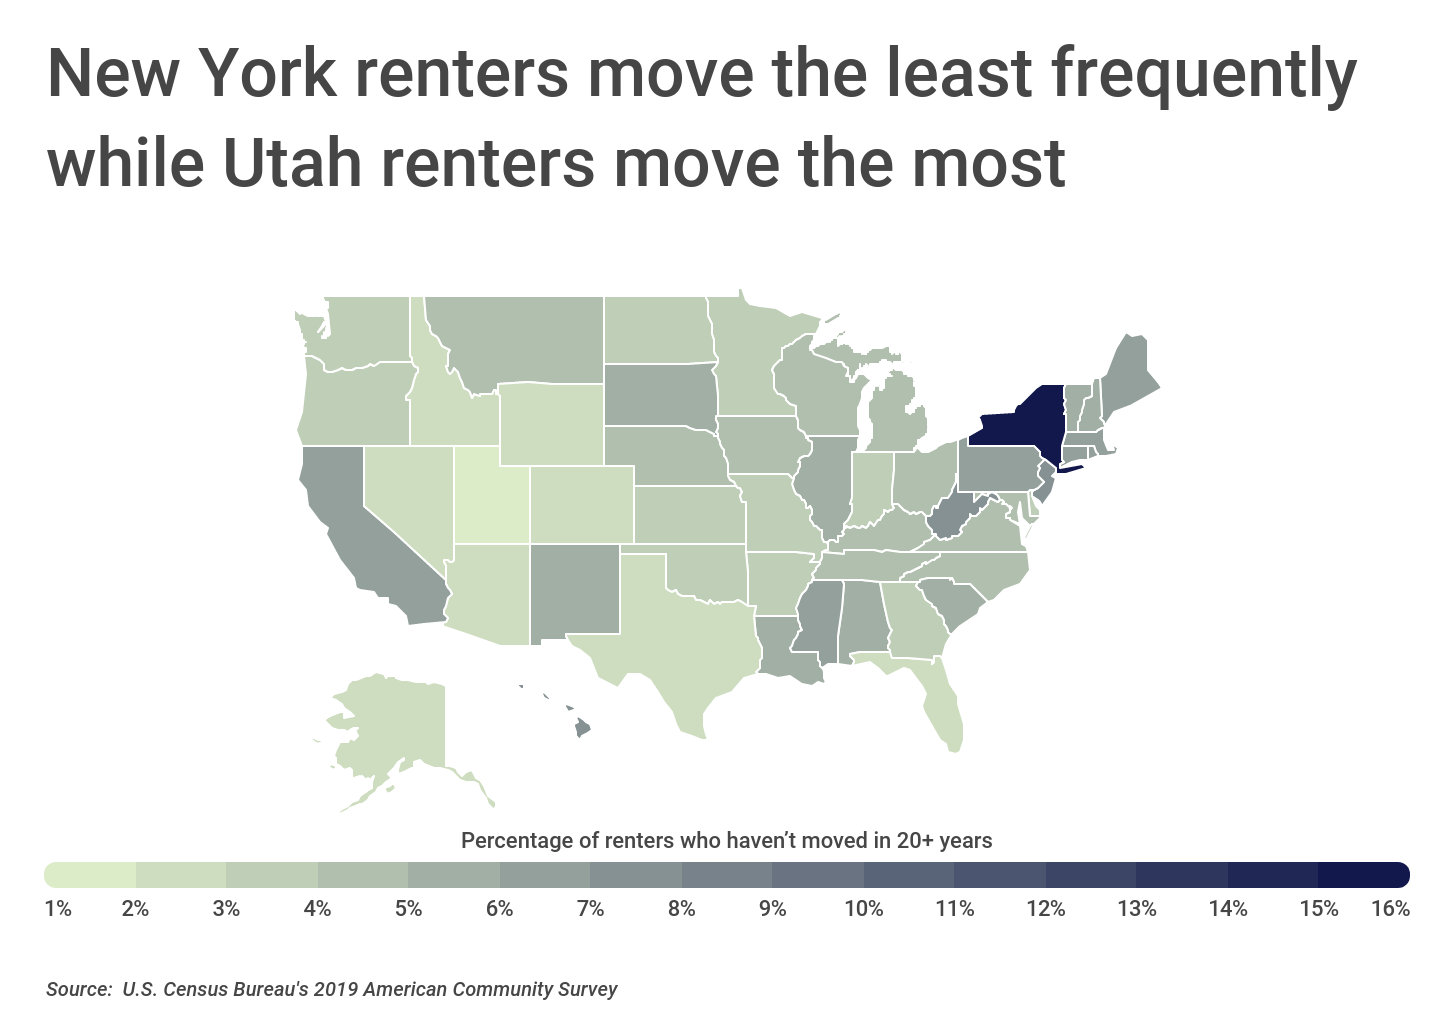
Both average tenure and rental prices vary significantly across the country. On a regional basis, renters in the Northeast and California tend to stay in their homes longer, due to a combination of competitive housing markets, high housing costs, and rent control laws. In New York State, for example, nearly a third of renters haven’t moved in over a decade and more than 15% haven’t moved in at least 20 years. New York State also has the largest proportion of renters of any state at 46.5%. Conversely, Utah has a much lower share of renter households and also the lowest share of long-term renters. Only 1.9% of renters have been in their homes for 20 years or more in Utah.
How these trends evolve in the aftermath of COVID-19 are difficult to predict. On the one hand, the increased popularity of remote work reduces the need to find new housing when switching between jobs based in different locations. At the same time, limited housing inventory and rapidly-growing prices provide financial incentives for renters to stay put. These factors suggest that renters might move less frequently in the years ahead. On the other hand, remote work largely eliminates the need to live in one place, a fact that has fueled the growth of services like monthly rentals on Airbnb and cultural trends like vanlife. Should these trends spill over into the larger housing market, average tenure—especially among certain demographics—would likely decline.
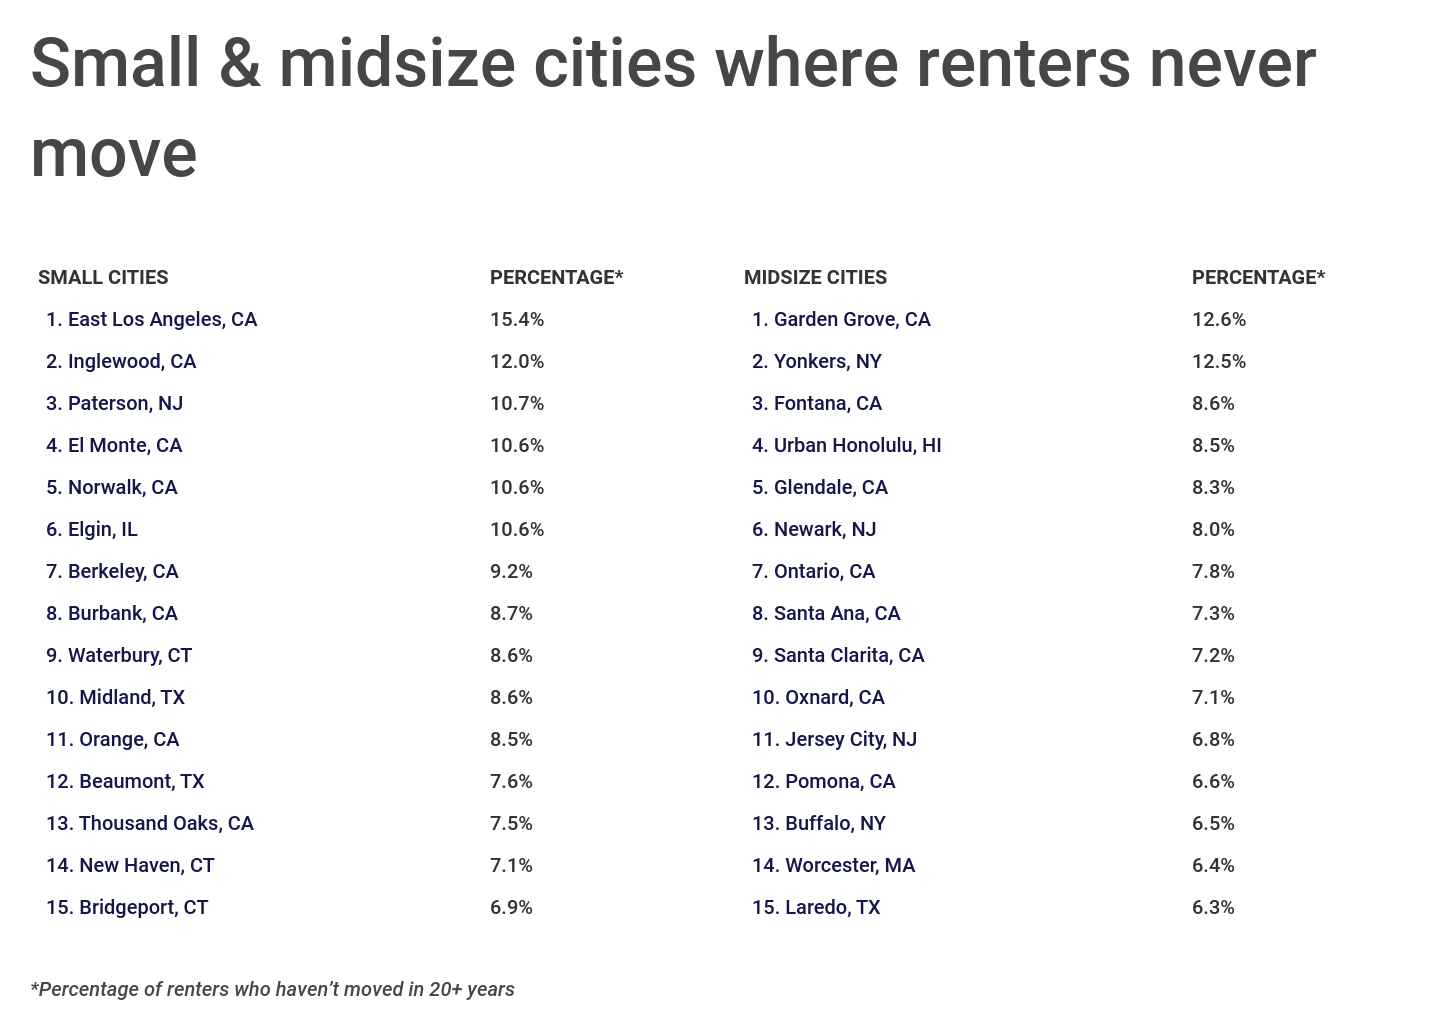
To find the cities where existing renters stay put the longest, researchers at Construction Coverage analyzed the latest data from the U.S. Census Bureau. The researchers ranked cities according to the percentage of renters who haven’t moved in 20 years or more. Researchers also calculated the percentage of renters who haven’t moved in 10 years or more, the percentage of households that rent, the total number of renter households, and median monthly housing costs for renters.
Here are the cities with the largest share of renters who haven’t moved in at least 20 years.
Large Cities Where Renters Never Move
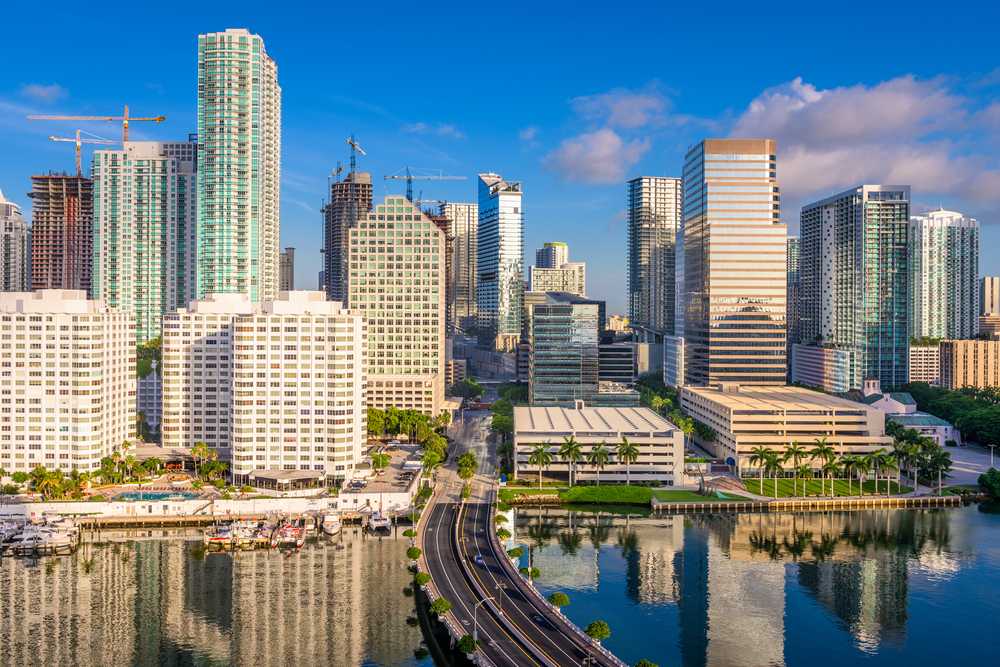
Photo Credit: Sean Pavone / Shutterstock
15. Miami, FL
- Percentage of renters who haven’t moved in 20+ years: 5.4%
- Percentage of renters who haven’t moved in 10+ years: 17.2%
- Percentage of households that rent: 70.4%
- Total renter households: 133,206
- Median monthly housing costs for renters: $1,298

Photo Credit: Sean Pavone / Shutterstock
14. Baltimore, MD
- Percentage of renters who haven’t moved in 20+ years: 5.6%
- Percentage of renters who haven’t moved in 10+ years: 15.5%
- Percentage of households that rent: 52.4%
- Total renter households: 127,170
- Median monthly housing costs for renters: $1,090

Photo Credit: John Roman Images / Shutterstock
13. Anaheim, CA
- Percentage of renters who haven’t moved in 20+ years: 5.6%
- Percentage of renters who haven’t moved in 10+ years: 21.5%
- Percentage of households that rent: 53.9%
- Total renter households: 56,731
- Median monthly housing costs for renters: $1,733

Photo Credit: Sean Pavone / Shutterstock
12. Philadelphia, PA
- Percentage of renters who haven’t moved in 20+ years: 5.9%
- Percentage of renters who haven’t moved in 10+ years: 16.2%
- Percentage of households that rent: 47.7%
- Total renter households: 295,783
- Median monthly housing costs for renters: $1,079
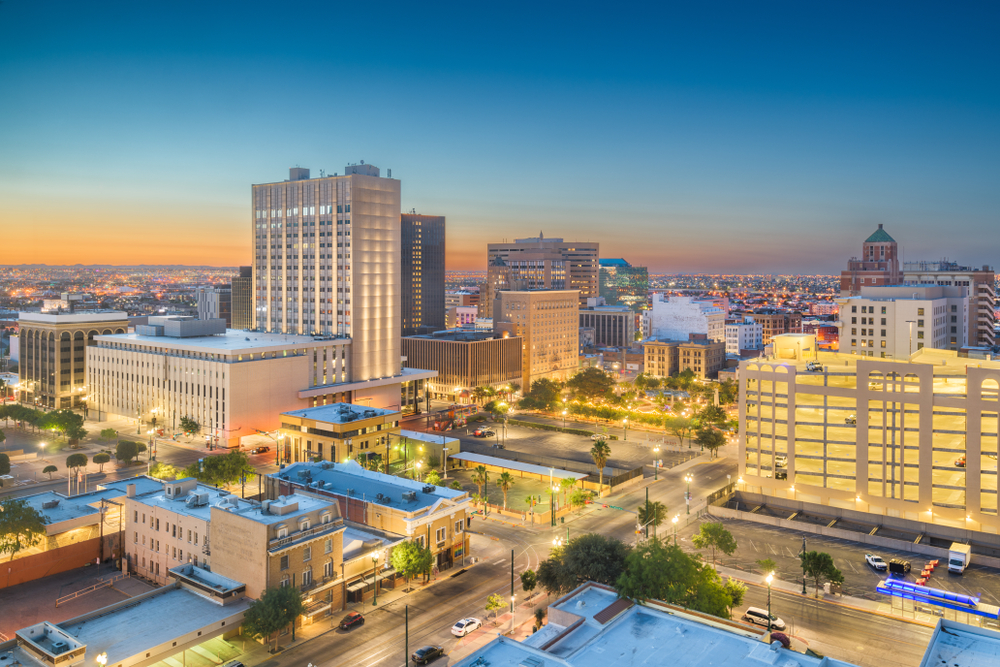
Photo Credit: Sean Pavone / Shutterstock
11. El Paso, TX
- Percentage of renters who haven’t moved in 20+ years: 5.9%
- Percentage of renters who haven’t moved in 10+ years: 17.6%
- Percentage of households that rent: 42.5%
- Total renter households: 94,700
- Median monthly housing costs for renters: $847

Photo Credit: Ingus Kruklitis / Shutterstock
10. Long Beach, CA
- Percentage of renters who haven’t moved in 20+ years: 6.3%
- Percentage of renters who haven’t moved in 10+ years: 19.8%
- Percentage of households that rent: 60.8%
- Total renter households: 100,745
- Median monthly housing costs for renters: $1,460

Photo Credit: f11photo / Shutterstock
9. Washington, DC
- Percentage of renters who haven’t moved in 20+ years: 6.8%
- Percentage of renters who haven’t moved in 10+ years: 17.2%
- Percentage of households that rent: 58.5%
- Total renter households: 170,582
- Median monthly housing costs for renters: $1,603

Photo Credit: f11photo / Shutterstock
8. Detroit, MI
- Percentage of renters who haven’t moved in 20+ years: 6.8%
- Percentage of renters who haven’t moved in 10+ years: 17.6%
- Percentage of households that rent: 52.2%
- Total renter households: 139,338
- Median monthly housing costs for renters: $866

Photo Credit: Oleg Podzorov / Shutterstock
7. Chicago, IL
- Percentage of renters who haven’t moved in 20+ years: 7.0%
- Percentage of renters who haven’t moved in 10+ years: 19.7%
- Percentage of households that rent: 55.8%
- Total renter households: 603,352
- Median monthly housing costs for renters: $1,134

Photo Credit: f11photo / Shutterstock
6. Cleveland, OH
- Percentage of renters who haven’t moved in 20+ years: 7.4%
- Percentage of renters who haven’t moved in 10+ years: 19.8%
- Percentage of households that rent: 60.0%
- Total renter households: 102,925
- Median monthly housing costs for renters: $725
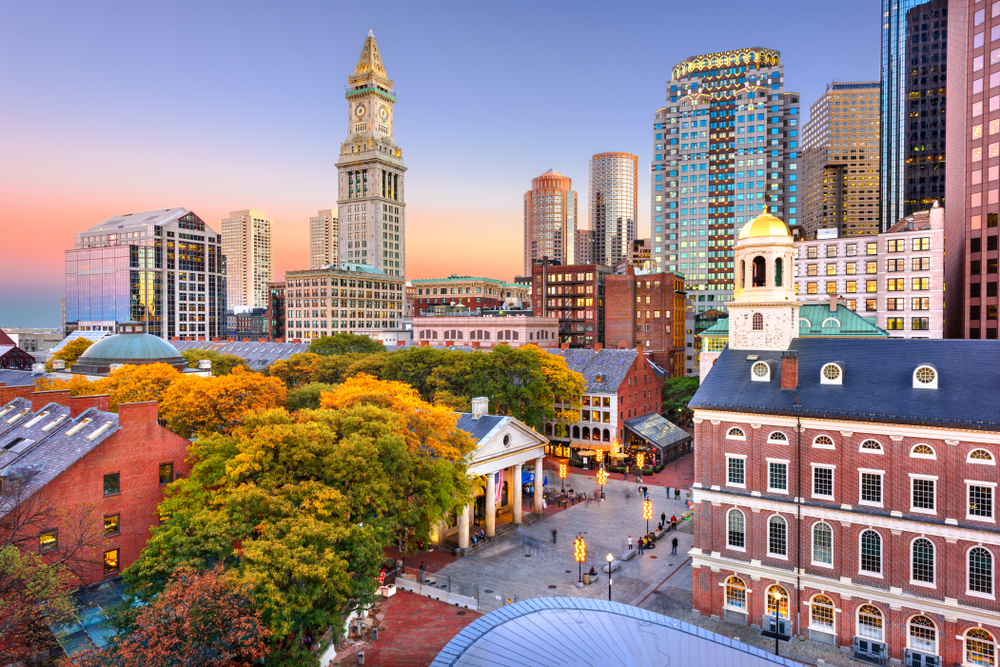
Photo Credit: Sean Pavone / Shutterstock
5. Boston, MA
- Percentage of renters who haven’t moved in 20+ years: 7.5%
- Percentage of renters who haven’t moved in 10+ years: 22.8%
- Percentage of households that rent: 65.3%
- Total renter households: 177,351
- Median monthly housing costs for renters: $1,735

Photo Credit: yhelfman / Shutterstock
4. Oakland, CA
- Percentage of renters who haven’t moved in 20+ years: 9.4%
- Percentage of renters who haven’t moved in 10+ years: 25.4%
- Percentage of households that rent: 58.7%
- Total renter households: 98,857
- Median monthly housing costs for renters: $1,600

Photo Credit: Chones / Shutterstock
3. Los Angeles, CA
- Percentage of renters who haven’t moved in 20+ years: 11.0%
- Percentage of renters who haven’t moved in 10+ years: 27.4%
- Percentage of households that rent: 63.5%
- Total renter households: 887,785
- Median monthly housing costs for renters: $1,554

Photo Credit: Bogdan Vacarciuc / Shutterstock
2. San Francisco, CA
- Percentage of renters who haven’t moved in 20+ years: 14.9%
- Percentage of renters who haven’t moved in 10+ years: 33.3%
- Percentage of households that rent: 62.9%
- Total renter households: 229,999
- Median monthly housing costs for renters: $1,959

Photo Credit: Sean Pavone / Shutterstock
1. New York, NY
- Percentage of renters who haven’t moved in 20+ years: 20.4%
- Percentage of renters who haven’t moved in 10+ years: 39.3%
- Percentage of households that rent: 68.1%
- Total renter households: 2,188,214
- Median monthly housing costs for renters: $1,483
Detailed Findings & Methodology
To find the cities where renters never move, researchers at Construction Coverage analyzed the latest data from the U.S. Census Bureau’s 2019 American Community Survey. The researchers ranked cities according to the percentage of renters who haven’t moved in 20 years or more. Researchers also calculated the percentage of renters who haven’t moved in 10 years or more, the percentage of households that rent, the total number of renter households, and median monthly housing costs for renters.
To improve relevance, only cities with at least 100,000 people were included in the analysis. Additionally, cities were grouped into the following cohorts based on population size:
- Small cities: 100,000-149,999
- Midsize cities: 150,000-349,999
- Large cities: 350,000 or more