
U.S. Cities With the Most Mortgage Delinquencies During the Great Recession
More than 18 months into the COVID-19 pandemic, much about the pandemic-era economy remains unusual and difficult to analyze. From a labor market that has both worker shortages and high unemployment to supply chain breakdowns and inflation fears, it has been a challenge to assess the true state of the economy and what it might mean for the next few years.
This confusion has extended to the real estate market, one of the most noteworthy economic stories of the pandemic. Demand reached new peaks with more millennials reaching home buying age, generous government stimulus, strong savings rates and market returns, and a premium on living space with more people socially distancing and working from home. But this demand has not been met with a commensurate increase in supply, which has sent housing prices to record heights.
What remains to be seen is whether these increases represent a new normal or a real estate bubble. With prices rising so rapidly, some observers fear that houses are overvalued and that if the bubble bursts, the economy could see a prolonged recession as happened in the mid- to late 2000s.
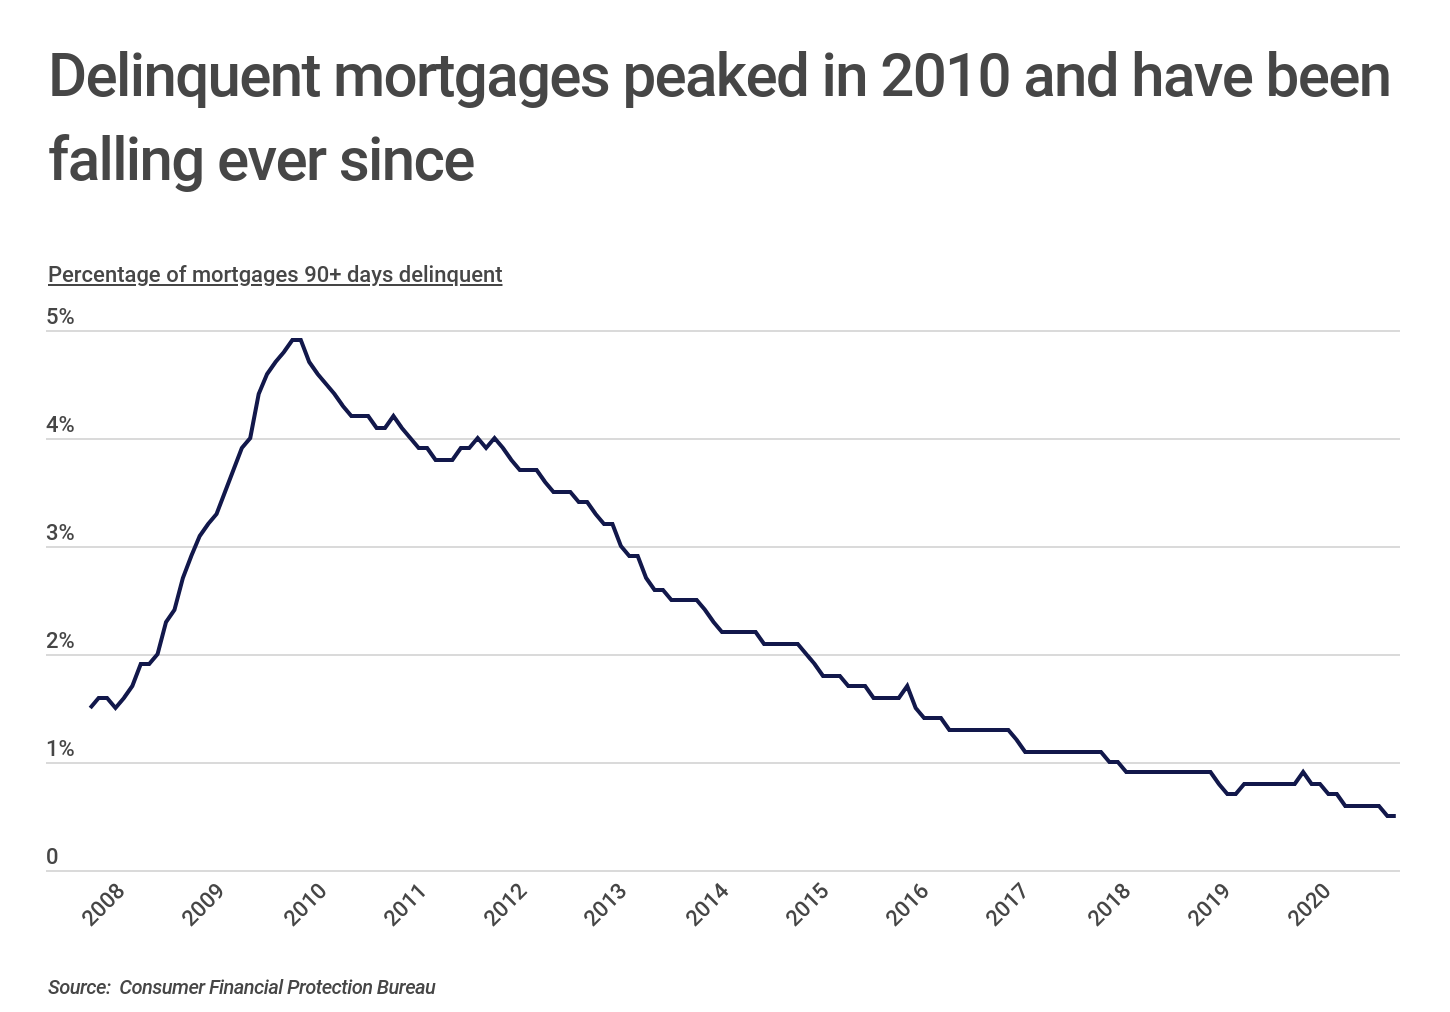
Two decades ago, the housing market was experiencing a similarly dramatic surge in prices. However, many homeowners were being approved for mortgages that were beyond their actual means. When prices began to fall, these homeowners found themselves financially underwater, leading to increased mortgage delinquency rates and foreclosures. This in turn set off the financial crisis and the Great Recession. During the worst of the recession in 2010, the rate of residential mortgages that were delinquent by more than 90 days reached 4.9%, and it took more than five years for that rate to return to pre-recession levels.
Concerns about price increases in the housing market are understandable given how the Great Recession unfolded. Further, the recent expiration of federal housing relief programs like mortgage forbearance and the federal eviction moratorium only add more uncertainty to the future of the market.
But there are some indications that the current circumstances in the housing market are fundamentally different from what they were in the last housing boom. For one, the trend of price increases in the current boom is shorter, whereas in the last bubble, prices rose by double digit percentages for multiple years. For another, the supply of homes is a much greater issue now than in the 2000s, when more new homes were being built as prices were rising, so cooling demand or new stock coming on the market could level out the current increases.
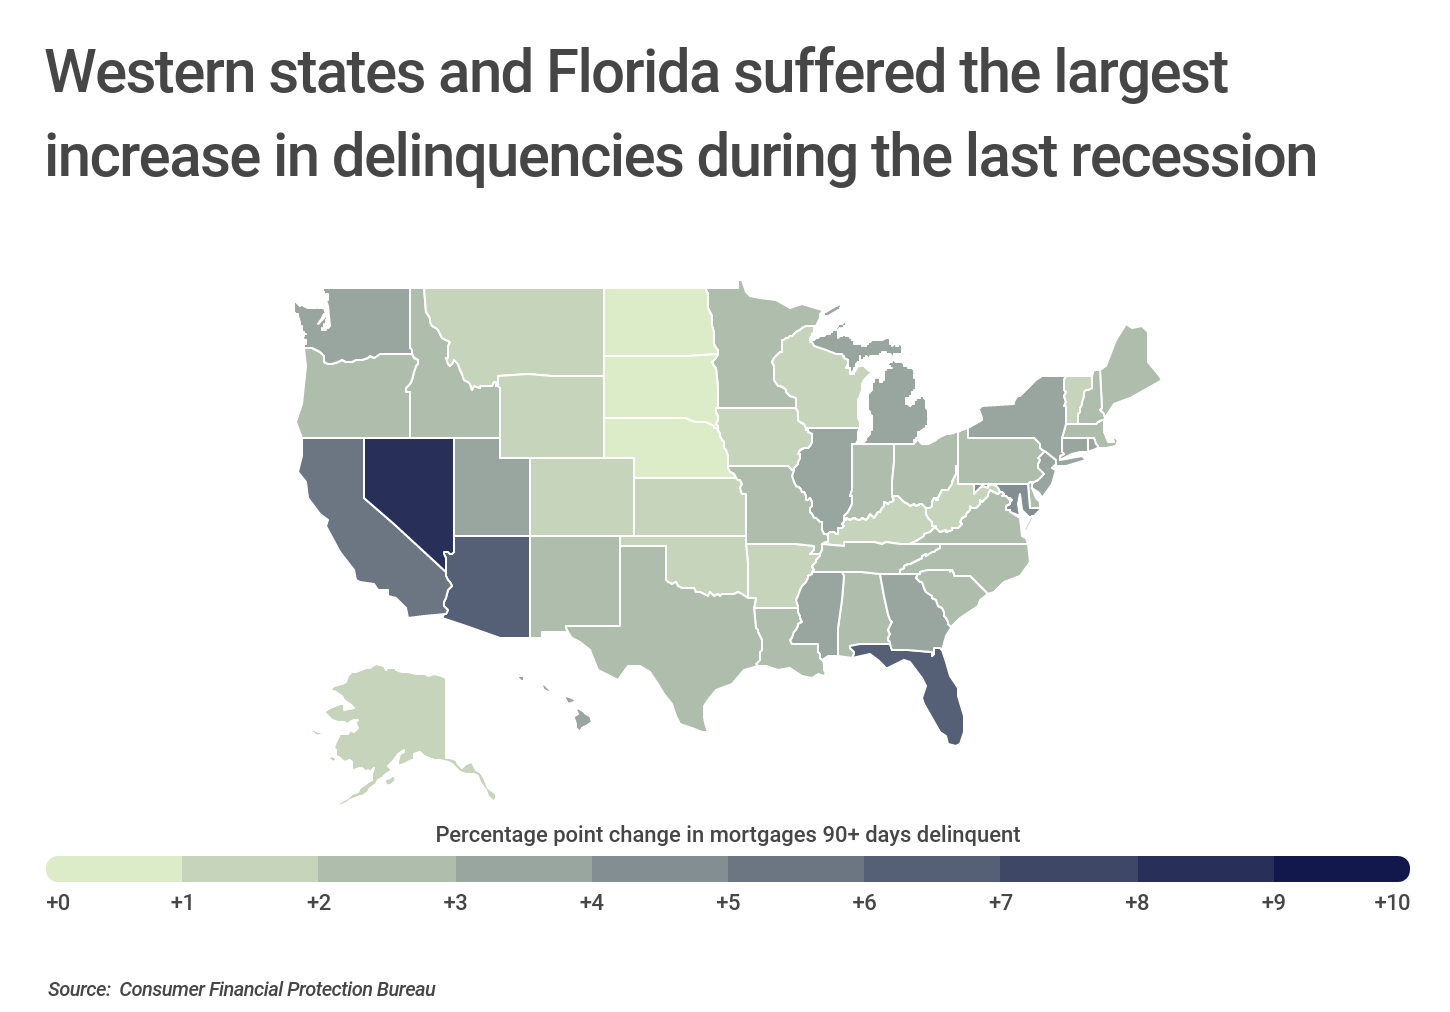
Another major difference is where the price increases have taken place. In the current boom, home price increases appear to be more consistent, whereas in the pre-Great Recession bubble, many of the most significant price increases were concentrated in Sun Belt states like Nevada, Arizona, California, and Florida, driven by demand from migration and speculation about continued growth in these markets. These states ended up bearing the worst effects of the subprime mortgage crisis, with mortgage delinquency rates far exceeding other parts of the country.
RELATED
One of the most common causes of missing mortgage payments is a job loss or decrease in earnings, which depending on the industry is often the result of an illness or injury occurring on the job. Homeowners should make sure their employers carry adequate workers’ compensation insurance benefits to cover them—and their families—in these situations.
Urban areas were particularly hard hit during the last recession as well, but in the current boom, urban areas are actually seeing slower price growth than suburban and rural areas. And mortgage delinquency rates in many of these areas are much lower now than they were at the outset of the Great Recession.
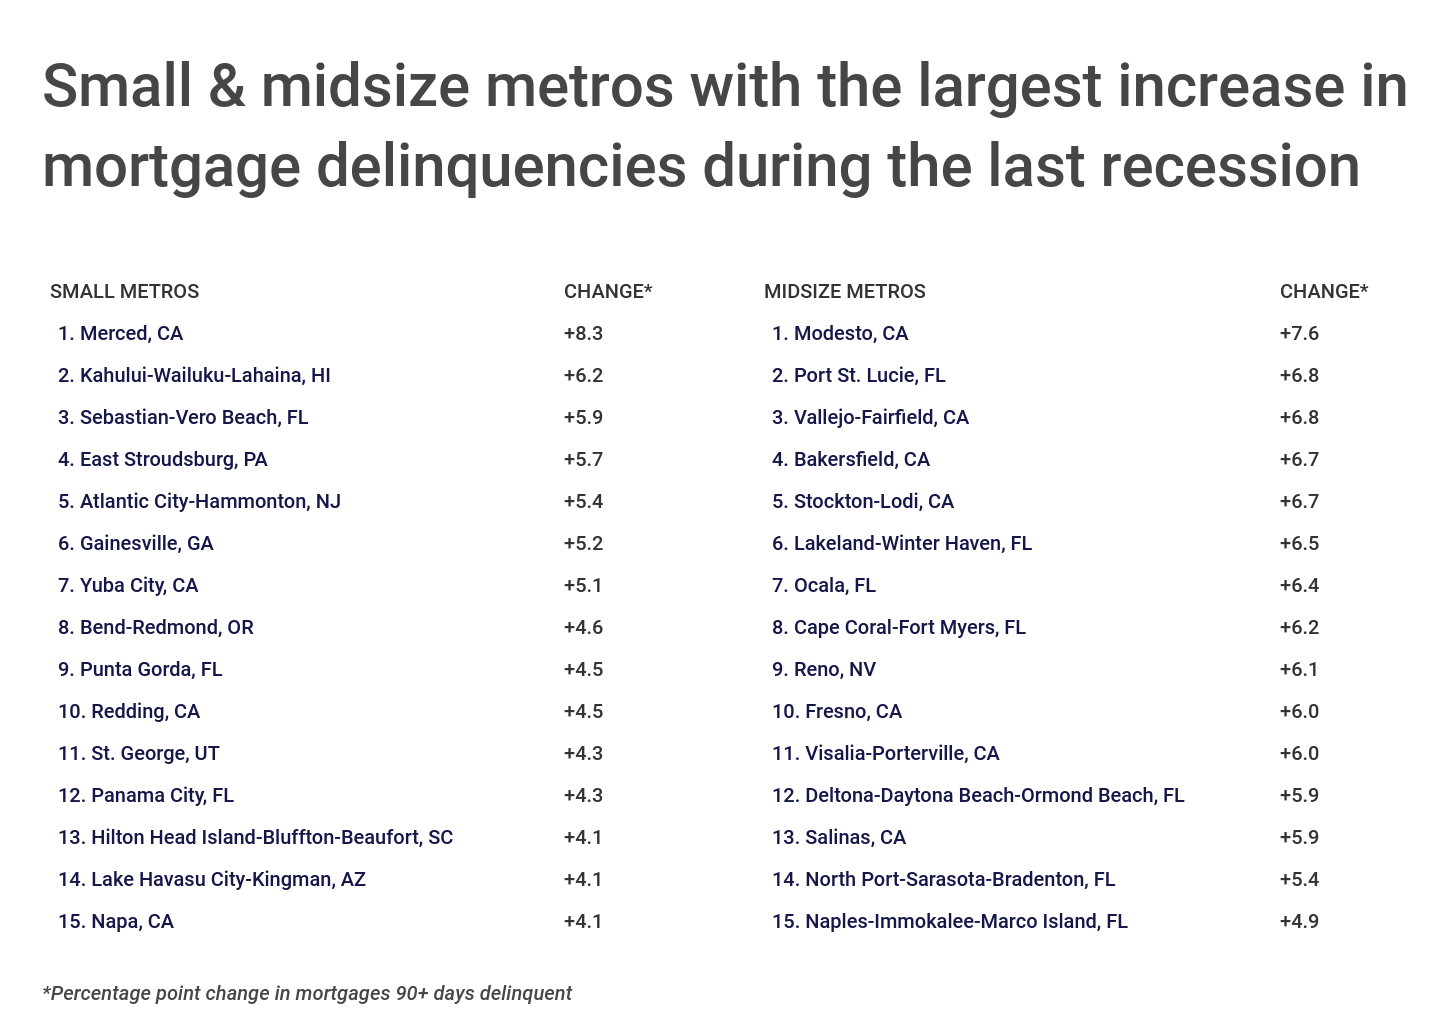
To identify locations with the biggest increase in mortgage delinquencies during the Great Recession, researchers at Construction Coverage used data from the Consumer Financial Protection Bureau and calculated the percentage-point difference in delinquency rates between January 2008 and January 2010. Researchers also included current delinquency rates, as well as home prices from Zillow.
Here are the U.S. metropolitan areas with the biggest increase in mortgage delinquencies during the last recession.
Large Metros With the Most Mortgage Delinquencies During the Great Recession

Photo Credit: Brian Goodman / Shutterstock
15. New York-Newark-Jersey City, NY-NJ-PA
- Percentage point change in mortgages 90+ days delinquent: +3.9
- Percentage of mortgages 90+ days delinquent (2010): 5.2%
- Percentage of mortgages 90+ days delinquent (2008): 1.3%
- Percentage of mortgages 90+ days delinquent (2020): 0.8%
- Median house value: $552,607

Photo Credit: Pete Niesen / Shutterstock
14. San Francisco-Oakland-Hayward, CA
- Percentage point change in mortgages 90+ days delinquent: +4.1
- Percentage of mortgages 90+ days delinquent (2010): 5.4%
- Percentage of mortgages 90+ days delinquent (2008): 1.3%
- Percentage of mortgages 90+ days delinquent (2020): 0.2%
- Median house value: $1,324,433

Photo Credit: Andrei Medvedev / Shutterstock
13. Washington-Arlington-Alexandria, DC-VA-MD-WV
- Percentage point change in mortgages 90+ days delinquent: +4.1
- Percentage of mortgages 90+ days delinquent (2010): 5.6%
- Percentage of mortgages 90+ days delinquent (2008): 1.5%
- Percentage of mortgages 90+ days delinquent (2020): 0.5%
- Median house value: $512,936
FOR CONSTRUCTION PROFESSIONALS
Did you know that personal auto insurance generally won’t cover you when using your car for business purposes? If you regularly drive your vehicle for work, make sure to have commercial car insurance or a more tailored commercial truck insurance policy so that you’re covered in the event of an accident.

Photo Credit: Lucky-photographer / Shutterstock
12. San Diego-Carlsbad, CA
- Percentage point change in mortgages 90+ days delinquent: +4.4
- Percentage of mortgages 90+ days delinquent (2010): 6.1%
- Percentage of mortgages 90+ days delinquent (2008): 1.7%
- Percentage of mortgages 90+ days delinquent (2020): 0.2%
- Median house value: $792,531

Photo Credit: Luciano Mortula – LGM / Shutterstock
11. Atlanta-Sandy Springs-Roswell, GA
- Percentage point change in mortgages 90+ days delinquent: +4.5
- Percentage of mortgages 90+ days delinquent (2010): 6.8%
- Percentage of mortgages 90+ days delinquent (2008): 2.3%
- Percentage of mortgages 90+ days delinquent (2020): 0.5%
- Median house value: $301,104

Photo Credit: wonderlustpicstravel / Shutterstock
10. Chicago-Naperville-Elgin, IL-IN-WI
- Percentage point change in mortgages 90+ days delinquent: +4.5
- Percentage of mortgages 90+ days delinquent (2010): 6.0%
- Percentage of mortgages 90+ days delinquent (2008): 1.5%
- Percentage of mortgages 90+ days delinquent (2020): 0.7%
- Median house value: $280,130

Photo Credit: Ramunas Bruzas / Shutterstock
9. Jacksonville, FL
- Percentage point change in mortgages 90+ days delinquent: +4.6
- Percentage of mortgages 90+ days delinquent (2010): 6.6%
- Percentage of mortgages 90+ days delinquent (2008): 2.0%
- Percentage of mortgages 90+ days delinquent (2020): 0.6%
- Median house value: $287,139

Photo Credit: Andriy Blokhin / Shutterstock
8. Sacramento–Roseville–Arden-Arcade, CA
- Percentage point change in mortgages 90+ days delinquent: +5.1
- Percentage of mortgages 90+ days delinquent (2010): 7.2%
- Percentage of mortgages 90+ days delinquent (2008): 2.1%
- Percentage of mortgages 90+ days delinquent (2020): 0.3%
- Median house value: $540,438
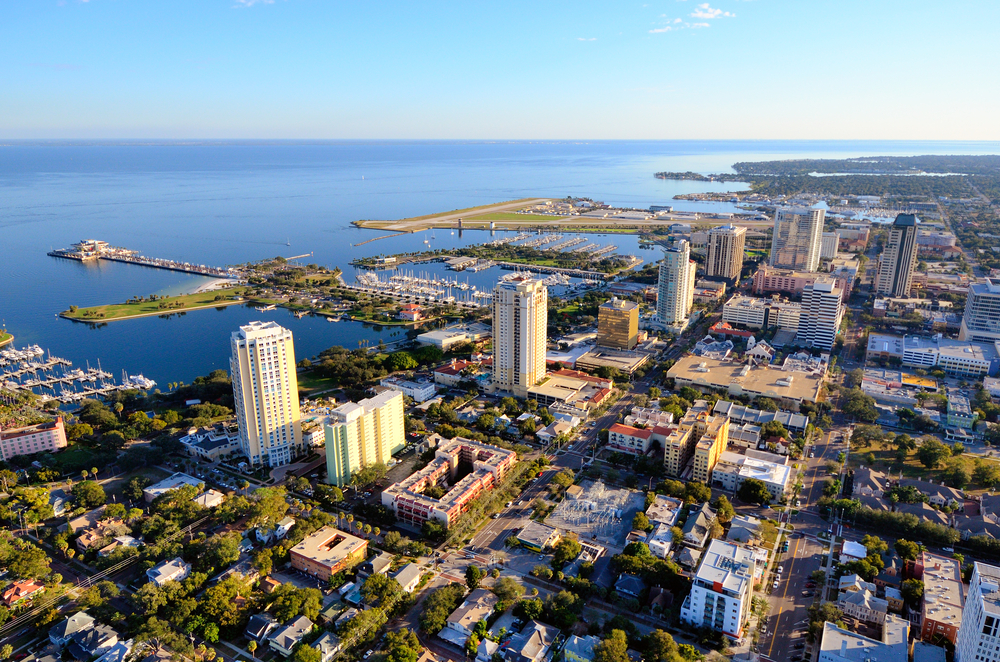
Photo Credit: ESB Professional / Shutterstock
7. Tampa-St. Petersburg-Clearwater, FL
- Percentage point change in mortgages 90+ days delinquent: +5.4
- Percentage of mortgages 90+ days delinquent (2010): 7.6%
- Percentage of mortgages 90+ days delinquent (2008): 2.2%
- Percentage of mortgages 90+ days delinquent (2020): 0.6%
- Median house value: $295,532

Photo Credit: Chones / Shutterstock
6. Los Angeles-Long Beach-Anaheim, CA
- Percentage point change in mortgages 90+ days delinquent: +6.0
- Percentage of mortgages 90+ days delinquent (2010): 7.6%
- Percentage of mortgages 90+ days delinquent (2008): 1.6%
- Percentage of mortgages 90+ days delinquent (2020): 0.3%
- Median house value: $831,593

Photo Credit: Gregory E. Clifford / Shutterstock
5. Phoenix-Mesa-Scottsdale, AZ
- Percentage point change in mortgages 90+ days delinquent: +7.0
- Percentage of mortgages 90+ days delinquent (2010): 8.8%
- Percentage of mortgages 90+ days delinquent (2008): 1.8%
- Percentage of mortgages 90+ days delinquent (2020): 0.3%
- Median house value: $390,733

Photo Credit: Songquan Deng / Shutterstock
4. Orlando-Kissimmee-Sanford, FL
- Percentage point change in mortgages 90+ days delinquent: +7.7
- Percentage of mortgages 90+ days delinquent (2010): 10.2%
- Percentage of mortgages 90+ days delinquent (2008): 2.5%
- Percentage of mortgages 90+ days delinquent (2020): 0.6%
- Median house value: $307,048

Photo Credit: Jon Bilous / Shutterstock
3. Riverside-San Bernardino-Ontario, CA
- Percentage point change in mortgages 90+ days delinquent: +8.5
- Percentage of mortgages 90+ days delinquent (2010): 11.5%
- Percentage of mortgages 90+ days delinquent (2008): 3.0%
- Percentage of mortgages 90+ days delinquent (2020): 0.4%
- Median house value: $495,619

Photo Credit: Just dance / Shutterstock
2. Miami-Fort Lauderdale-West Palm Beach, FL
- Percentage point change in mortgages 90+ days delinquent: +8.7
- Percentage of mortgages 90+ days delinquent (2010): 11.6%
- Percentage of mortgages 90+ days delinquent (2008): 2.9%
- Percentage of mortgages 90+ days delinquent (2020): 0.6%
- Median house value: $355,793
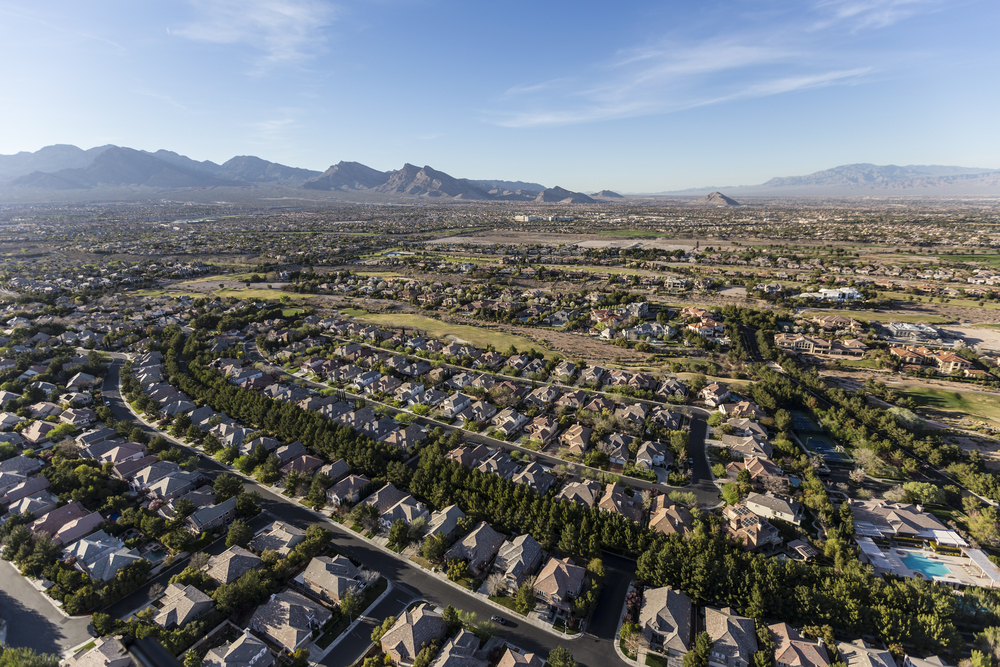
Photo Credit: trekandshoot / Shutterstock
1. Las Vegas-Henderson-Paradise, NV
- Percentage point change in mortgages 90+ days delinquent: +9.4
- Percentage of mortgages 90+ days delinquent (2010): 12.2%
- Percentage of mortgages 90+ days delinquent (2008): 2.8%
- Percentage of mortgages 90+ days delinquent (2020): 0.4%
- Median house value: $360,345
Methodology & Detailed Findings
Data on the portion of mortgages at least 90 days delinquent are from the Consumer Financial Protection Bureau’s National Mortgage Database, while data on median home values are from Zillow’s Zillow Home Value Index. To identify locations with the biggest increase in mortgage delinquencies during the Great Recession, researchers calculated the percentage-point difference in delinquency rates between January 2008 and January 2010. To improve relevance, only locations with at least 100,000 residents were included. Additionally, locations were grouped into cohorts based on population size: small (100,000-349,999), midsize (350,000-999,999), and large (1,000,000 or more).