
U.S. Cities With the Most Minorities Behind on Their Rent [2022 Edition]
While much of the economy has fared better than expected during the COVID-19 pandemic, racial and ethnic minorities have faced enormous challenges over the past two years.
Entering the pandemic, non-white households were more likely to be poor and to work in professions that would increase their risk of exposure to COVID-19 and their risk of unemployment during the pandemic. When COVID-19 hit, non-white households faced greater economic hardship, with less certainty about their ability to pay for essential expenses like food and housing. Now, with inflation on the rise, prices for food, energy, transportation, and housing are taking a disparate toll on non-white households: a recent Wall Street Journal poll found that 35% of minority respondents were experiencing inflationary pain, compared to 28% of white respondents.
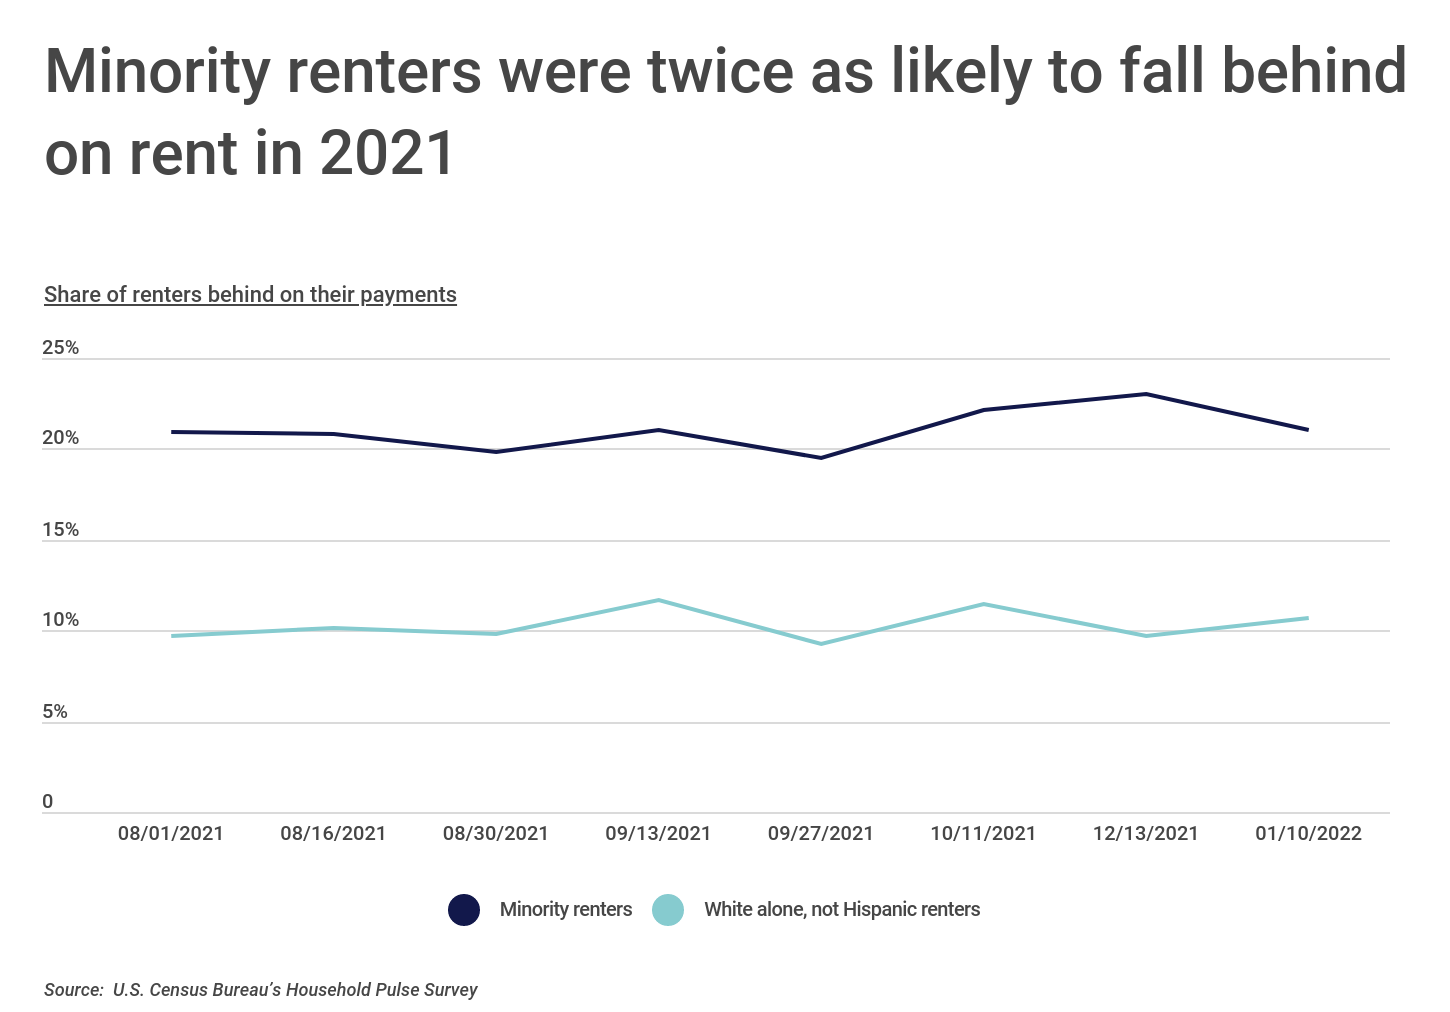
These conditions have combined to make it more difficult for racial and ethnic minorities to keep up with major household expenses. One of the most significant of those expenses is rent. According to survey data from the U.S. Census Bureau, racial and ethnic minority renters have struggled much more than their white counterparts to keep up with their regular rent payments. Minorities were around twice as likely to report being behind on rent payments as white renters over the second half of 2021 and beginning of 2022. Around one in five minority renters reported being behind on payments, compared to just one in 10 white renters.
FOR OWNERS
If you own a building with rental units, make sure to have an appropriate amount of commercial property insurance coverage. This, and other forms of business insurance, will provide financial protection in the event of a liability-related incident.
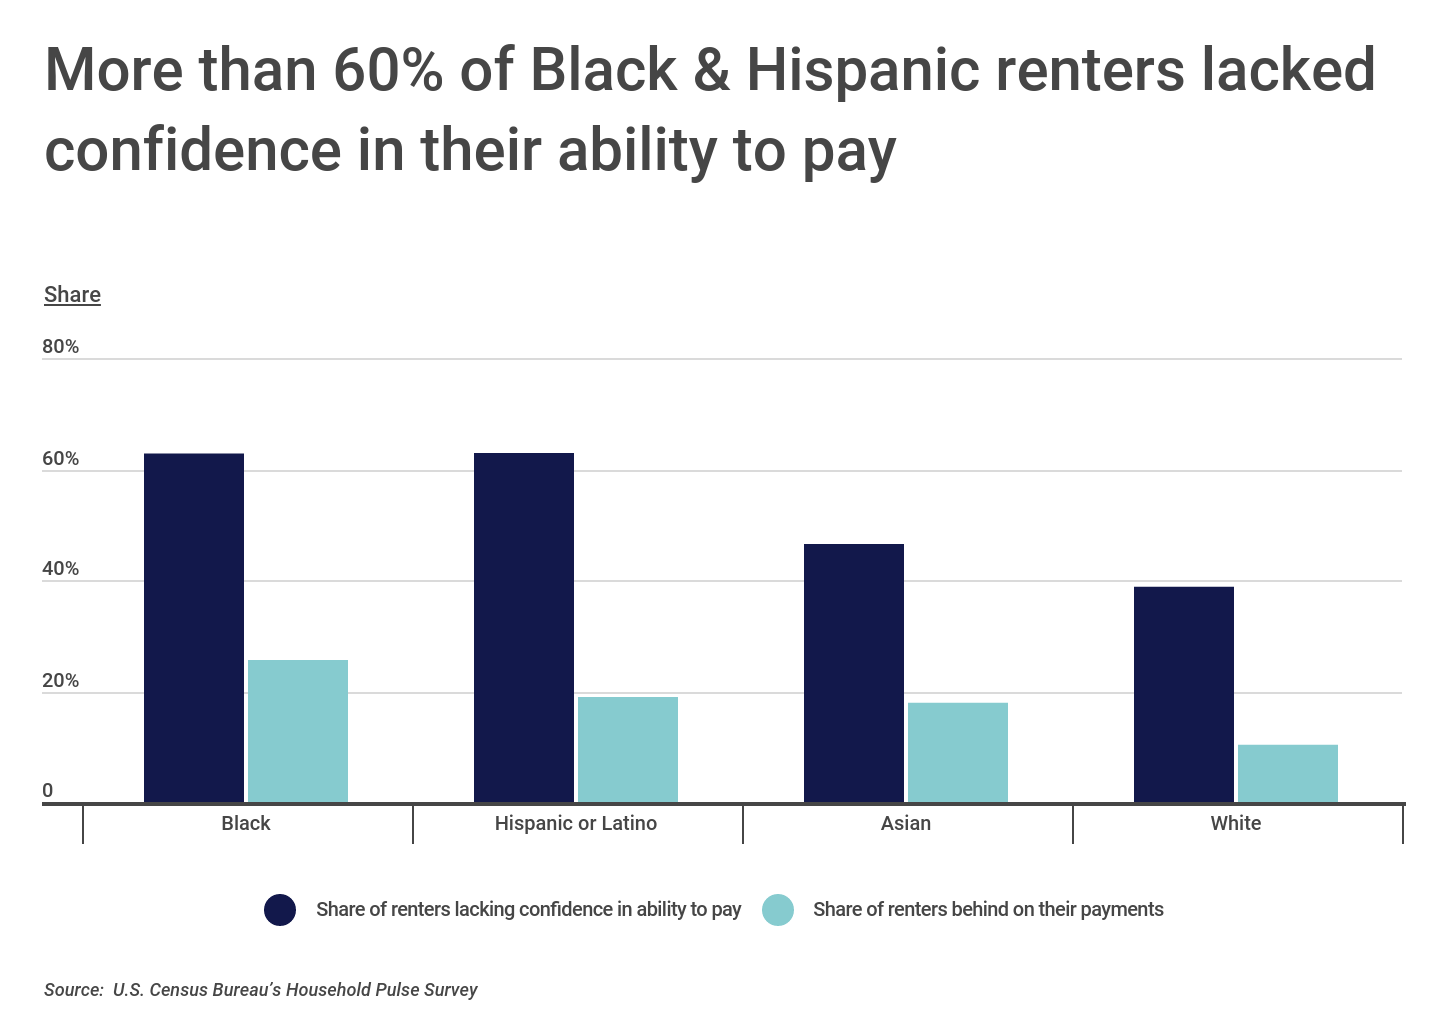
These disparities are also apparent in different groups’ confidence in their ability to pay rent. In recent months, 38.8% of white renters have expressed a lack of confidence in their ability to pay rent, compared to 46.5% of Asian renters, 62.8% of Black renters, and 62.9% of Hispanic or Latino renters. But there are also gaps between racial and ethnic minority categories in terms of ability to pay rent. Despite having similar rates of confidence in the ability to pay rent, 25.6% of Black renters are behind on payments compared to 18.9% of Hispanic or Latino renters.
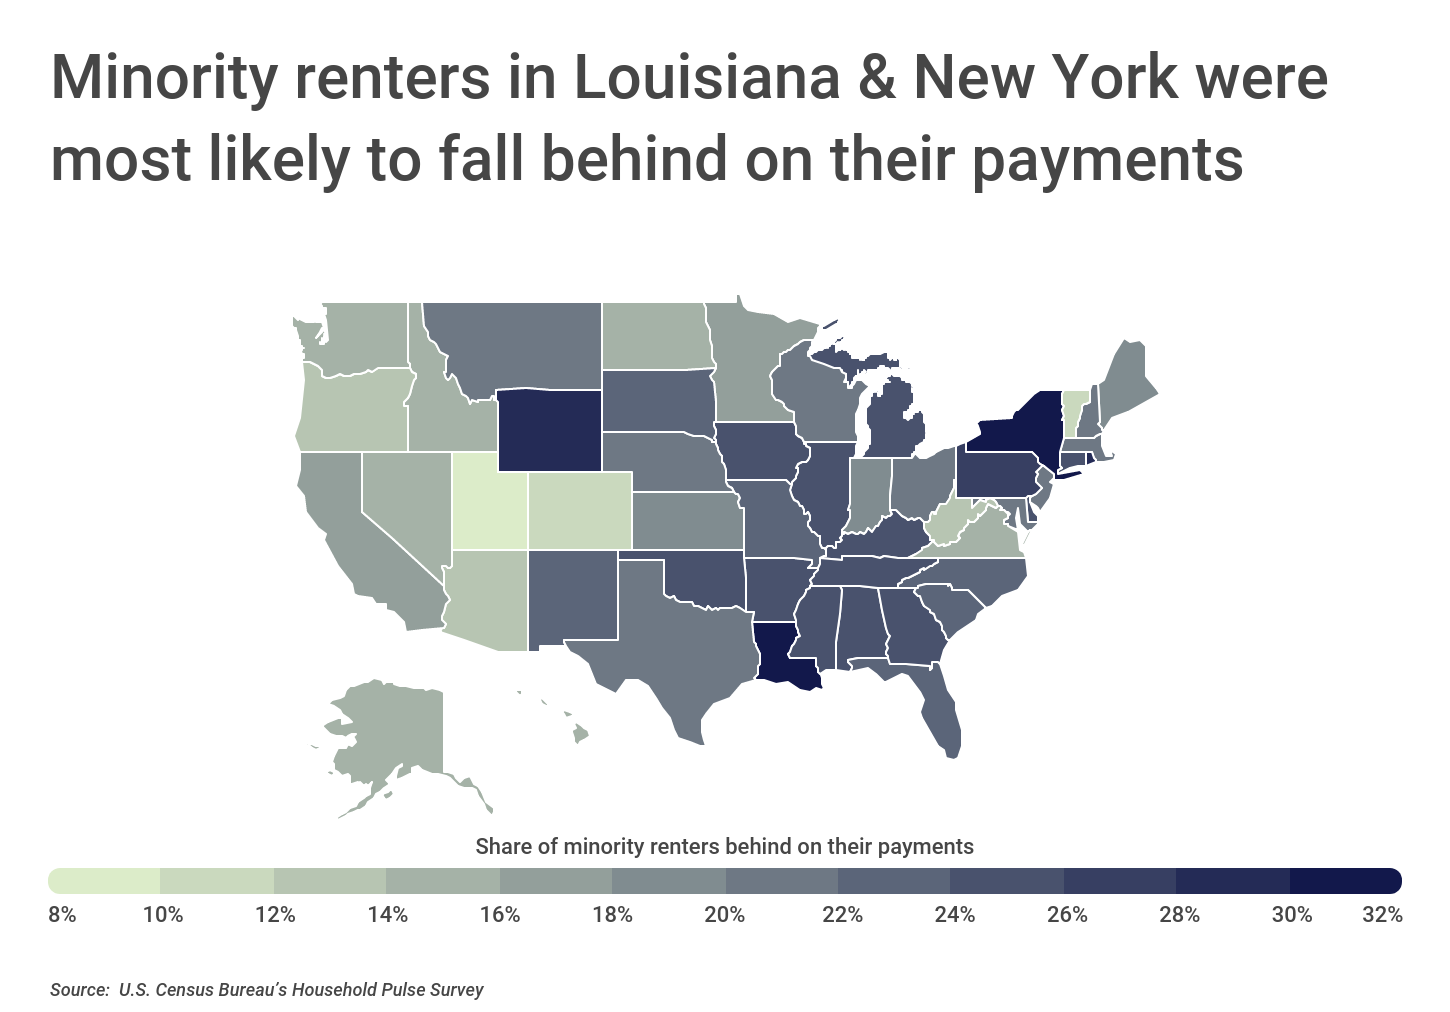
Interestingly, minority groups’ struggles with rent vary substantially across states. Some states with small non-white populations, like Vermont, Utah, and West Virginia, have lower shares of minorities behind on rent payments, but more diverse states like Arizona and Nevada also have fairly low figures. And the list of states with the most minority renters behind on rent includes both lower-cost states like Louisiana and Wyoming and expensive states like New York.
RELATED
Software has dramatically changed what it means to run a real estate or construction business. For property managers and building owners, property management software makes it easy to communicate with tenants, collect payments, and pay bills. For construction businesses, job costing software does the same with regards to contractors and customers.
At the metro level, however, diverse cities with higher housing costs appear to be areas where minority renters are most at risk of falling behind on their payments. This could quickly become a widespread crisis in many cities with high populations of renters, especially from minority backgrounds. For example, nearly one in three minority renters was behind on rent payments in 2021 in New York City—a location with one of the highest shares of renters of any city, and where minorities are much more likely to rent than white residents. In New York and other cities where minority renters are struggling, hundreds of thousands of residents could be at risk of losing their housing.
The data used in this analysis is from the U.S. Census Bureau’s Household Pulse Survey. To determine the locations with the most minorities behind on their rent, researchers at Construction Coverage calculated the share of minority renters who were not current on their payments in the second half of 2021 for all available U.S. metropolitan areas and states. Minority renters were those defined as non-Hispanic white.
Here are the major U.S. metropolitan areas with the most minorities behind on their rent.
Major Metros With the Most Minorities Behind on Rent

Photo Credit: Harold Stiver / Shutterstock
15. Phoenix-Mesa-Chandler, AZ
- Share of minority renters behind on their payments: 13.4%
- Share of minority renters lacking confidence in ability to pay: 55.4%
- Share of minority renters facing likelihood of eviction: 46.1%
- Total minority renters behind on their payments: 61,237
- Total minority renters lacking confidence in ability to pay: 253,117
- Total minority renters facing likelihood of eviction: 27,612
TRENDING
If you are moving to a new apartment or home, make sure your moving company is adequately insured. Commercial trucking insurance policies not only cover the vehicle, but also your belongings while in transit.

Photo Credit: Jeff Hollis / Shutterstock
14. Seattle-Tacoma-Bellevue, WA
- Share of minority renters behind on their payments: 14.8%
- Share of minority renters lacking confidence in ability to pay: 47.4%
- Share of minority renters facing likelihood of eviction: 41.0%
- Total minority renters behind on their payments: 53,479
- Total minority renters lacking confidence in ability to pay: 170,078
- Total minority renters facing likelihood of eviction: 21,119

Photo Credit: Radoslaw Lecyk / Shutterstock
13. San Francisco-Oakland-Berkeley, CA
- Share of minority renters behind on their payments: 15.0%
- Share of minority renters lacking confidence in ability to pay: 55.1%
- Share of minority renters facing likelihood of eviction: 39.2%
- Total minority renters behind on their payments: 104,406
- Total minority renters lacking confidence in ability to pay: 382,769
- Total minority renters facing likelihood of eviction: 35,613

Photo Credit: Matt Gush / Shutterstock
12. Riverside-San Bernardino-Ontario, CA
- Share of minority renters behind on their payments: 17.4%
- Share of minority renters lacking confidence in ability to pay: 64.9%
- Share of minority renters facing likelihood of eviction: 52.2%
- Total minority renters behind on their payments: 118,164
- Total minority renters lacking confidence in ability to pay: 440,054
- Total minority renters facing likelihood of eviction: 58,139

Photo Credit: Hayk Shalunts / Shutterstock
11. Los Angeles-Long Beach-Anaheim, CA
- Share of minority renters behind on their payments: 17.5%
- Share of minority renters lacking confidence in ability to pay: 60.2%
- Share of minority renters facing likelihood of eviction: 40.3%
- Total minority renters behind on their payments: 441,569
- Total minority renters lacking confidence in ability to pay: 1,513,220
- Total minority renters facing likelihood of eviction: 171,667

Photo Credit: Trong Nguyen / Shutterstock
10. Dallas-Fort Worth-Arlington, TX
- Share of minority renters behind on their payments: 19.0%
- Share of minority renters lacking confidence in ability to pay: 59.3%
- Share of minority renters facing likelihood of eviction: 39.9%
- Total minority renters behind on their payments: 152,980
- Total minority renters lacking confidence in ability to pay: 474,953
- Total minority renters facing likelihood of eviction: 59,785

Photo Credit: A G Baxter / Shutterstock
9. Washington-Arlington-Alexandria, DC-VA-MD-WV
- Share of minority renters behind on their payments: 19.1%
- Share of minority renters lacking confidence in ability to pay: 54.0%
- Share of minority renters facing likelihood of eviction: 49.2%
- Total minority renters behind on their payments: 112,948
- Total minority renters lacking confidence in ability to pay: 317,972
- Total minority renters facing likelihood of eviction: 53,493

Photo Credit: Jon Bilous / Shutterstock
8. Boston-Cambridge-Newton, MA-NH
- Share of minority renters behind on their payments: 19.7%
- Share of minority renters lacking confidence in ability to pay: 53.5%
- Share of minority renters facing likelihood of eviction: 35.0%
- Total minority renters behind on their payments: 63,767
- Total minority renters lacking confidence in ability to pay: 172,628
- Total minority renters facing likelihood of eviction: 20,353

Photo Credit: Luciano Mortula – LGM / Shutterstock
7. Atlanta-Sandy Springs-Alpharetta, GA
- Share of minority renters behind on their payments: 22.5%
- Share of minority renters lacking confidence in ability to pay: 58.1%
- Share of minority renters facing likelihood of eviction: 49.3%
- Total minority renters behind on their payments: 140,810
- Total minority renters lacking confidence in ability to pay: 361,134
- Total minority renters facing likelihood of eviction: 67,178

Photo Credit: photosounds / Shutterstock
6. Philadelphia-Camden-Wilmington, PA-NJ-DE-MD
- Share of minority renters behind on their payments: 22.6%
- Share of minority renters lacking confidence in ability to pay: 63.7%
- Share of minority renters facing likelihood of eviction: 54.6%
- Total minority renters behind on their payments: 102,058
- Total minority renters lacking confidence in ability to pay: 285,436
- Total minority renters facing likelihood of eviction: 53,288

Photo Credit: Jonathan Siegel / Shutterstock
5. Chicago-Naperville-Elgin, IL-IN-WI
- Share of minority renters behind on their payments: 23.8%
- Share of minority renters lacking confidence in ability to pay: 61.8%
- Share of minority renters facing likelihood of eviction: 44.5%
- Total minority renters behind on their payments: 176,922
- Total minority renters lacking confidence in ability to pay: 455,551
- Total minority renters facing likelihood of eviction: 77,545
Photo Credit: Galina Savina / Shutterstock
4. Miami-Fort Lauderdale-Pompano Beach, FL
- Share of minority renters behind on their payments: 24.0%
- Share of minority renters lacking confidence in ability to pay: 64.6%
- Share of minority renters facing likelihood of eviction: 42.8%
- Total minority renters behind on their payments: 212,073
- Total minority renters lacking confidence in ability to pay: 570,373
- Total minority renters facing likelihood of eviction: 86,464

Photo Credit: Roschetzky Photography / Shutterstock
3. Houston-The Woodlands-Sugar Land, TX
- Share of minority renters behind on their payments: 25.0%
- Share of minority renters lacking confidence in ability to pay: 67.8%
- Share of minority renters facing likelihood of eviction: 47.3%
- Total minority renters behind on their payments: 248,122
- Total minority renters lacking confidence in ability to pay: 672,149
- Total minority renters facing likelihood of eviction: 108,855
Photo Credit: Concrete Jungle Media / Shutterstock
2. Detroit-Warren-Dearborn, MI
- Share of minority renters behind on their payments: 26.0%
- Share of minority renters lacking confidence in ability to pay: 62.5%
- Share of minority renters facing likelihood of eviction: 61.2%
- Total minority renters behind on their payments: 70,285
- Total minority renters lacking confidence in ability to pay: 168,561
- Total minority renters facing likelihood of eviction: 42,122

Photo Credit: Victor Moussa / Shutterstock
1. New York-Newark-Jersey City, NY-NJ-PA
- Share of minority renters behind on their payments: 29.3%
- Share of minority renters lacking confidence in ability to pay: 65.9%
- Share of minority renters facing likelihood of eviction: 32.8%
- Total minority renters behind on their payments: 786,044
- Total minority renters lacking confidence in ability to pay: 1,725,755
- Total minority renters facing likelihood of eviction: 230,915
Detailed Findings & Methodology
The data used in this analysis is from the U.S. Census Bureau’s Household Pulse Survey. To determine the locations with the most minorities behind on their rent, researchers calculated the share of minority renters who were not current on their payments for all available U.S. metropolitan areas and states. Minority renters were those defined as non-Hispanic white. Data in this analysis is from weeks 34 through 41 of the survey, covering July 21, 2021 through January 10, 2022. All values reported are averages of the weekly values over this time period. As such, the totals do not represent cumulative numbers, but rather reflect point-in-time estimates.