
U.S. Cities With the Biggest Increase in Housing Inventory
Editor’s Note: This research report was published in 2024, and the data is no longer being updated. It has been kept live for historical reference.
The persistent shortage of housing inventory, stemming from a combination of long- and short-term factors, continues to challenge prospective homebuyers in the U.S.
Since 2022, high mortgage rates have deterred many would-be sellers from listing their properties, fearing the loss of existing low rates. Higher borrowing costs have also caused new residential construction activity to slow, resulting in fewer new units entering the housing market. At the same time, institutional investors—largely unaffected by mortgage rate fluctuations due to their cash-based transactions—have increasingly acquired a larger share of homes sold.
But the current housing shortage, which is now estimated to be between four million and seven million homes, can trace its beginnings to long before the COVID-19 pandemic. In the 10 years following the Great Recession, the United States constructed fewer new homes than in any other decade since the 1960s. Simply put, the nation has not built a sufficient number of homes—particularly in certain areas—to meet the demands of natural population growth, immigration, urbanization, and a growing number of retirees opting to age in place.
Trends in U.S. Housing Inventory
Low housing inventory continues to challenge prospective homebuyers in 2024
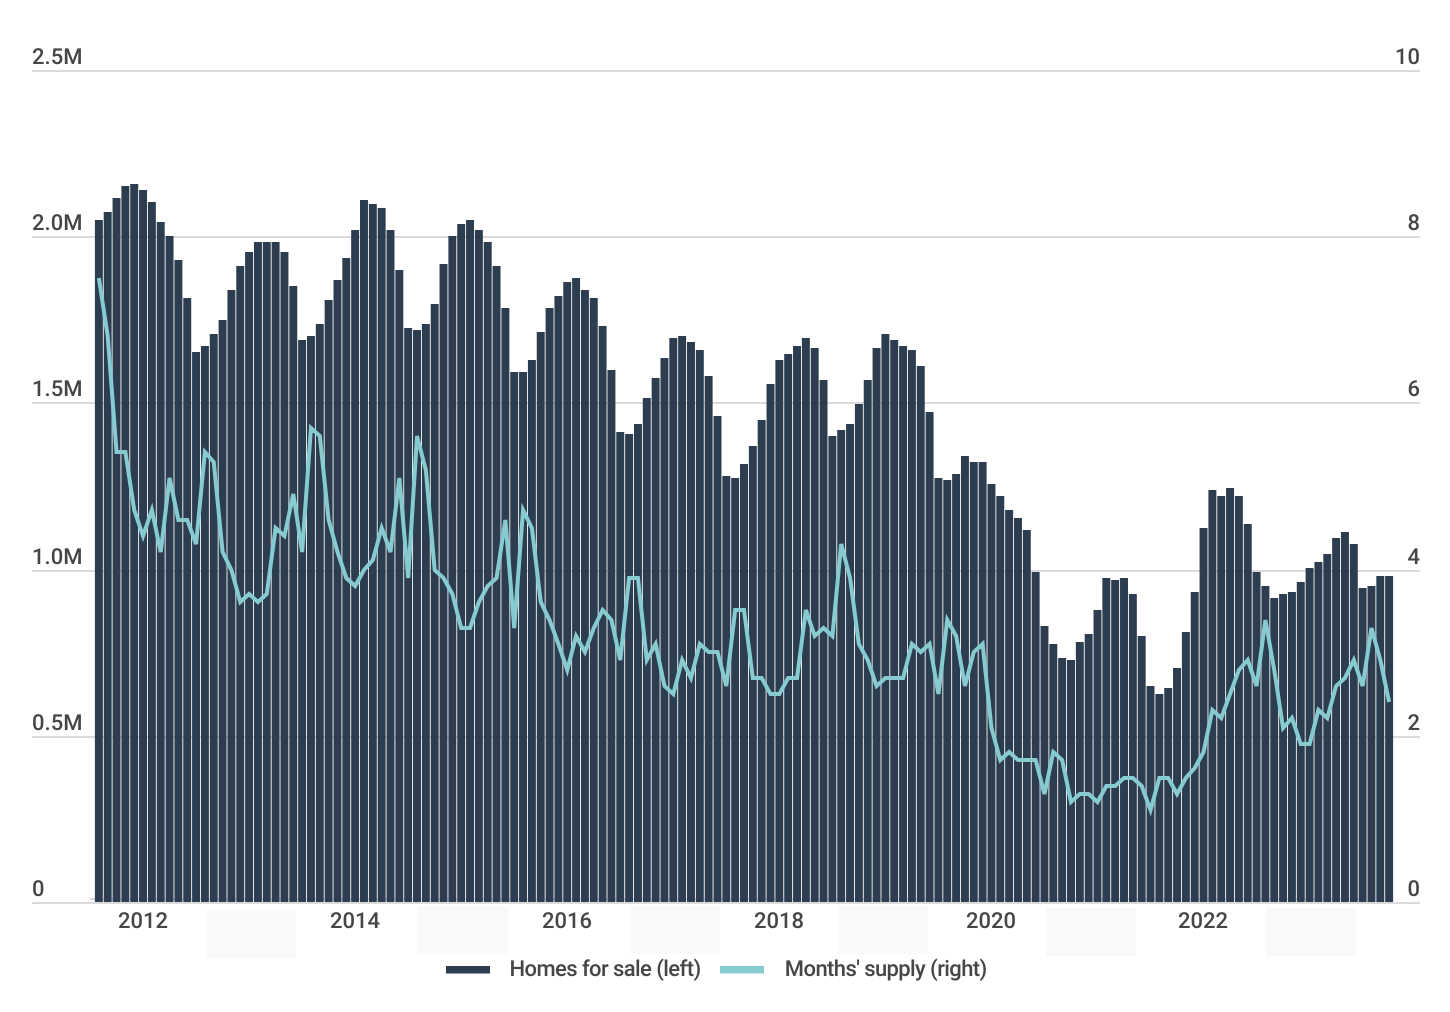
The result is that over the past decade, the number of homes for sale at any given point in time decreased from more than two million in 2012 to a low of approximately 630,000 at the start of 2022, according to data from Redfin. Over the same time period, months’ supply—a measure of how long it would take existing inventory to sell if no new homes came on the market—plummeted from a high of 7.5 months to a historic low of 1.1 months.
While the inventory deficit has eased slightly since early 2022, the situation is far from ideal for buyers. Throughout the first quarter of 2024, the national inventory hovered around 970,000 homes for sale, marking a 4.0% year-over-year increase. Despite this uptick, existing inventory would sustain the current sales pace for just 2.9 months, a marginal increase from 2.8 months recorded last year.
Residential Housing Inventory by State
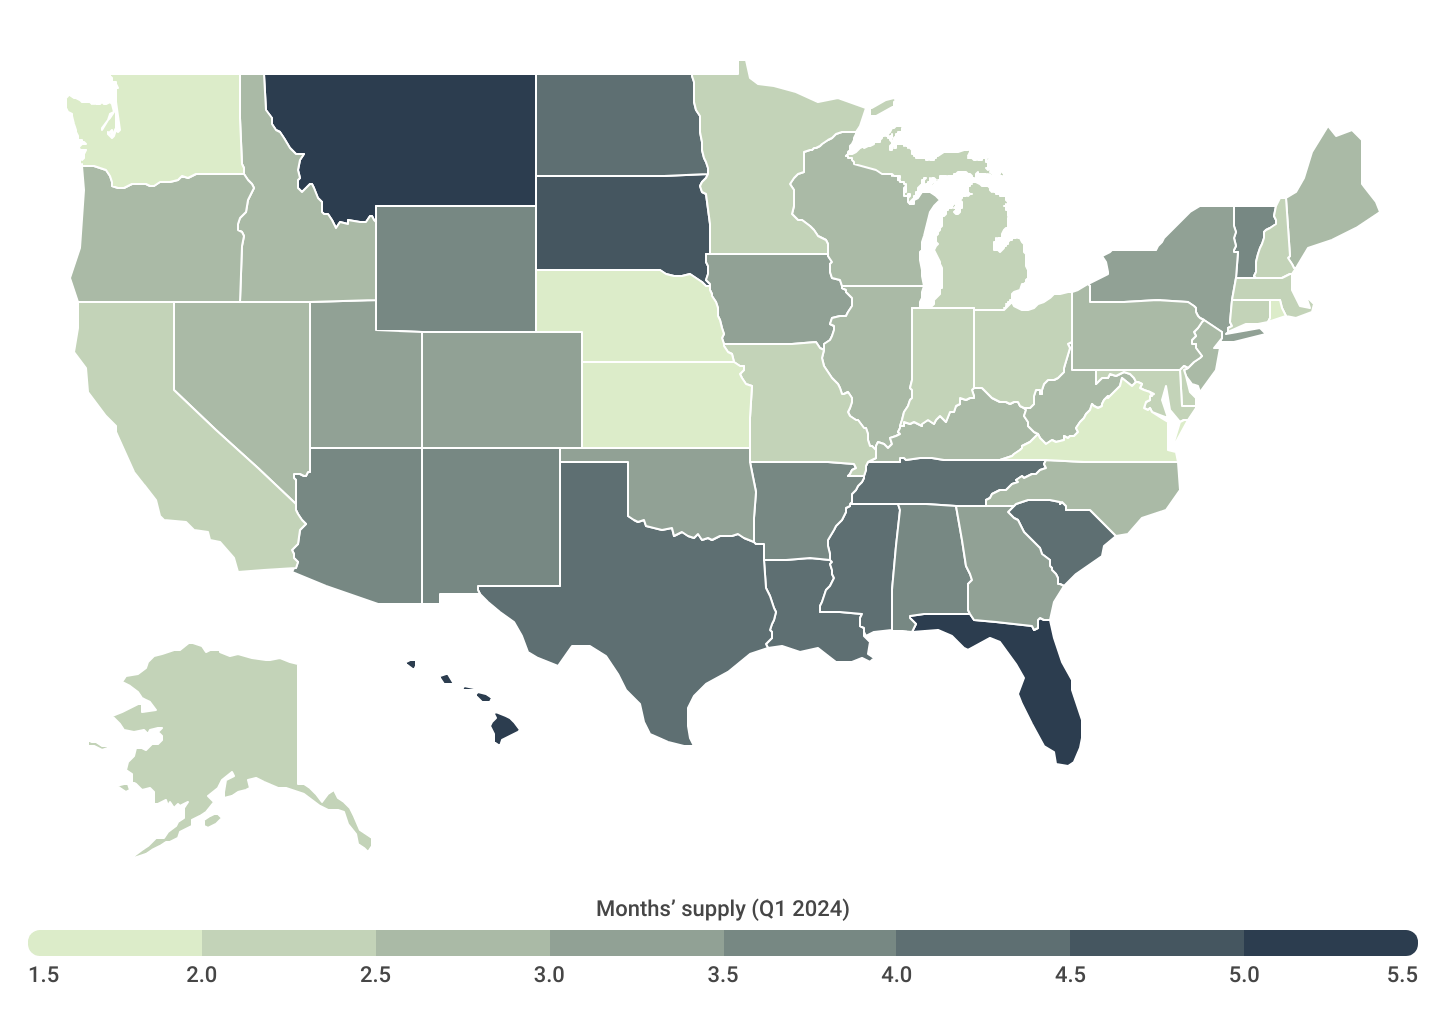
Florida, Hawaii, & Montana have the greatest housing supply relative to demand
Regionally, the lack of housing affects certain areas more severely than others due to both short- and medium-term market conditions, as well as long-standing trends in construction activity. An analysis conducted by the National Association of Home Builders showed that throughout the 2010s, approximately 77% of single-family housing starts occurred in the South and West, compared to just 23% in the Midwest and Northeast.
These regional disparities manifest in the housing market’s current landscape. As of the first quarter of 2024, states with the lowest levels of supply are concentrated in and around the Midwest (such as Kansas with 1.5 months of supply) and the Northeast (including Rhode Island with 1.8 months of supply). However, Washington state also stands out for having some of the lowest levels of available housing nationally, with just 1.9 months of supply.
In contrast, several states in the South, led by Florida (with 5.2 months of supply), along with Hawaii (5.2 months) and Montana (5.1 months), present notably more favorable conditions for buyers. In fact, Redfin data indicates that currently, over 55% of homes for sale nationally are located in Southern states, despite these states comprising just 38% of the population.
Changes in Housing Inventory by State
Florida & Maine recorded the largest increases in housing inventory over the past year
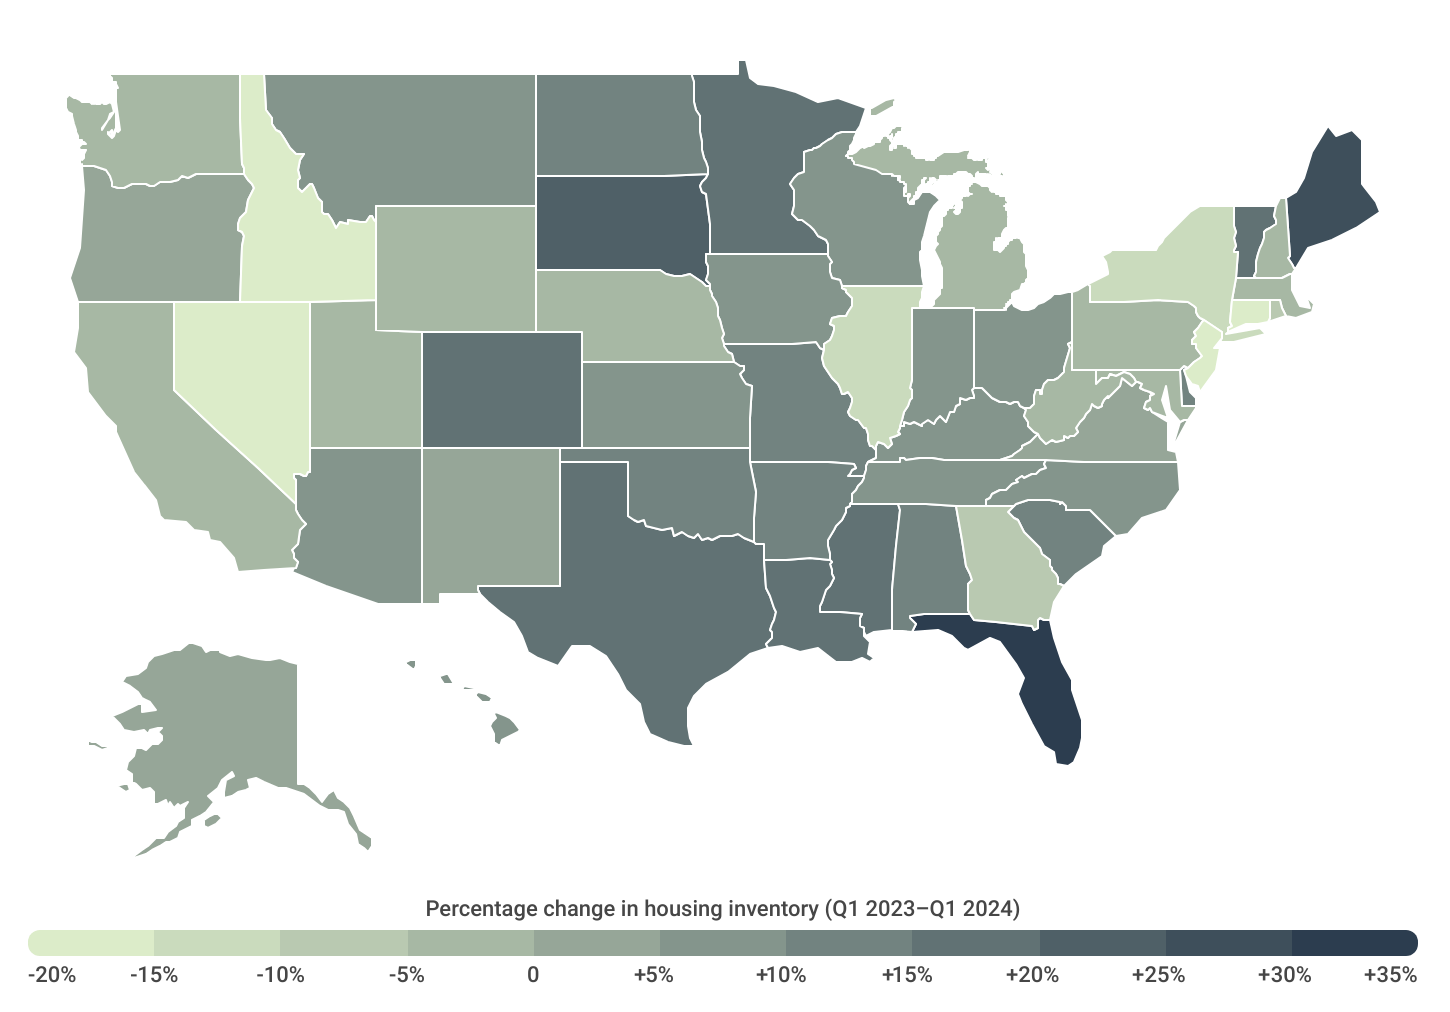
Nationally, the number of homes for sale increased by 4.0% between the first quarters of 2023 and 2024. However, this figure varied significantly across states, ranging from a nearly 35% surge in Florida to a 19.2% decline in Nevada. These discrepancies underscore the distinctive nature of local markets and emphasize the need for individualized policy approaches in addressing housing issues.
In Florida for example, demand for homes shot up dramatically during COVID-19 as remote workers from other states sought out affordable, warm-weather locales with more lenient pandemic regulations. Builders capitalized on this surge, constructing substantially more homes than in any other state but Texas. But now, as softer demand from out-of-state residents coincides with a large cohort of Florida homeowners eager to capitalize on the appreciation of their home values, a surplus of homes has flooded the market. A similar situation is currently playing out in Texas.
Among the nation’s largest cities, Denver, El Paso, and Dallas recorded the largest year-over-year increases in housing inventory. At the opposite end of the spectrum, Las Vegas, Raleigh, and Chicago recorded the biggest declines.
Below is a complete breakdown of more than 300 U.S. cities and all 50 states. The analysis was conducted by Construction Coverage using data from Redfin. Refer to the methodology section for additional details.
Large Cities With the Biggest Increase in Housing Inventory
| Top Cities | Change* |
|---|---|
| 1. Denver, CO | +36.8% |
| 2. El Paso, TX | +33.1% |
| 3. Dallas, TX | +32.1% |
| 4. Omaha, NE | +31.8% |
| 5. Tulsa, OK | +30.3% |
| 6. San Antonio, TX | +26.7% |
| 7. Memphis, TN | +24.0% |
| 8. Aurora, CO | +23.7% |
| 9. New Orleans, LA | +22.0% |
| 10. Wichita, KS | +20.2% |
| 11. Tampa, FL | +19.9% |
| 12. Minneapolis, MN | +18.5% |
| 13. Arlington, TX | +18.4% |
| 14. Nashville, TN | +18.1% |
| 15. Oakland, CA | +17.3% |
| Bottom Cities | Change* |
|---|---|
| 1. Las Vegas, NV | -25.8% |
| 2. Raleigh, NC | -23.4% |
| 3. Chicago, IL | -18.0% |
| 4. Sacramento, CA | -15.8% |
| 5. San Jose, CA | -13.4% |
| 6. Cleveland, OH | -9.5% |
| 7. New York, NY | -8.8% |
| 8. Atlanta, GA | -8.7% |
| 9. Philadelphia, PA | -6.7% |
| 10. Bakersfield, CA | -6.3% |
| 11. Fresno, CA | -5.9% |
| 12. San Francisco, CA | -5.5% |
| 13. Mesa, AZ | -5.2% |
| 14. Indianapolis, IN | -1.9% |
| 15. Los Angeles, CA | -1.6% |
States With the Biggest Increase in Housing Inventory
| Top States | Change* |
|---|---|
| 1. Florida | +34.7% |
| 2. Maine | +26.4% |
| 3. South Dakota | +21.0% |
| 4. Mississippi | +17.2% |
| 5. Texas | +16.0% |
| 6. Louisiana | +15.9% |
| 7. Minnesota | +15.9% |
| 8. Vermont | +15.2% |
| 9. Colorado | +15.0% |
| 10. Alabama | +14.0% |
| 11. South Carolina | +13.4% |
| 12. Missouri | +13.3% |
| 13. Arkansas | +12.1% |
| 14. Delaware | +11.2% |
| 15. North Dakota | +10.8% |
| Bottom States | Change* |
|---|---|
| 1. Nevada | -19.2% |
| 2. Idaho | -18.7% |
| 3. Connecticut | -16.6% |
| 4. New Jersey | -15.2% |
| 5. Illinois | -13.0% |
| 6. New York | -12.0% |
| 7. Georgia | -7.5% |
| 8. Rhode Island | -6.1% |
| 9. Michigan | -4.3% |
| 10. Massachusetts | -3.8% |
| 11. Pennsylvania | -3.1% |
| 12. New Hampshire | -2.2% |
| 13. California | -1.7% |
| 14. Wyoming | -1.5% |
| 15. Nebraska | -1.3% |
*Percentage change in housing inventory (Q1 2023–Q1 2024)
FOR CONSTRUCTION BUSINESSES
As the construction industry experiences a slowdown, it becomes crucial to enhance the quality of your bids in order to secure a limited number of available projects. To achieve this goal, you can leverage two powerful tools: construction estimating software and takeoff software. These technologies enable you to improve bid accuracy and expedite the bidding process.
Methodology
To determine the locations with the biggest increases in housing inventory, researchers at Construction Coverage analyzed the latest data from Redfin. The researchers ranked locations based on the percentage change in the average monthly housing inventory between Q1 2023 and Q1 2024. In the event of a tie, the location with the greater total change in average monthly housing inventory was ranked higher. Researchers also calculated the average months’ supply and median sale price for the same periods. To improve relevance, only cities with at least 100,000 people and complete data across all statistics were included in the analysis. Additionally, cities were grouped into the following cohorts based on population size: small cities (100,000–149,999), midsize cities (150,000–349,999), and large cities (350,000 or more).
References
- Freddie Mac. (2024, June 6). 30-Year Fixed Rate Mortgage Average in the United States. Retrieved on June 8, 2024 from https://fred.stlouisfed.org/series/MORTGAGE30US.
- U.S. Census Bureau and U.S. Department of Housing and Urban Development. (2024, May 16). New Privately-Owned Housing Units Started: Total Units. Retrieved on June 8, 2024 from https://fred.stlouisfed.org/series/HOUST.
- Jones, Hannah. Realtor.com. (2023, May 22). Realtor.com® Investor Report: Large Investor Activity Wanes, Overall Investor Share Remains High. Retrieved on June 8, 2024 from https://www.realtor.com/research/investor-report-april-2023/.
- Horowitz, Alex and Kansal, Tushar. The Pew Charitable Trusts. (2023, November 30). Survey Finds Large Majorities Favor Policies to Enable More Housing. Retrieved on June 8, 2024 from https://www.pewtrusts.org/en/research-and-analysis/articles/2023/11/30/survey-finds-large-majorities-favor-policies-to-enable-more-housing.
- Fannie Mae. (2022, October 31). U.S. Housing Shortage: Everything, Everywhere, All at Once. Retrieved on June 8, 2024 from https://www.fanniemae.com/research-and-insights/perspectives/us-housing-shortage.
- Jones, Jonathan. Construction Coverage. (2024, January 18). Baby Boomer-Dominant Housing Markets. Retrieved on June 8, 2024 from https://constructioncoverage.com/research/baby-boomer-dominant-housing-markets.
- Dietz, Robert. National Association of Home Builders. (2020, January 6). A Decade of Home Building: The Long Recovery of the 2010s. Retrieved on June 8, 2024 from https://eyeonhousing.org/2020/01/a-decade-of-home-building-the-long-recovery-of-the-2010s/.
- U.S. Census Bureau. (2024). Building Permits Survey. Retrieved on June 8, 2024 from https://www.census.gov/construction/bps/visualizations/statemap/index.html.
- Redfin. (2024). Data Center. Retrieved on June 8, 2024 from https://www.redfin.com/news/data-center/.