American Cities With the Highest Property Taxes [2023 Edition]
America’s homebuyers have had an extraordinarily difficult few years. Heavy demand and scarce inventory in late 2020 and 2021 led to record growth in prices, while a run of high inflation throughout the economy made it more difficult to save up for a home. As the Federal Reserve has raised interest rates to cool demand in housing and other sectors, the costs to borrow for a mortgage have also increased.
For recent homebuyers and existing owners, trends in the real estate market have posed another challenge: property tax increases. Property taxes are usually calculated as a percentage of the assessed value of a property, an estimate that taxing authorities typically update every few years or when the property is sold. Because home prices have risen so dramatically since 2020, tax assessments are rising as well—which means larger annual property tax bills.
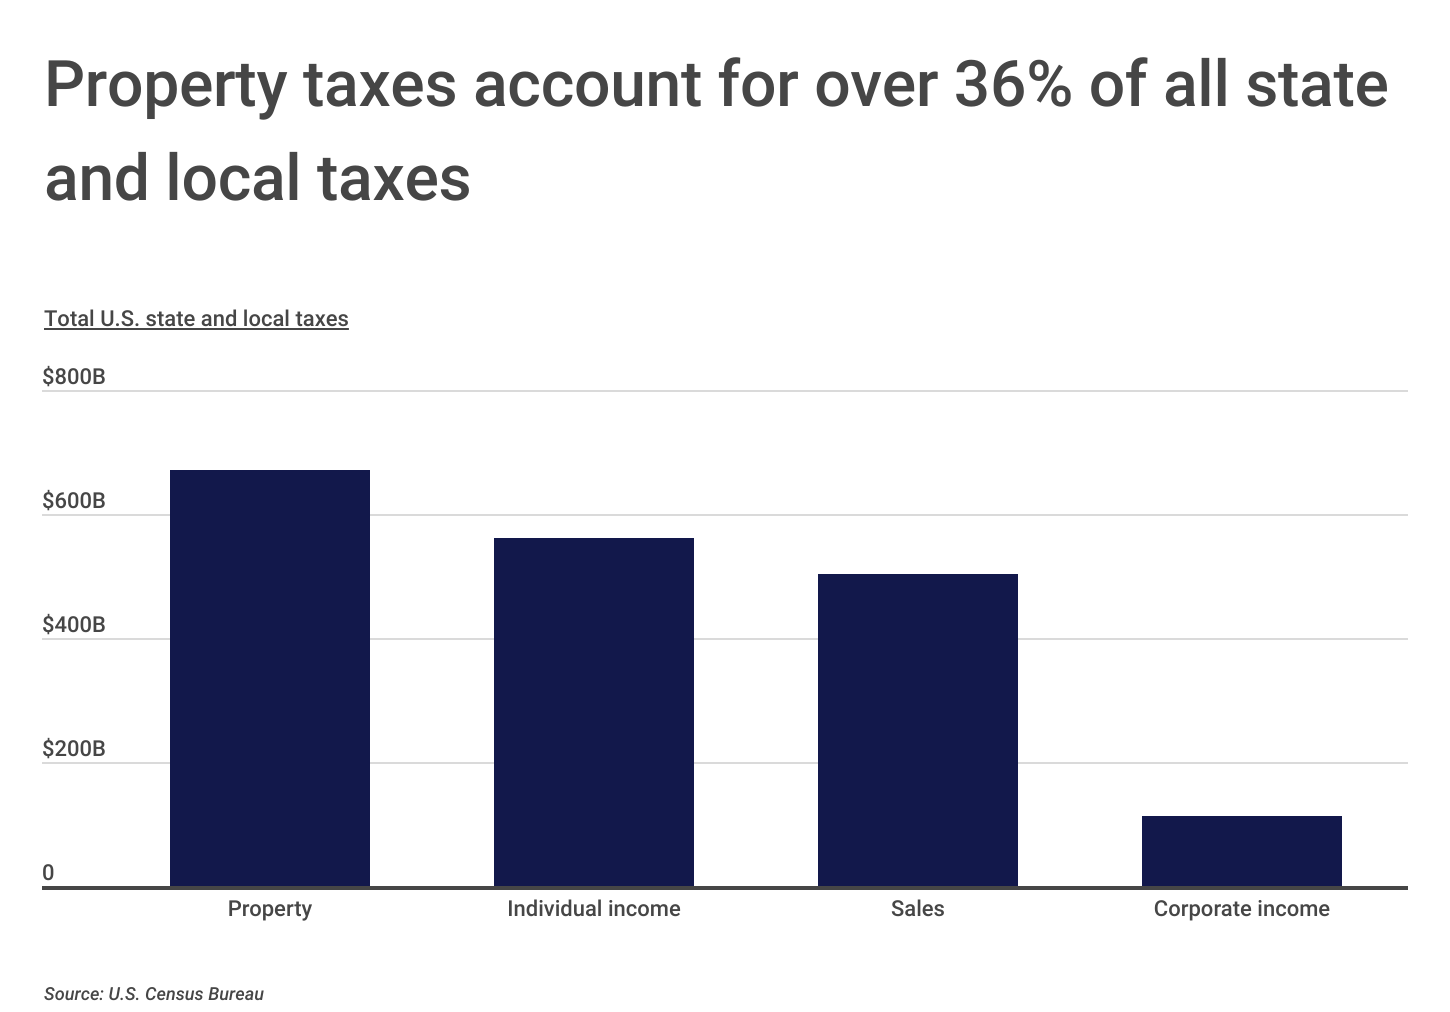
Higher property taxes can be daunting for homeowners, but they are a boon for state and local governments that rely heavily on property tax revenue. Property taxes totaled nearly $670 billion in 2021, representing more than one-third of all U.S. state and local tax collections. Rising property values should continue to grow that figure in future years. This could also help state and local governments weather the impacts of future economic downturns, which tend to have more immediate negative effects on other revenue sources like income and sales taxes.
TRENDING ON CONSTRUCTION COVERAGE
The best way to keep all parties to a construction project connected and on the same page is with construction management software. Scheduling and document management are just a couple of the many aspects of a construction project that construction management software aids with. These are the best construction management software platforms of 2023.
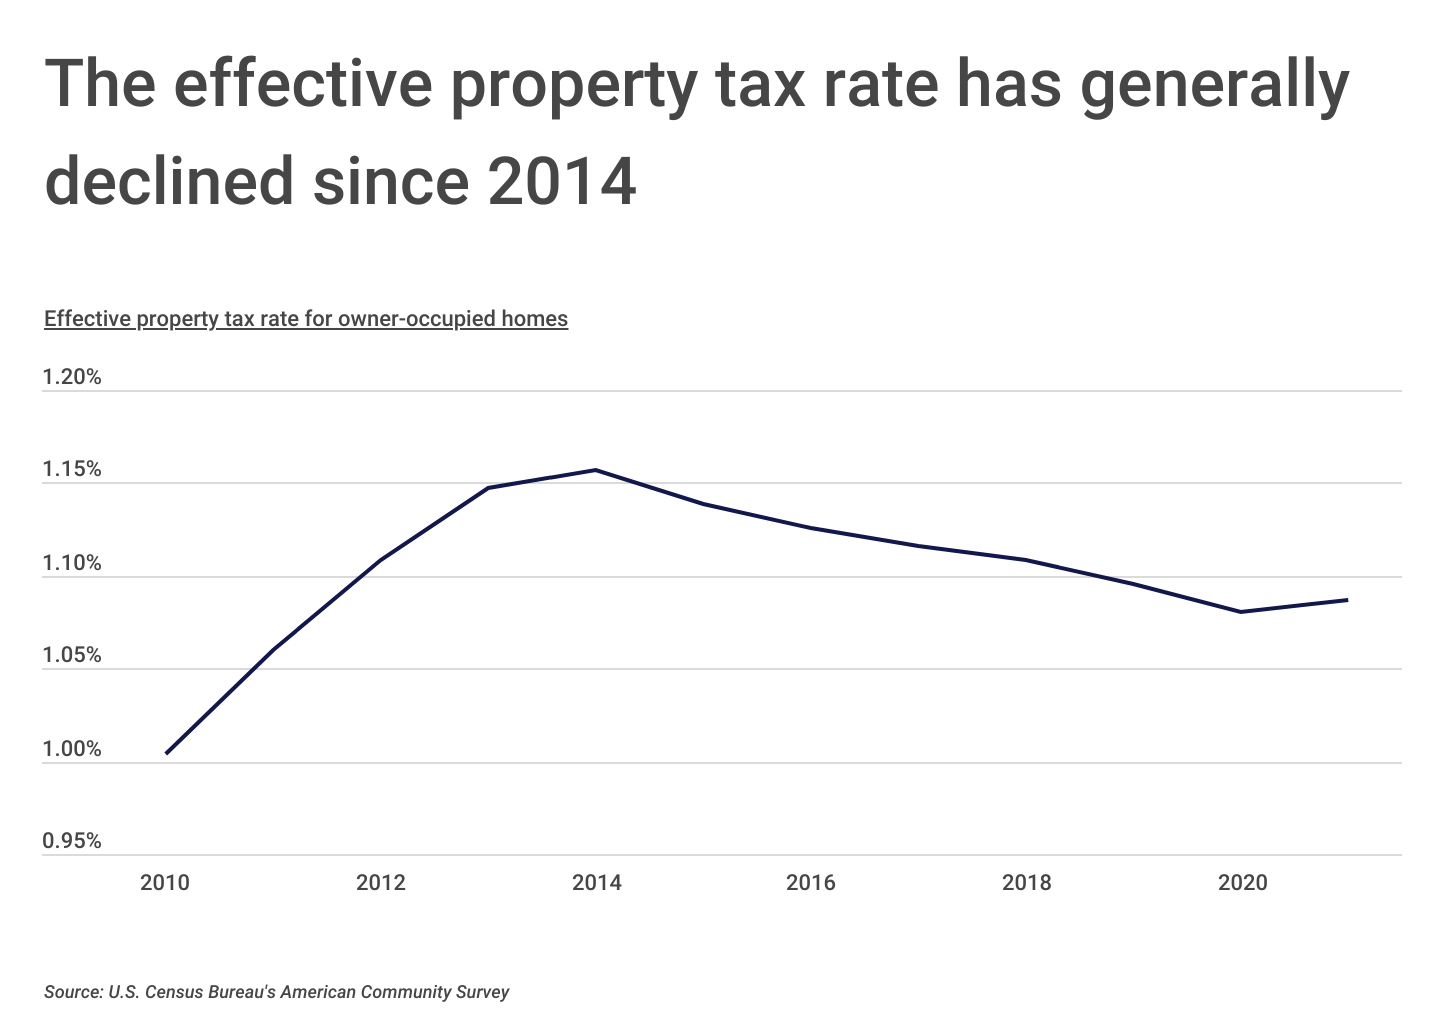
While homeowners may be concerned about an increase in their tax bills in light of recent market trends, the overall effective property tax rate nationwide has actually declined since 2014. After reaching a recent peak of 1.157% in 2014, the effective rate—calculated as the aggregate taxes paid divided by the aggregate value of housing units—fell to 1.087% in 2021. Because properties are typically only accessed for tax purposes periodically or when there is a transfer of ownership, changes in the effective property tax rate tend to lag behind changes in residential housing prices.
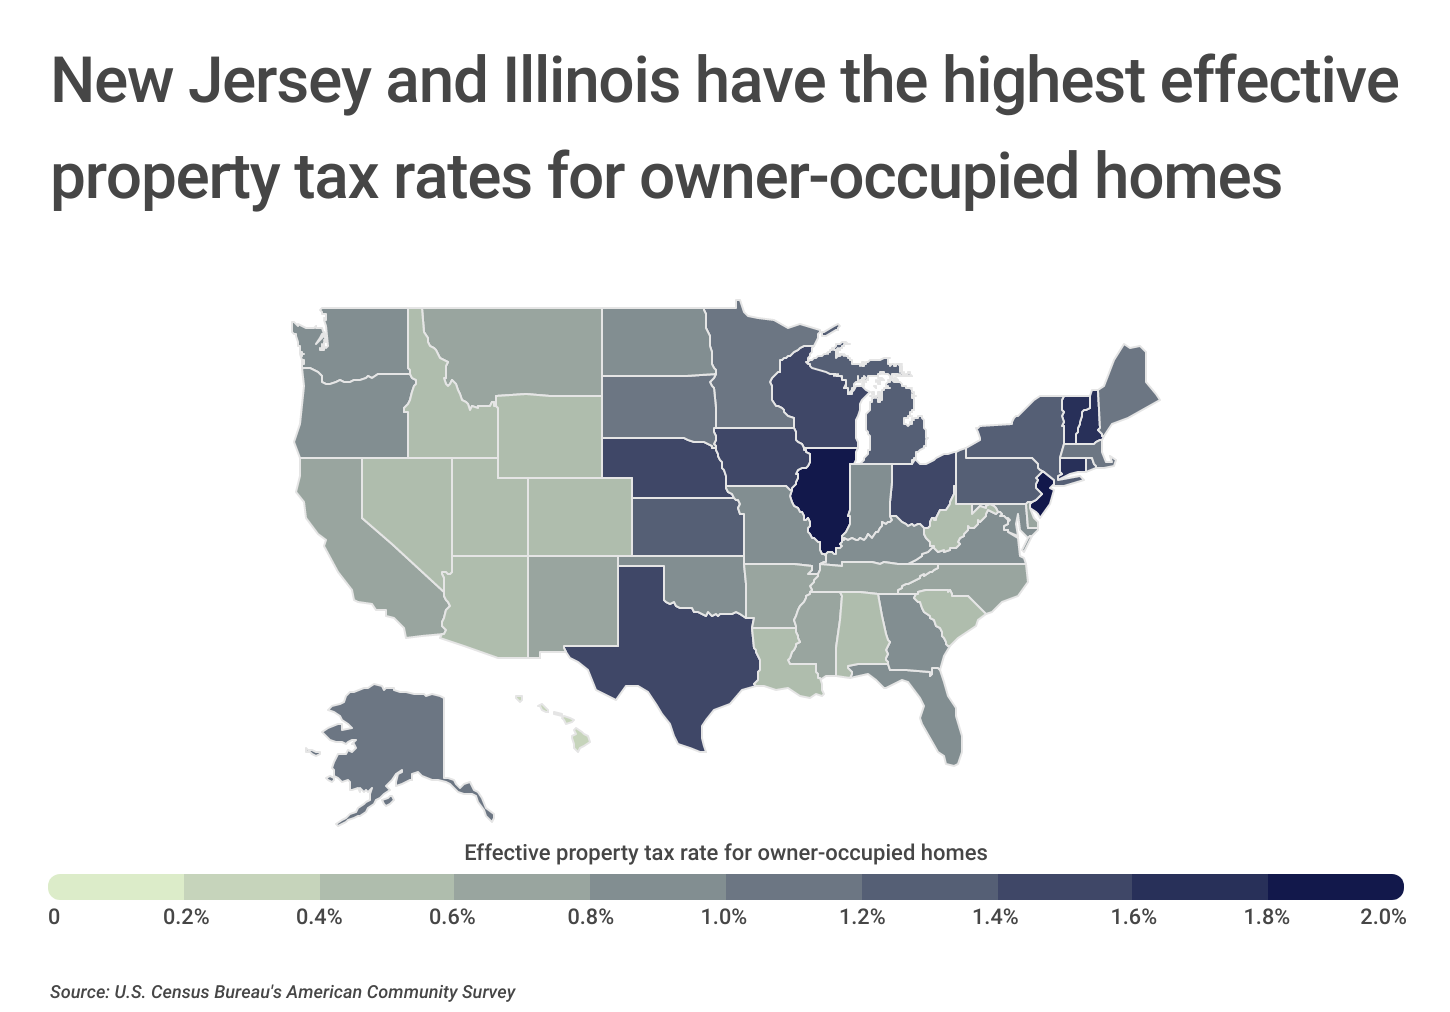
However, taxpayers’ burdens can vary substantially depending on geography. Certain states have put in place laws that limit how much the state or localities can charge in property taxes. One of the most notable examples is California’s Proposition 13, enacted in 1978. Prop 13 caps the property tax rate at 1% (in addition to any local voter-approved indebtedness) and limits when the value of properties can be reassessed for tax purposes. A number of other states have followed suit with similar legislation and ballot initiatives to limit property tax collection in various ways. Even within statewide limits, local governments could also choose to levy taxes at different rates, meaning that comparably valued properties in two localities or taxing districts could have widely different tax bills.
These overlapping state and local policies create a complicated mosaic of property tax regimes across the U.S. At the state level, the Northeast and Midwest tend to have the highest effective property tax rates, led by New Jersey at 2% and Illinois at 1.9%. In contrast, effective rates tend to be much lower in the South and Mountain West regions.
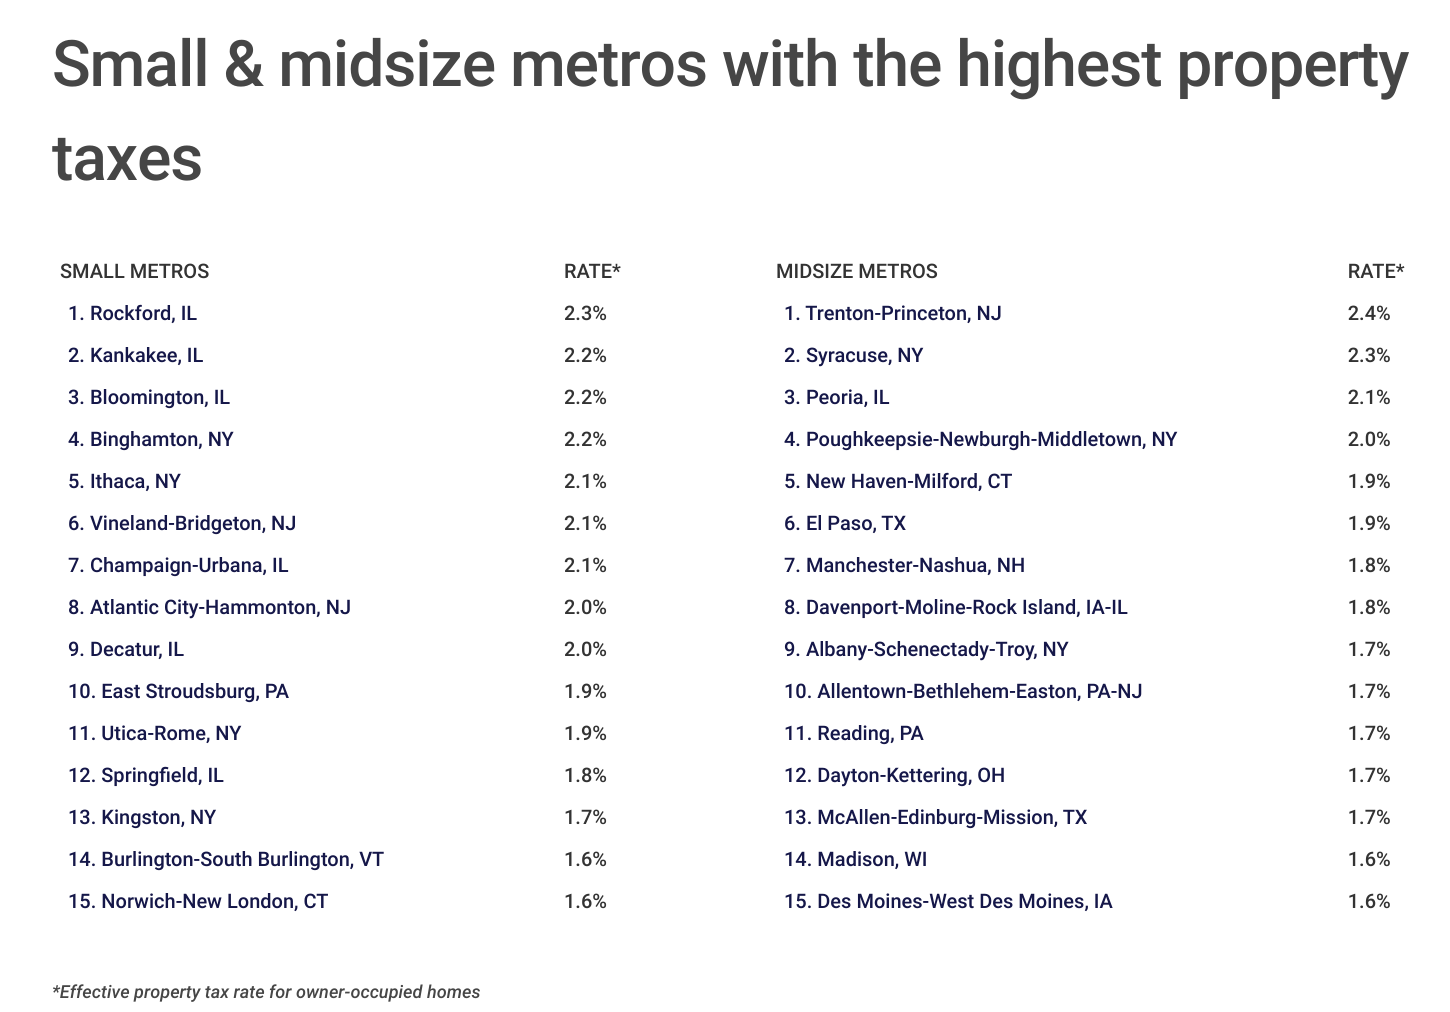
At the metropolitan level, those in Texas and New York headline the list of locations with the highest property taxes. Texas places four major metros in the top 15, while three New York metros are represented—including Rochester, which has the nation’s highest property taxes at a 2.4% effective rate.
The data used in this analysis is from the U.S. Census Bureau. To determine the locations with the highest property taxes, researchers at Construction Coverage calculated the effective property tax rate for owner-occupied homes by dividing the aggregate real estate taxes paid by the aggregate value of housing units in 2021. In the event of a tie, the location with the greater median property taxes paid for owner-occupied homes was ranked higher.
Here are the U.S. metropolitan areas with the highest property taxes.
Large Metros With the Highest Property Taxes

Photo Credit: Concrete Jungle Media / Shutterstock
15. Detroit-Warren-Dearborn, MI
- Effective property tax rate for owner-occupied homes: 1.3%
- Median property taxes paid for owner-occupied homes: $3,086
- Median owner-occupied home value: $220,900
- Median household income: $67,153

Photo Credit: Jason Sponseller / Shutterstock
14. Pittsburgh, PA
- Effective property tax rate for owner-occupied homes: 1.4%
- Median property taxes paid for owner-occupied homes: $2,671
- Median owner-occupied home value: $190,000
- Median household income: $66,609
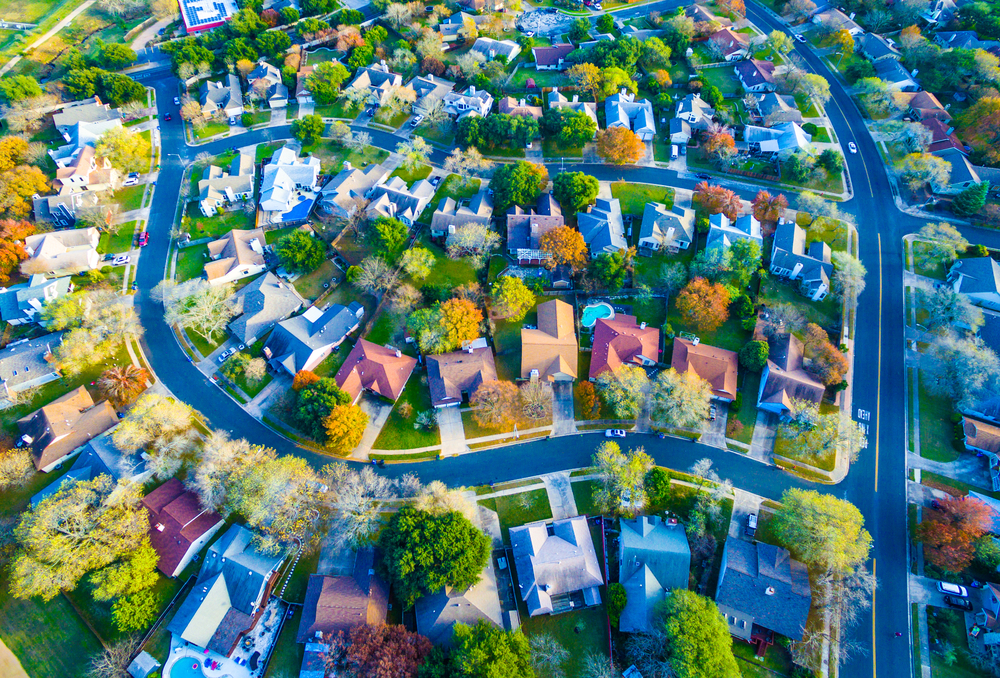
Photo Credit: Roschetzky Photography / Shutterstock
13. Austin-Round Rock-Georgetown, TX
- Effective property tax rate for owner-occupied homes: 1.4%
- Median property taxes paid for owner-occupied homes: $6,397
- Median owner-occupied home value: $397,100
- Median household income: $86,530
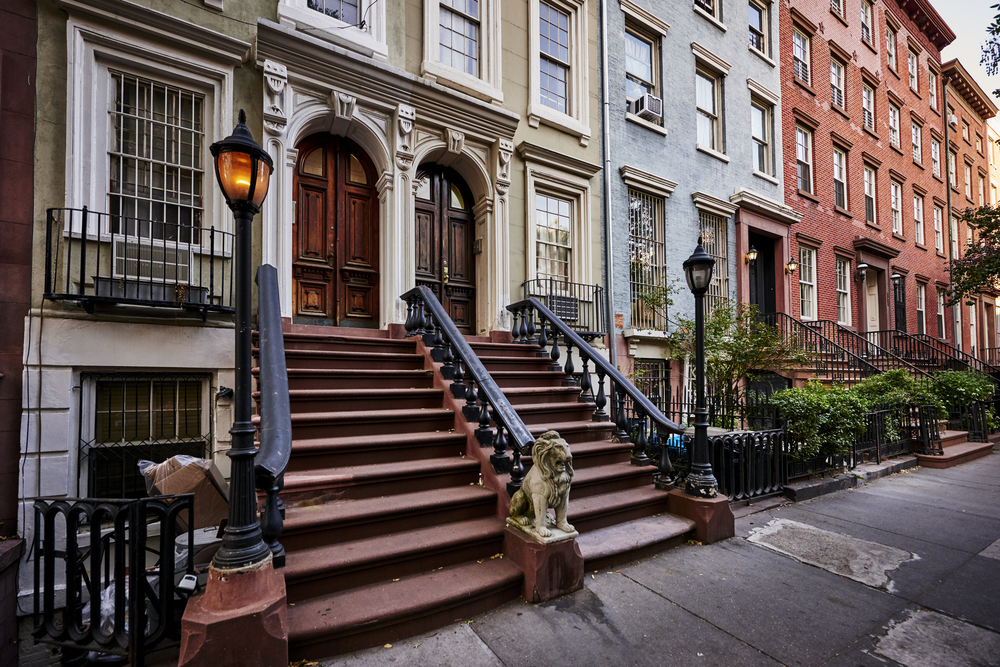
Photo Credit: Brian Goodman / Shutterstock
12. New York-Newark-Jersey City, NY-NJ-PA
- Effective property tax rate for owner-occupied homes: 1.4%
- Median property taxes paid for owner-occupied homes: $9,091
- Median owner-occupied home value: $533,700
- Median household income: $84,409
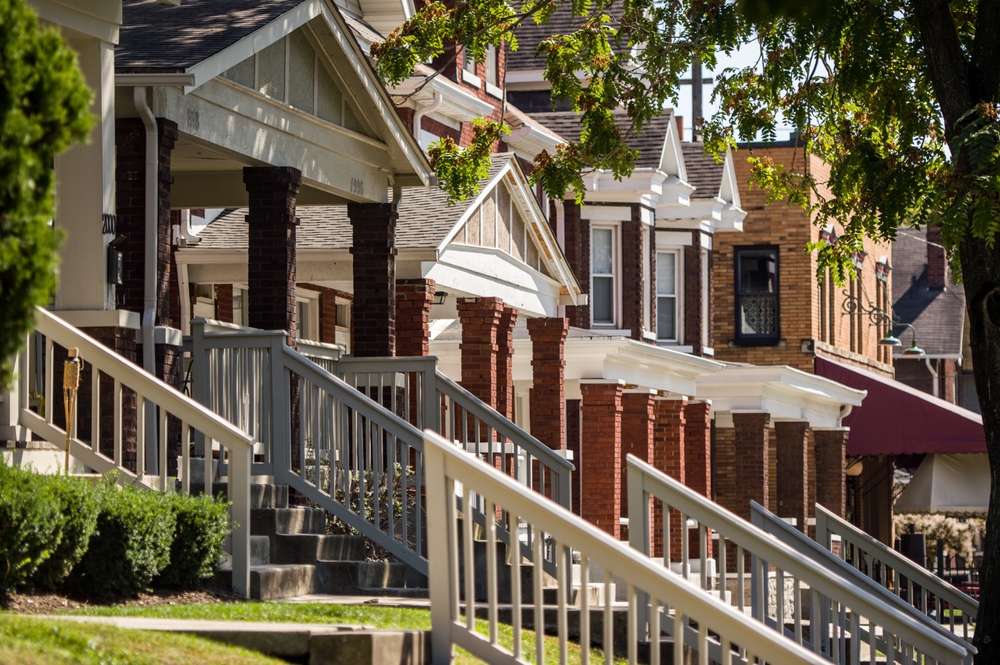
Photo Credit: Mario Cuitino / Shutterstock
11. Columbus, OH
- Effective property tax rate for owner-occupied homes: 1.5%
- Median property taxes paid for owner-occupied homes: $3,568
- Median owner-occupied home value: $254,700
- Median household income: $71,839

Photo Credit: Inspired By Maps / Shutterstock
10. San Antonio-New Braunfels, TX
- Effective property tax rate for owner-occupied homes: 1.5%
- Median property taxes paid for owner-occupied homes: $3,941
- Median owner-occupied home value: $233,500
- Median household income: $66,775

Photo Credit: f11photo / Shutterstock
9. Milwaukee-Waukesha, WI
- Effective property tax rate for owner-occupied homes: 1.5%
- Median property taxes paid for owner-occupied homes: $4,033
- Median owner-occupied home value: $266,200
- Median household income: $68,449
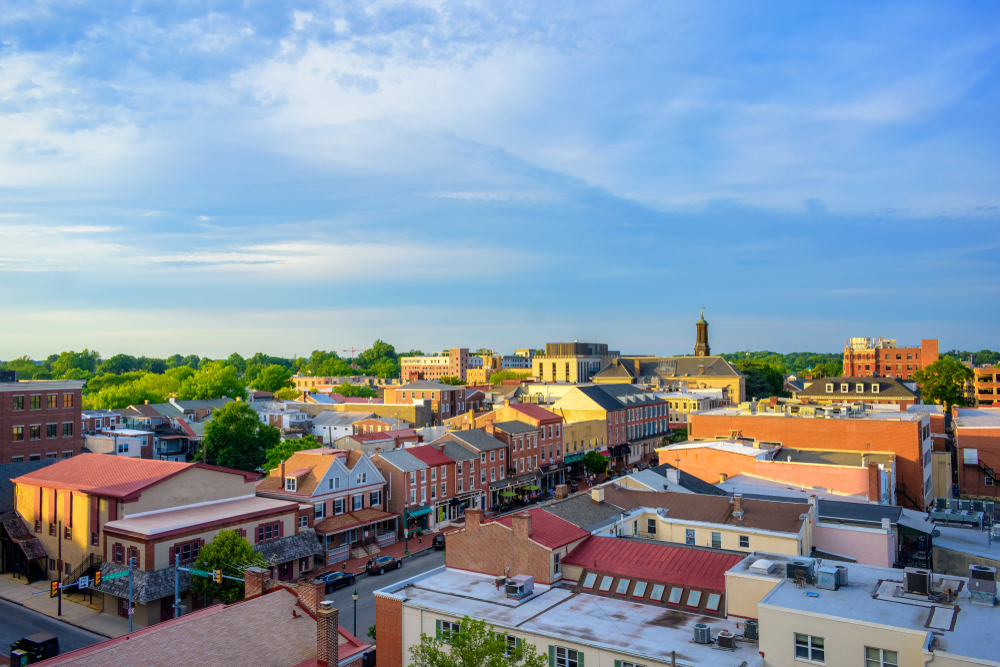
Photo Credit: LittleKitty / Shutterstock
8. Philadelphia-Camden-Wilmington, PA-NJ-DE-MD
- Effective property tax rate for owner-occupied homes: 1.5%
- Median property taxes paid for owner-occupied homes: $4,635
- Median owner-occupied home value: $300,300
- Median household income: $80,007
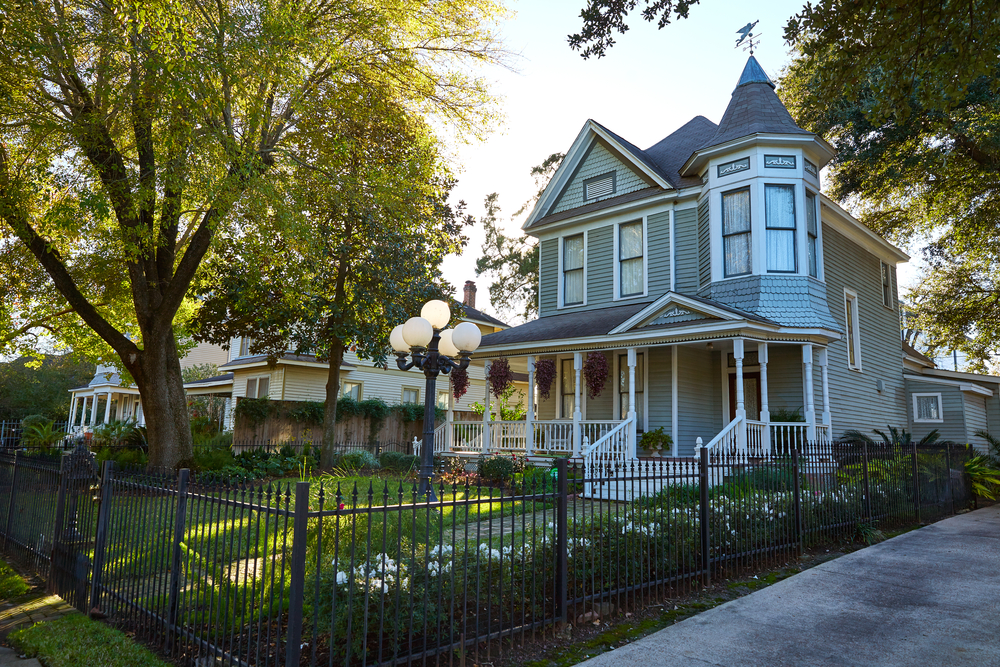
Photo Credit: lunamarina / Shutterstock
7. Houston-The Woodlands-Sugar Land, TX
- Effective property tax rate for owner-occupied homes: 1.6%
- Median property taxes paid for owner-occupied homes: $4,381
- Median owner-occupied home value: $252,300
- Median household income: $70,893

Photo Credit: Francisco Sandoval Guate / Shutterstock
6. Dallas-Fort Worth-Arlington, TX
- Effective property tax rate for owner-occupied homes: 1.6%
- Median property taxes paid for owner-occupied homes: $5,106
- Median owner-occupied home value: $294,900
- Median household income: $75,975

Photo Credit: Kenneth Sponsler / Shutterstock
5. Cleveland-Elyria, OH
- Effective property tax rate for owner-occupied homes: 1.7%
- Median property taxes paid for owner-occupied homes: $3,264
- Median owner-occupied home value: $184,500
- Median household income: $62,315

Photo Credit: Sergey Novikov / Shutterstock
4. Buffalo-Cheektowaga, NY
- Effective property tax rate for owner-occupied homes: 1.8%
- Median property taxes paid for owner-occupied homes: $4,145
- Median owner-occupied home value: $192,000
- Median household income: $62,794

Photo Credit: Sean Pavone / Shutterstock
3. Chicago-Naperville-Elgin, IL-IN-WI
- Effective property tax rate for owner-occupied homes: 1.9%
- Median property taxes paid for owner-occupied homes: $5,776
- Median owner-occupied home value: $281,100
- Median household income: $78,166

Photo Credit: Jon Bilous / Shutterstock
2. Hartford-East Hartford-Middletown, CT
- Effective property tax rate for owner-occupied homes: 1.9%
- Median property taxes paid for owner-occupied homes: $5,843
- Median owner-occupied home value: $278,500
- Median household income: $82,258

Photo Credit: Wirestock Creators / Shutterstock
1. Rochester, NY
- Effective property tax rate for owner-occupied homes: 2.4%
- Median property taxes paid for owner-occupied homes: $4,586
- Median owner-occupied home value: $171,000
- Median household income: $66,516
Detailed Findings & Methodology
The data used in this analysis is from the U.S. Census Bureau’s 2021 American Community Survey. To determine the locations with the highest property taxes, researchers at Construction Coverage calculated the effective property tax rate for owner-occupied homes by dividing the aggregate real estate taxes paid by the aggregate value of housing units. In the event of a tie, the location with the greater median property taxes paid for owner-occupied homes was ranked higher. To improve relevance, only metropolitan areas with at least 100,000 residents were included. Additionally, metros were grouped into cohorts based on population size: small (100,000-349,999), midsize (350,000-999,999), and large (1,000,000 or more).
Correction: March 28, 2023
An earlier version of this article incorrectly identified median owner-occupied household income. The data actually reflected median household income—which includes all occupied households regardless of ownership—and it has since been corrected.
Each company featured in our guides has been independently selected and reviewed by our research team. If you select one of these companies and click on a link, we may earn a commission.
By clicking on these links, you may be taken to one of our insurance partners. The specific company listed here may or may not be included in our partner’s network at this time.
