
American Cities With the Highest Rental Vacancy Rates
Note: This is the most recent release of our American Cities With the Highest Rental Vacancy Rates study. To see data from prior years, please visit the Full Results section below.
Following years marked by intense competition and record-breaking price increases, the U.S. rental market finally showed signs of cooling off in 2023. Zillow’s data indicates that median rents across all rental types continued to decline in the early months of 2024, following a peak in the third quarter of the previous year. These downward price trends can largely be traced to increased vacancies, stemming from near historically high rates of multifamily construction. While this shift may offer some relief to individuals grappling with housing challenges, it’s important to note that rental prices remain prohibitively high for the majority of renter households, even amidst the market softening.
U.S. Rental Vacancy Rates Over Time
Despite inching up over the past few quarters, rental vacancies remain below historical levels
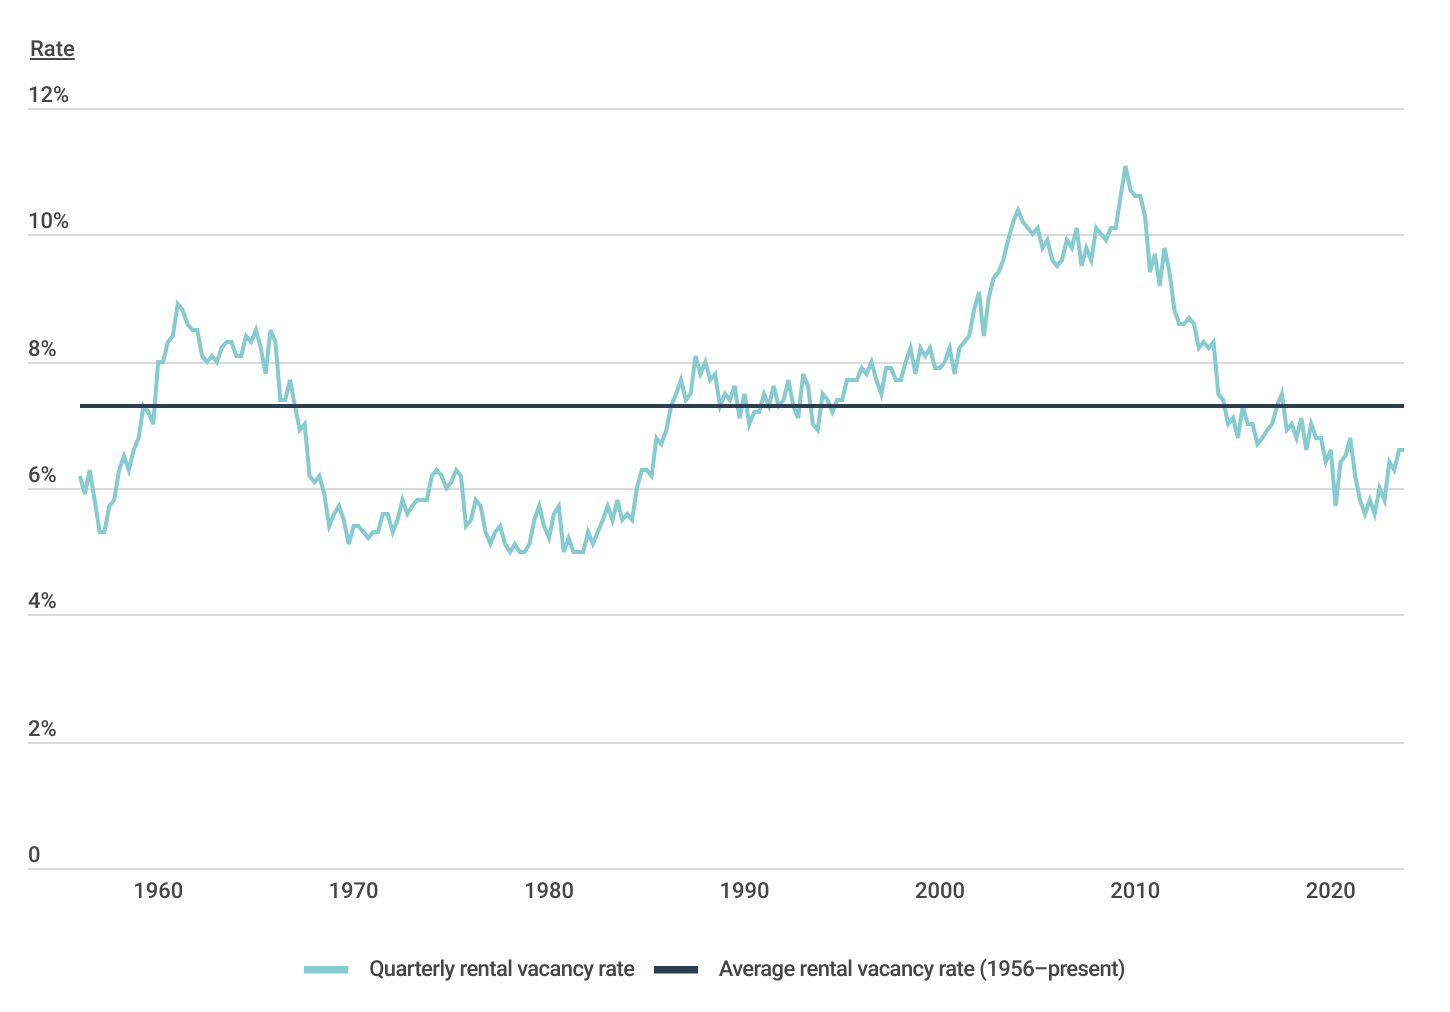
The rental vacancy rate—or the proportion of rental homes that are vacant in a given area—is an important economic indicator because it signals the balance between supply and demand for rental housing. High vacancy rates indicate an ample supply of rental properties, fostering competition among landlords and placing downward pressure on rent prices. This increased availability of housing options can lead to improved affordability for renters, allowing them to secure lease agreements at more reasonable costs. Conversely, low vacancy rates indicate a shortage of rental units, driving up prices as demand outstrips supply.
Since the Great Recession, the rental vacancy rate in the United States largely declined, coinciding with a slowdown in construction activity. This trend persisted for over a decade, reaching a low of 5.6% in 2021—a level not observed since the 1980s. Due to the relative shortage of rental units, market rates surged by astonishing double-digit percentages during 2021 and 2022, creating financial havoc for prospective renters. Despite recent increases in construction activity, which have nudged the rental vacancy rate up to its current level of 6.6% as of the first quarter of 2024, it is still below the historical average of 7.3%. Additionally, rental prices remain considerably higher than pre-pandemic levels, exacerbating affordability challenges for many individuals seeking housing.
Housing Costs for Renters
Over half of renter households spend at least 30% of their income on rent
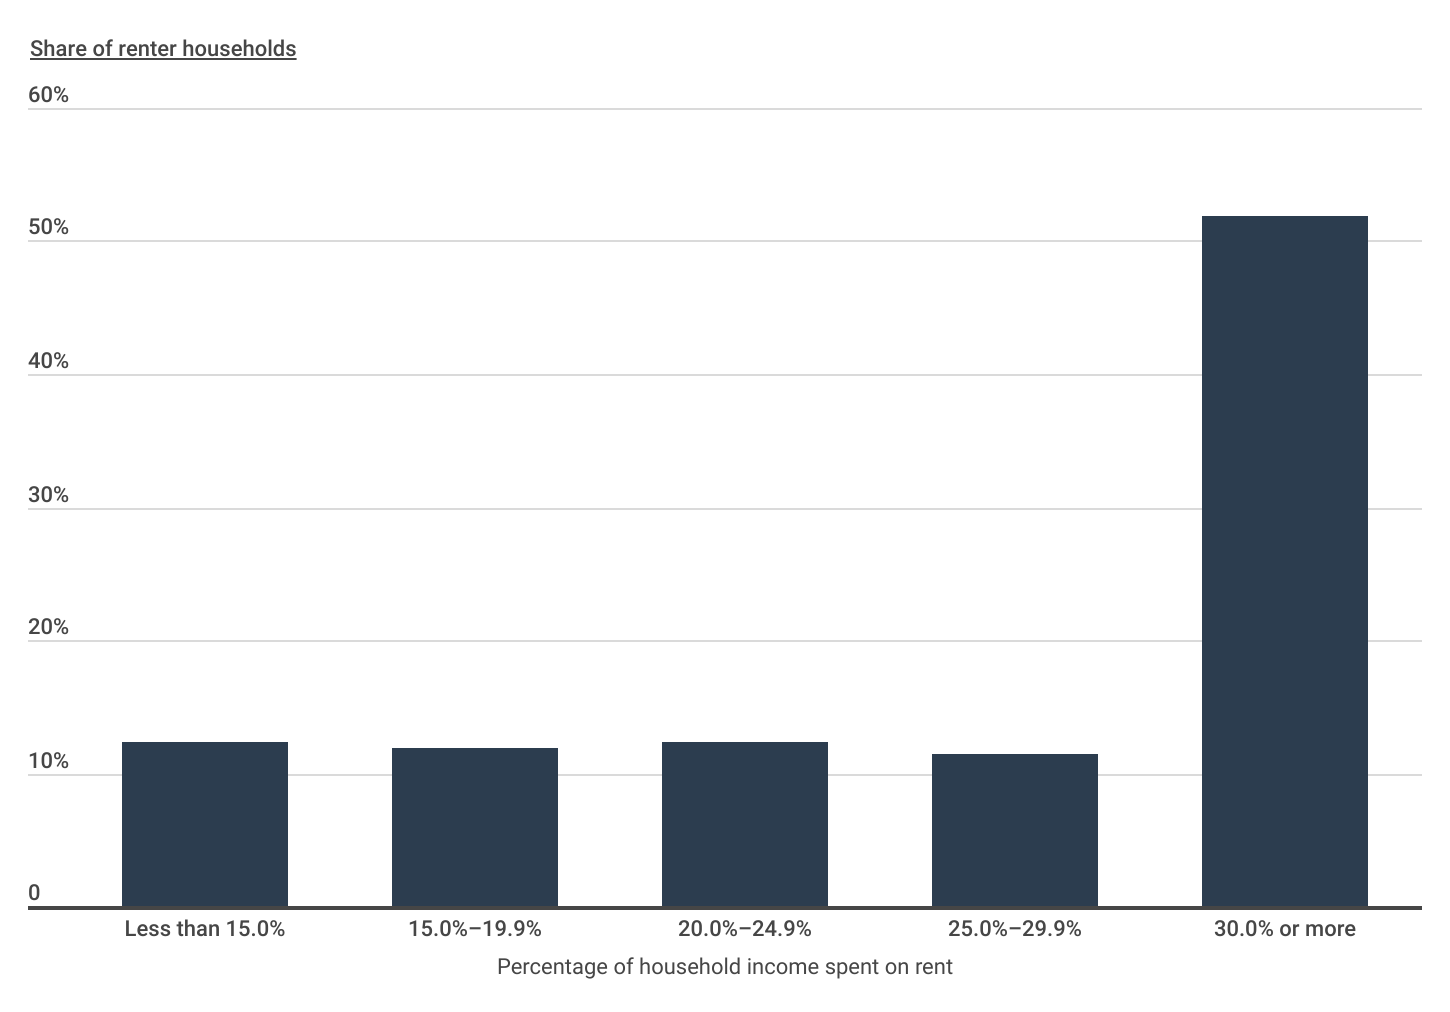
The result is that many renters have no choice but to designate increasingly large portions of their income to rent. As of the latest American Community Survey released in late 2023, over half of renter households now spend at least 30% or more of their income on rent—a level deemed unaffordable by the Department of Housing and Urban Development (HUD).
The consequences of unaffordable housing extend beyond mere financial strain, impacting individuals’ ability to allocate resources toward essential needs such as food, healthcare, transportation, and child care. Moreover, it impedes their capacity to save for pivotal life events, including debt reduction, retirement planning, and family aspirations. The large percentage of Americans spending significant portions of their paycheck on rent helps explain delays in parenthood and increases in the average age of first-time homebuyers.
Rental Vacancy Rates by Location
States in the South and Midwest have the highest rental vacancy rates
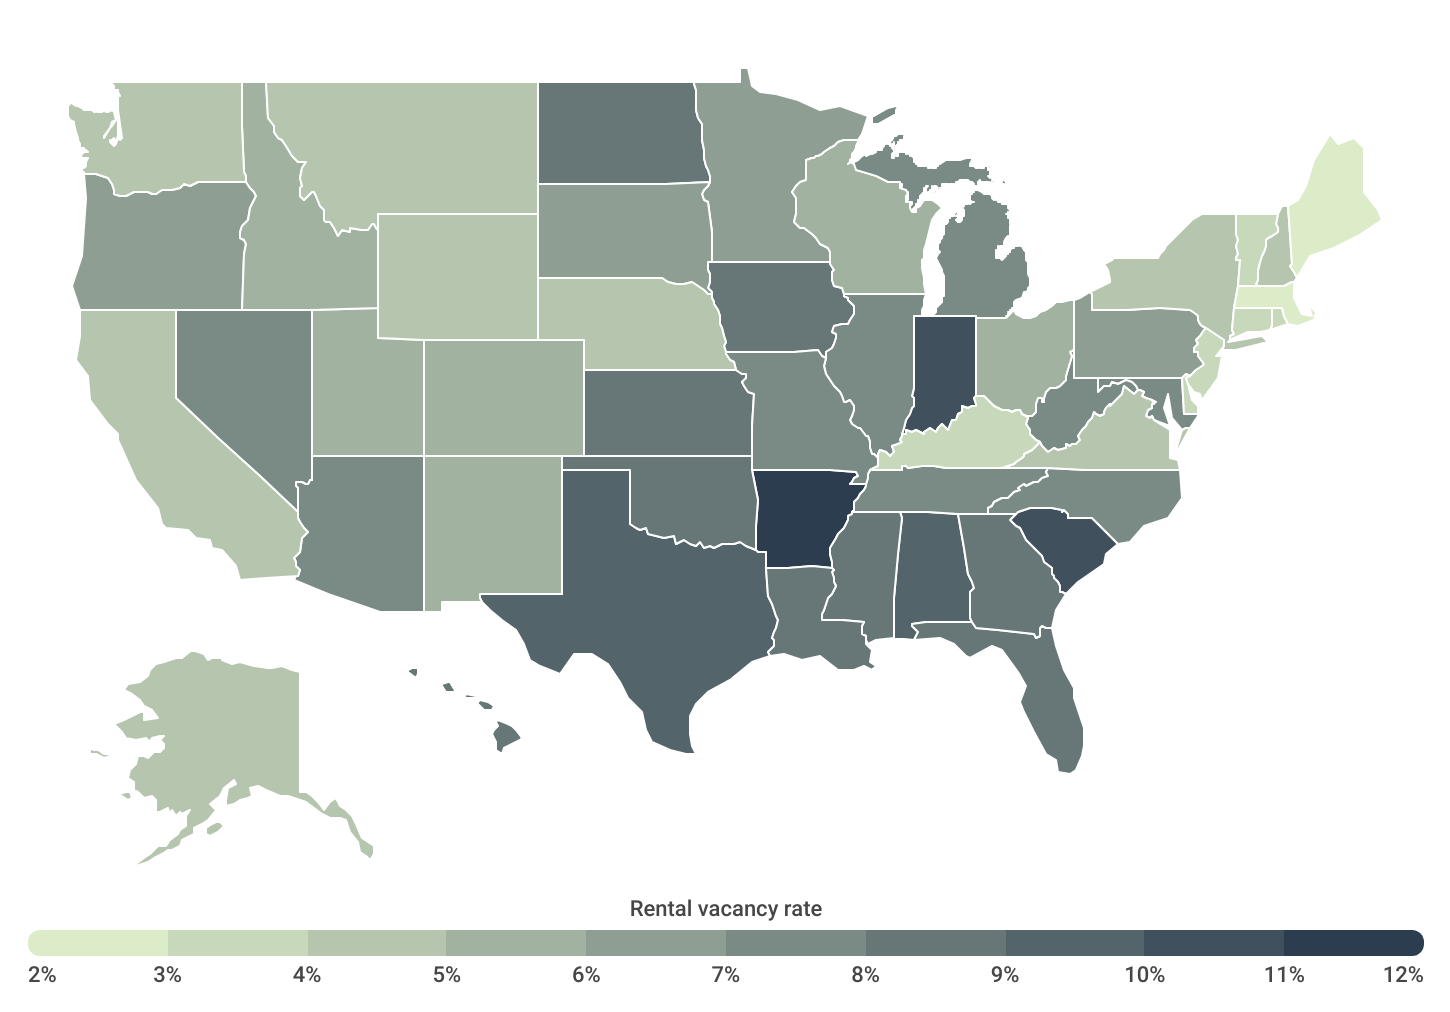
While efforts are underway across all levels of government to tackle the housing affordability crisis, its impact varies significantly across different regions. Areas experiencing lower rental vacancy rates signal a diminishing supply of rental units and a heightened demand for housing solutions. Notably, western and northeastern states have the lowest rental vacancy rates in the country, accounting for 14 out of 15 states with the lowest vacancy rates—all of which have rental vacancy rates of 4.9% or lower.
In contrast, southern and midwestern states generally have higher vacancy rates, comprising 14 out of 15 states with the highest rental vacancy rates. These regions present promising prospects for renters seeking more affordable housing compared to their counterparts in the West and Northeast. These trends are reflected at the local level as well, with the Cape Coral-Fort Myers, FL metropolitan area topping the nation in vacancies, averaging 15.3% in 2023.
Below is a complete breakdown of rental vacancy rates across the 75 largest U.S. metropolitan statistical areas and all 50 states. The analysis was conducted by Construction Coverage, using data from the U.S. Census Bureau and HUD. For more information, refer to the methodology section below.
Full Results
Methodology
The data used in this analysis is from the U.S. Census Bureau 2023 Housing Vacancies and Homeownership, U.S. Census Bureau 2022 American Community Survey 1-Year Estimates, and U.S. Department of Housing and Urban Development (HUD) 2024 50th Percentile Rent Estimates. To determine the locations with the highest rental vacancy rates, researchers at Construction Coverage calculated the percentage of rental homes that were vacant in 2023. In the event of a tie, the location with the greater number of renter households was ranked higher. Researchers also calculated the median monthly rent and percentage of renters that are cost-burdened, which are those renters who spend more than 30% of their income on rental housing. To improve relevance, only the largest 75 metropolitan areas with complete data were included in the analysis.
References
- Zillow Rental Manager. (2024). US Rental Market. Retrieved on May 12, 2024 from https://www.zillow.com/rental-manager/market-trends/united-states/.
- U.S. Census Bureau and U.S. Department of Housing and Urban Development. (2024, March). New Privately-Owned Housing Units Completed: Units in Buildings with 5 Units or More. Retrieved on May 12, 2024 from https://fred.stlouisfed.org/series/COMPU5MUSA.
- Airgood-Obrycki, Whitney; Wedeen, Sophia. Joint Center For Housing Studies of Harvard University. (2024, January 25). Housing Perspectives. Retrieved on May 12, 2024 from https://www.jchs.harvard.edu/blog/six-takeaways-americas-rental-housing-2024.
- U.S. Department of Housing and Urban Development. Home Rent Limits. Retrieved on May 12, 2024 from https://www.huduser.gov/portal/datasets/HOME-Rent-limits.html.
- Clark, William A.V. National Library of Medicine, National Center for Biotechnology Information. (2015, December 21). Do women delay family formation in expensive housing markets?. Retrieved on May 12, 2024 from https://www.ncbi.nlm.nih.gov/pmc/articles/PMC4685765/.
- National Association of Realtors. (2024). Highlights From the Profile of Home Buyers and Sellers. Retrieved on May 12, 2024 from https://www.nar.realtor/research-and-statistics/research-reports/highlights-from-the-profile-of-home-buyers-and-sellers.
- The White House. (2023, March 9). FACT SHEET: President Biden’s Budget Lowers Housing Costs and Expands Access to Affordable Rent and Home Ownership. Retrieved on May 12, 2024 from https://www.whitehouse.gov/omb/briefing-room/2023/03/09/fact-sheet-president-bidens-budget-lowers-housing-costs-and-expands-access-to-affordable-rent-and-home-ownership/.
- U.S. Census Bureau. (2024). Housing Vacancies and Homeownership. Retrieved on May 12, 2024 from https://www.census.gov/housing/hvs/index.html.
- U.S. Census Bureau. (2022). 2022 ACS 1-year Estimates. Retrieved on May 12, 2024 from https://www.census.gov/programs-surveys/acs/technical-documentation/table-and-geography-changes/2022/1-year.html.
- U.S. Department of Housing and Urban Development. (2024). 50th Percentile Rent Estimates. Retrieved on May 12, 2024 from https://www.huduser.gov/portal/datasets/50per.html.