Cities With the Largest Increase in Home Prices Over the Last Decade
Note: This is the most recent release of our Cities With the Largest Increase in Home Prices Over the Last Decade study. To see data from previous years, please visit the Full Results section below.
While the real estate market appears to finally be cooling down, home price growth has been a defining economic trend in recent years. Over the past decade, which has included recoveries from both the Great Recession and the COVID-19 recession, U.S. home values grew by more than 100%. In comparison, average hourly earnings saw a modest 41% increase, while the Consumer Price Index rose by just 32%. Consequently, housing affordability has taken a hit, while homeowners have seen substantial gains in their real estate wealth.
Home Price Trends Following Economic Recessions
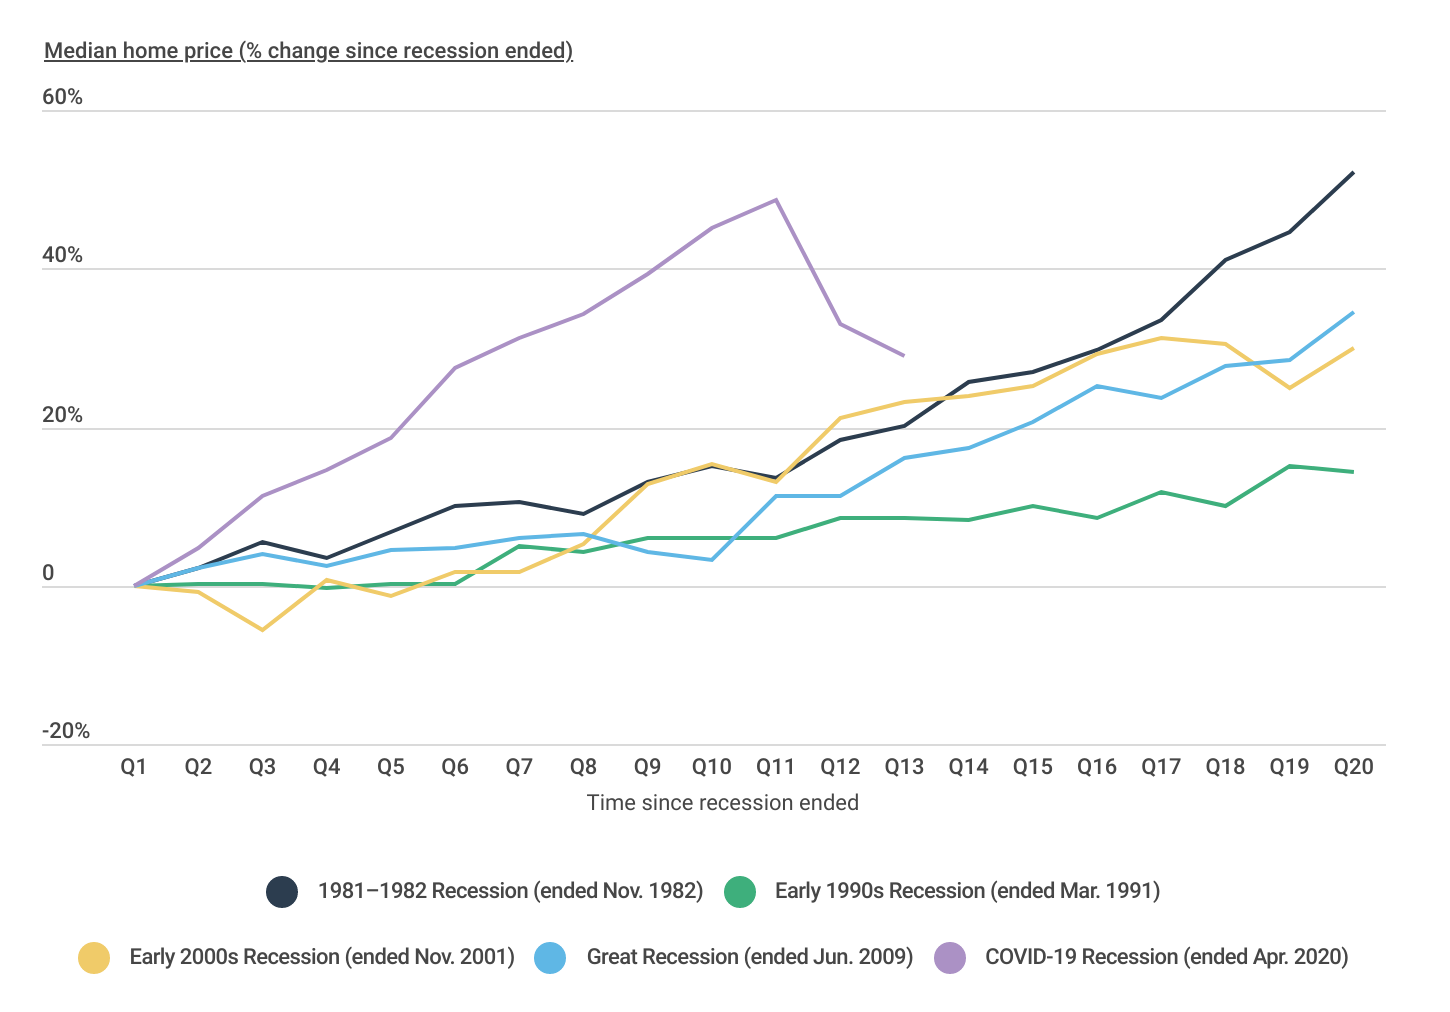
COVID-19 home price growth is beginning to align more closely with historical norms

While recent price increases were amplified by unique factors related to the COVID-19 pandemic, above-average home price growth is a recurring trend in the aftermath of economic recessions. Following previous downturns, U.S. housing experienced robust upswings, with median prices increasing by an average of 32.7% over a five-year period. Although the brief COVID-19 recession led to an unprecedented 49% national increase from 2020 to 2022, prices have since stabilized, aligning the recovery more closely with historical norms.
However, despite a recent decline in sale prices, the confluence of persistent inflation eroding purchasing power and mortgage rates exceeding 7% has offset any potential relief for aspiring homebuyers. Consequently, monthly housing costs have recently hit a historic peak, deterring would-be buyers and causing a 12% year-over-year decline in home sales.
Home Price Growth by City & State
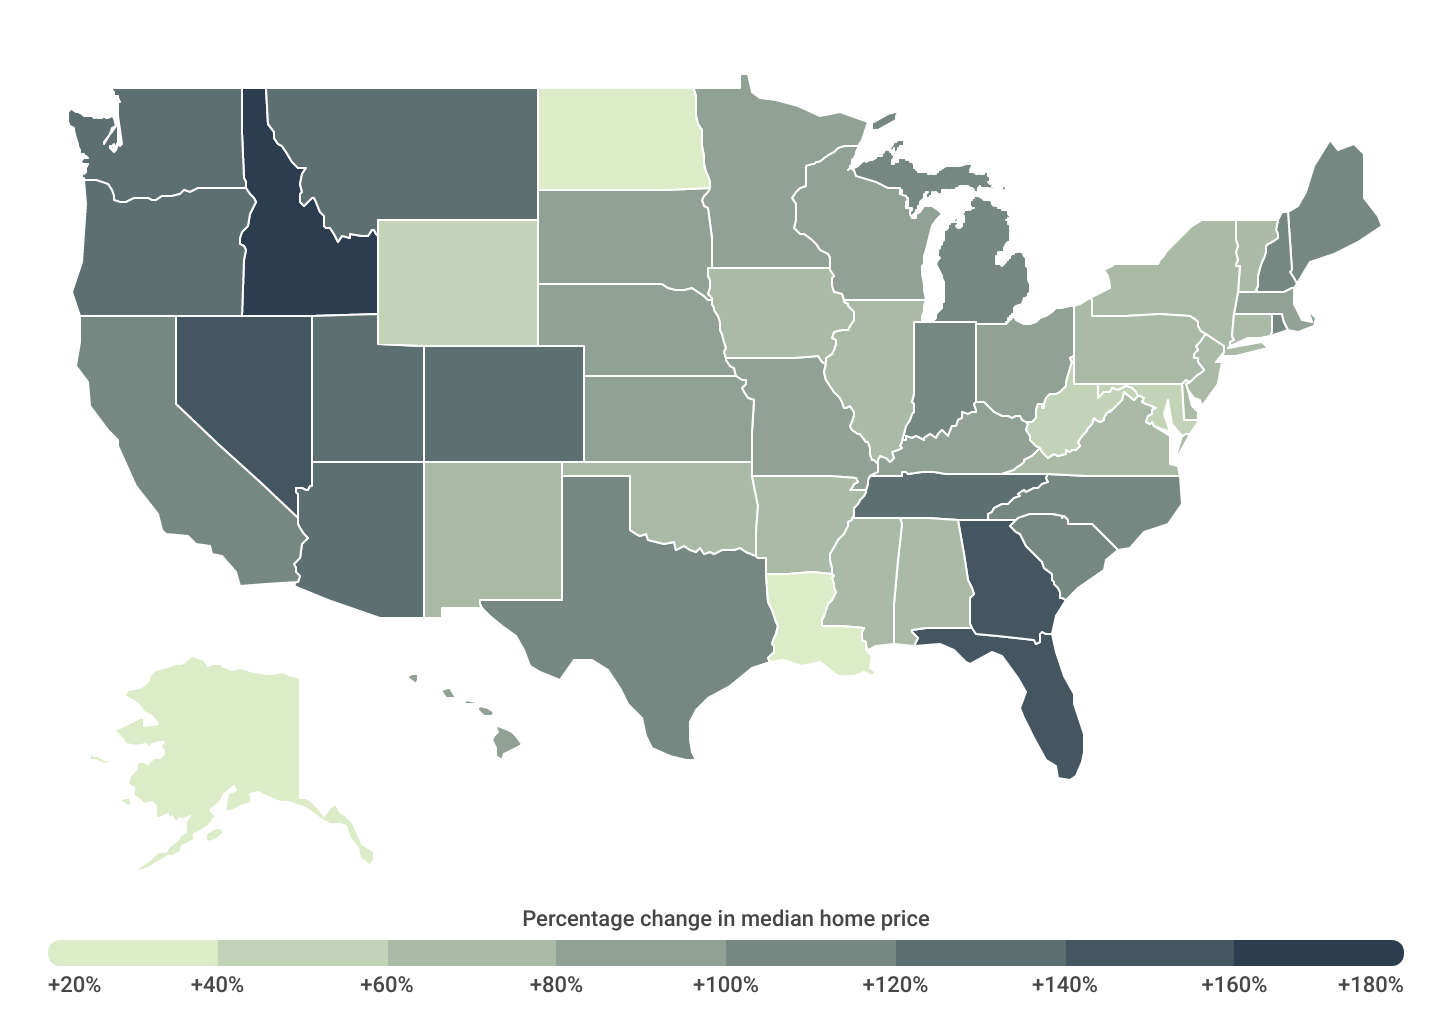
Idaho & Florida saw the most significant home price growth over the past decade

The trajectory of economic recovery post-recession is uneven across the nation, and this trend has held true in the wake of both the Great Recession and the COVID-19 pandemic. The most substantial increases in home prices have been concentrated in Western states and select states in the Southeast. Since 2013, Idaho and Florida have witnessed the most significant growth, with median home prices increasing by 165.0% and 158.5%, respectively. Other top states include Nevada (+142.6%), Georgia (+141.2%), Washington (+136.9%), Utah (+135.4%), and Arizona (+134.8%).
Conversely, Louisiana (+29.5%), North Dakota (+32.5%), and Alaska (+37.6%) saw home price growth barely keeping pace with inflation over the past decade. Generally, the Midwest, along with certain pockets of the South and Northeast, reported the slowest growth in home prices nationally during this period.
At the city level, locations in Florida notably stand out for their remarkable surge in home prices. For instance, in Miami Gardens, FL, median home prices skyrocketed from approximately $106,000 in 2013 to nearly $436,000 today, marking a 312% increase. Eight Florida cities reported price increases of over 200%—roughly twice the national average—over the past decade.
Below is a complete breakdown of 10-year home price growth across America’s major cities and all 50 states. The analysis was conducted by Construction Coverage using data from Zillow.
Large Cities With the Most Home Price Growth
| Top Cities | Change* |
|---|---|
| 1. Detroit, MI | +217.9% |
| 2. Tampa, FL | +206.8% |
| 3. Dallas, TX | +175.0% |
| 4. Phoenix, AZ | +160.4% |
| 5. Nashville, TN | +155.6% |
| 6. Fort Worth, TX | +152.7% |
| 7. Jacksonville, FL | +151.9% |
| 8. Arlington, TX | +151.3% |
| 9. Charlotte, NC | +151.0% |
| 10. Aurora, CO | +148.5% |
| 11. Columbus, OH | +148.1% |
| 12. Atlanta, GA | +147.8% |
| 13. Indianapolis, IN | +147.0% |
| 14. Memphis, TN | +145.9% |
| 15. Mesa, AZ | +144.5% |
| Bottom Cities | Change* |
|---|---|
| 1. Washington, DC | +47.2% |
| 2. San Francisco, CA | +53.0% |
| 3. Virginia Beach, VA | +55.4% |
| 4. New Orleans, LA | +56.3% |
| 5. New York, NY | +56.5% |
| 6. Chicago, IL | +59.6% |
| 7. El Paso, TX | +71.0% |
| 8. Minneapolis, MN | +73.5% |
| 9. Boston, MA | +76.7% |
| 10. Baltimore, MD | +77.7% |
| 11. Louisville, KY | +79.7% |
| 12. Wichita, KS | +84.2% |
| 13. Portland, OR | +85.8% |
| 14. Philadelphia, PA | +90.9% |
| 15. Oklahoma City, OK | +91.1% |
Midsize Cities With the Most Home Price Growth
| Top Cities | Change* |
|---|---|
| 1. Kansas City, KS | +257.4% |
| 2. St. Petersburg, FL | +212.7% |
| 3. Port St. Lucie, FL | +208.6% |
| 4. Hialeah, FL | +207.3% |
| 5. San Bernardino, CA | +205.4% |
| 6. Tacoma, WA | +176.5% |
| 7. Garland, TX | +175.6% |
| 8. Buffalo, NY | +174.5% |
| 9. Grand Rapids, MI | +174.2% |
| 10. Stockton, CA | +173.6% |
| 11. Lancaster, CA | +173.2% |
| 12. Hollywood, FL | +170.7% |
| 13. Palmdale, CA | +169.4% |
| 14. Boise City, ID | +167.7% |
| 15. Orlando, FL | +165.0% |
| Bottom Cities | Change* |
|---|---|
| 1. Shreveport, LA | +13.4% |
| 2. Anchorage, AK | +31.4% |
| 3. Little Rock, AR | +40.3% |
| 4. Arlington, VA | +40.6% |
| 5. Baton Rouge, LA | +41.7% |
| 6. Alexandria, VA | +45.6% |
| 7. Montgomery, AL | +46.9% |
| 8. Honolulu, HI | +48.9% |
| 9. Columbus, GA | +57.8% |
| 10. Chesapeake, VA | +58.1% |
| 11. Norfolk, VA | +59.9% |
| 12. Yonkers, NY | +61.4% |
| 13. Lubbock, TX | +61.9% |
| 14. Newport News, VA | +63.0% |
| 15. Laredo, TX | +63.6% |
Small Cities With the Most Home Price Growth
| Top Cities | Change* |
|---|---|
| 1. Miami Gardens, FL | +312.1% |
| 2. Lehigh Acres, FL | +277.4% |
| 3. Palm Bay, FL | +219.3% |
| 4. Spring Hill, FL | +219.1% |
| 5. Nampa, ID | +200.6% |
| 6. Warren, MI | +188.5% |
| 7. West Palm Beach, FL | +187.4% |
| 8. Lakeland, FL | +186.5% |
| 9. Hesperia, CA | +183.8% |
| 10. Mesquite, TX | +180.3% |
| 11. Victorville, CA | +179.5% |
| 12. Clearwater, FL | +177.5% |
| 13. Inglewood, CA | +172.3% |
| 14. Elizabeth, NJ | +169.4% |
| 15. Brandon, FL | +166.7% |
| Bottom Cities | Change* |
|---|---|
| 1. Lafayette, LA | +18.0% |
| 2. Springfield, IL | +26.8% |
| 3. Peoria, IL | +29.1% |
| 4. Metairie, LA | +37.3% |
| 5. Beaumont, TX | +42.9% |
| 6. Columbia, MD | +44.1% |
| 7. Midland, TX | +45.3% |
| 8. Davenport, IA | +48.5% |
| 9. Stamford, CT | +51.3% |
| 10. Cedar Rapids, IA | +53.0% |
| 11. Naperville, IL | +53.6% |
| 12. Tuscaloosa, AL | +54.9% |
| 13. Albany, NY | +56.3% |
| 14. Fargo, ND | +60.8% |
| 15. Norman, OK | +63.7% |
States With the Most Home Price Growth
| Top States | Change* |
|---|---|
| 1. Idaho | +165.0% |
| 2. Florida | +158.5% |
| 3. Nevada | +142.6% |
| 4. Georgia | +141.2% |
| 5. Washington | +136.9% |
| 6. Utah | +135.4% |
| 7. Arizona | +134.8% |
| 8. Montana | +127.1% |
| 9. Tennessee | +126.7% |
| 10. Colorado | +125.0% |
| 11. Oregon | +120.3% |
| 12. Maine | +114.4% |
| 13. New Hampshire | +113.1% |
| 14. Michigan | +112.6% |
| 15. California | +111.8% |
*Percentage change in median home price
| Bottom States | Change* |
|---|---|
| 1. Louisiana | +29.5% |
| 2. North Dakota | +32.5% |
| 3. Alaska | +37.6% |
| 4. West Virginia | +55.7% |
| 5. Maryland | +58.7% |
| 6. Wyoming | +59.9% |
| 7. Mississippi | +61.6% |
| 8. Connecticut | +61.8% |
| 9. Virginia | +65.3% |
| 10. Pennsylvania | +66.3% |
| 11. Iowa | +68.0% |
| 12. Arkansas | +68.9% |
| 13. Illinois | +70.2% |
| 14. New York | +72.2% |
| 15. Delaware | +73.5% |
TRENDING
Do you run a construction business? Make sure to have the right tools for the job. The best construction project management software will help streamline your workflow. The best workers’ compensation insurance companies will provide financial protection for your employees and your business.
Methodology
The data used in the study comes from Zillow. To find the cities with the largest increase in home prices, researchers at Construction Coverage compared each city’s median home price in 2013 and 2023. Cities were then ordered by their respective percentage change in median home price over those 10 years. For relevance, cities were broken into three cohorts based on population:
- Large: Cities with 350,000 or more people
- Midsize: Cities with 150,000–349,999 people
- Small: Cities with 100,000–149,999 people
Cities with less than 100,000 residents were not included in this analysis. Additionally, researchers used the latest U.S. Census Bureau’s American Community Survey data to find median household income and population data for each city.
References
- U.S. Bureau of Labor Statistics. (2023, October 6). Employment Situation: Average Hourly Earnings of All Employees, Total Private [Data set]. https://fred.stlouisfed.org/series/CES0500000003
- U.S. Bureau of Labor Statistics. (2023, October 12). Consumer Price Index for All Urban Consumers: All Items in U.S. City Average [Data set]. https://fred.stlouisfed.org/series/CPIAUCSL
- Board of Governors of the Federal Reserve System. (2023, September 8). Financial Accounts of the United States [Data set]. https://www.federalreserve.gov/releases/z1/dataviz/z1/balance_sheet/chart/#series:nonfinancial-assets;units:usd
- Anderson, D. (2023, September 14). Housing Market Update: Monthly Housing Costs Hit All-Time High, Deterring Would-Be Buyers. Redfin. https://www.redfin.com/news/housing-market-update-monthly-mortgage-payments-record-high/
- Zillow. (2023, September). Zillow Home Value Index (ZHVI) [Data set]. https://www.zillow.com/research/data/
- U.S. Census Bureau. (2023, September 26). 2022 American Community Survey 1-Year Estimates [Data set]. https://www.census.gov/programs-surveys/acs
Full Results
Each company featured in our guides has been independently selected and reviewed by our research team. If you select one of these companies and click on a link, we may earn a commission.
By clicking on these links, you may be taken to one of our insurance partners. The specific company listed here may or may not be included in our partner’s network at this time.
