
Cities With the Most Cost-Burdened Households
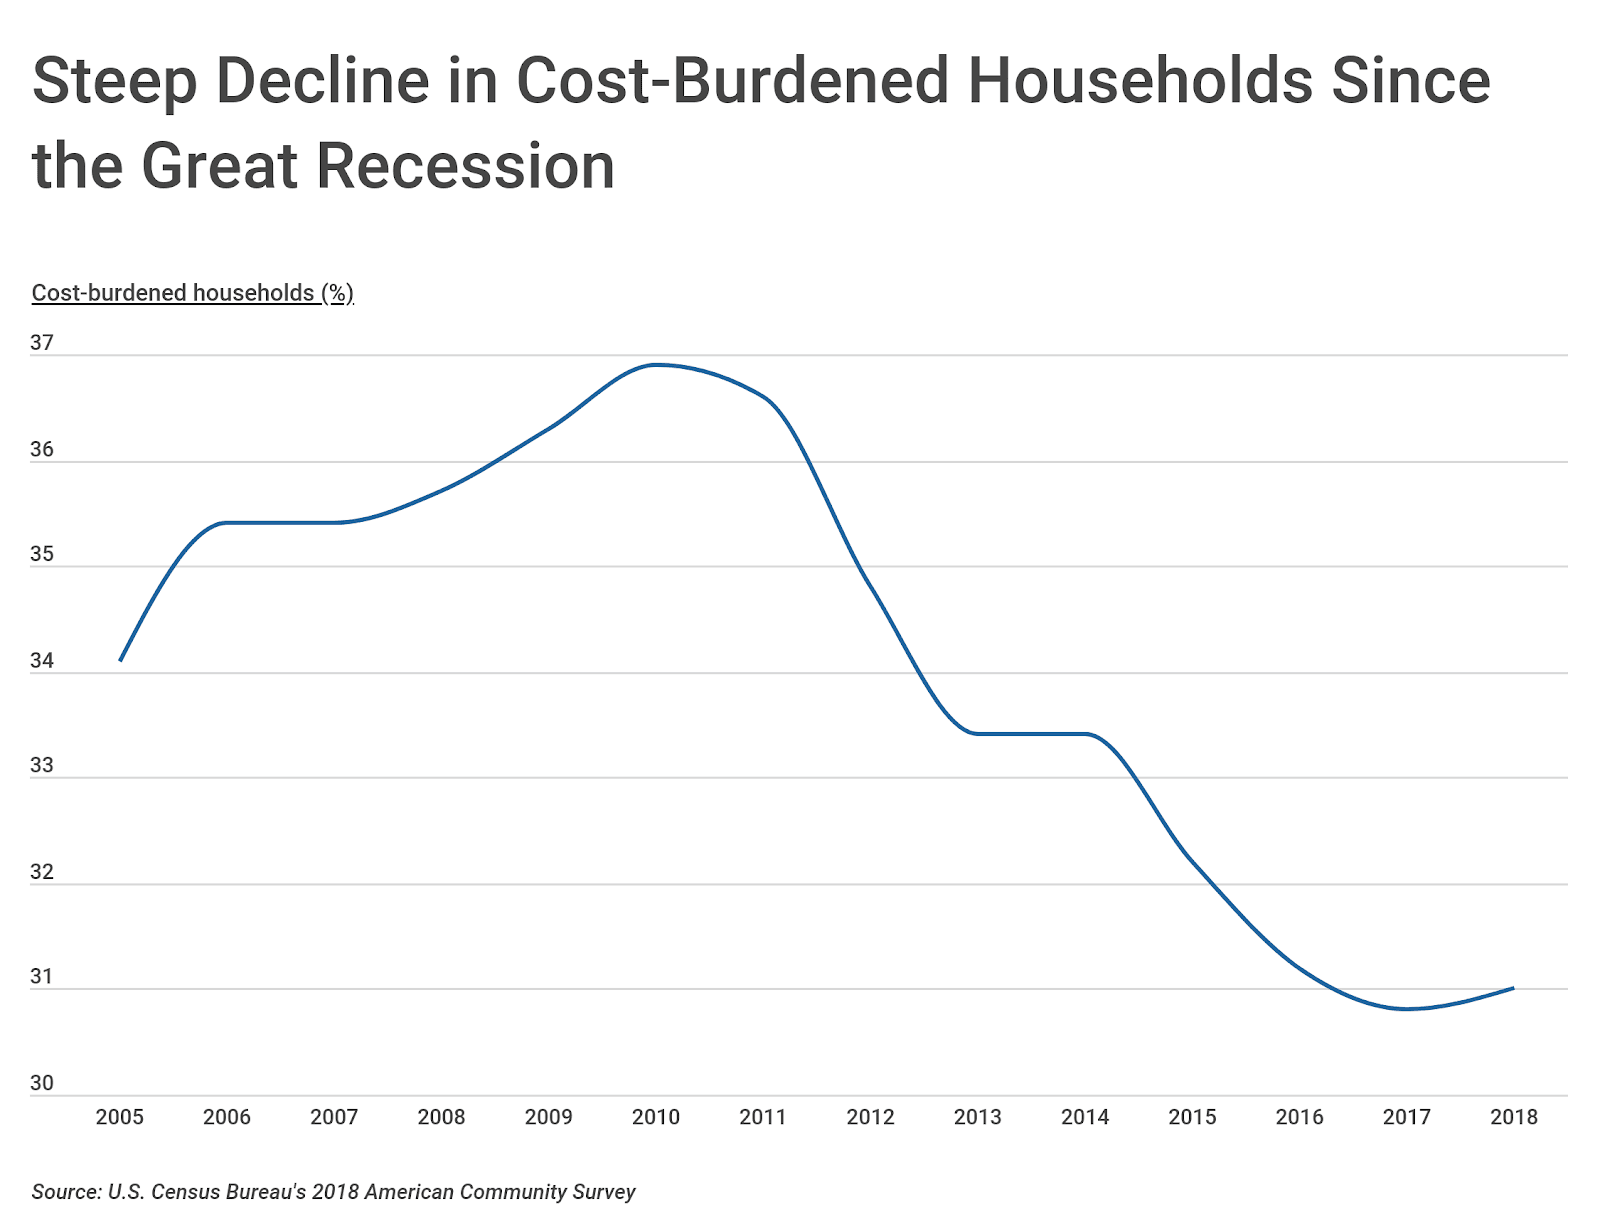
According to the most recent data from the U.S. Census Bureau, almost one-third of American households are considered cost-burdened, meaning they spend 30 percent or more of their income on housing costs. While this figure has declined by almost 6 percentage points following the Great Recession, it is likely to increase again as the U.S. faces an unprecedented economic downturn due to the Coronavirus pandemic. Millions of Americans have experienced loss of work or other financial hardships due to the ongoing economic shutdown. Those households who already spend more than 30 percent of their income on housing are especially vulnerable.
Fortunately, many mortgage lenders are offering options to defer mortgage payments, and the federal government is pausing foreclosures and evictions on mortgages backed by Fannie Mae and Freddie Mac or the Federal Housing Administration. Renters face a more uncertain situation—in most cities it will be up to individual landlords to work out payment options for renters unable to pay rent.
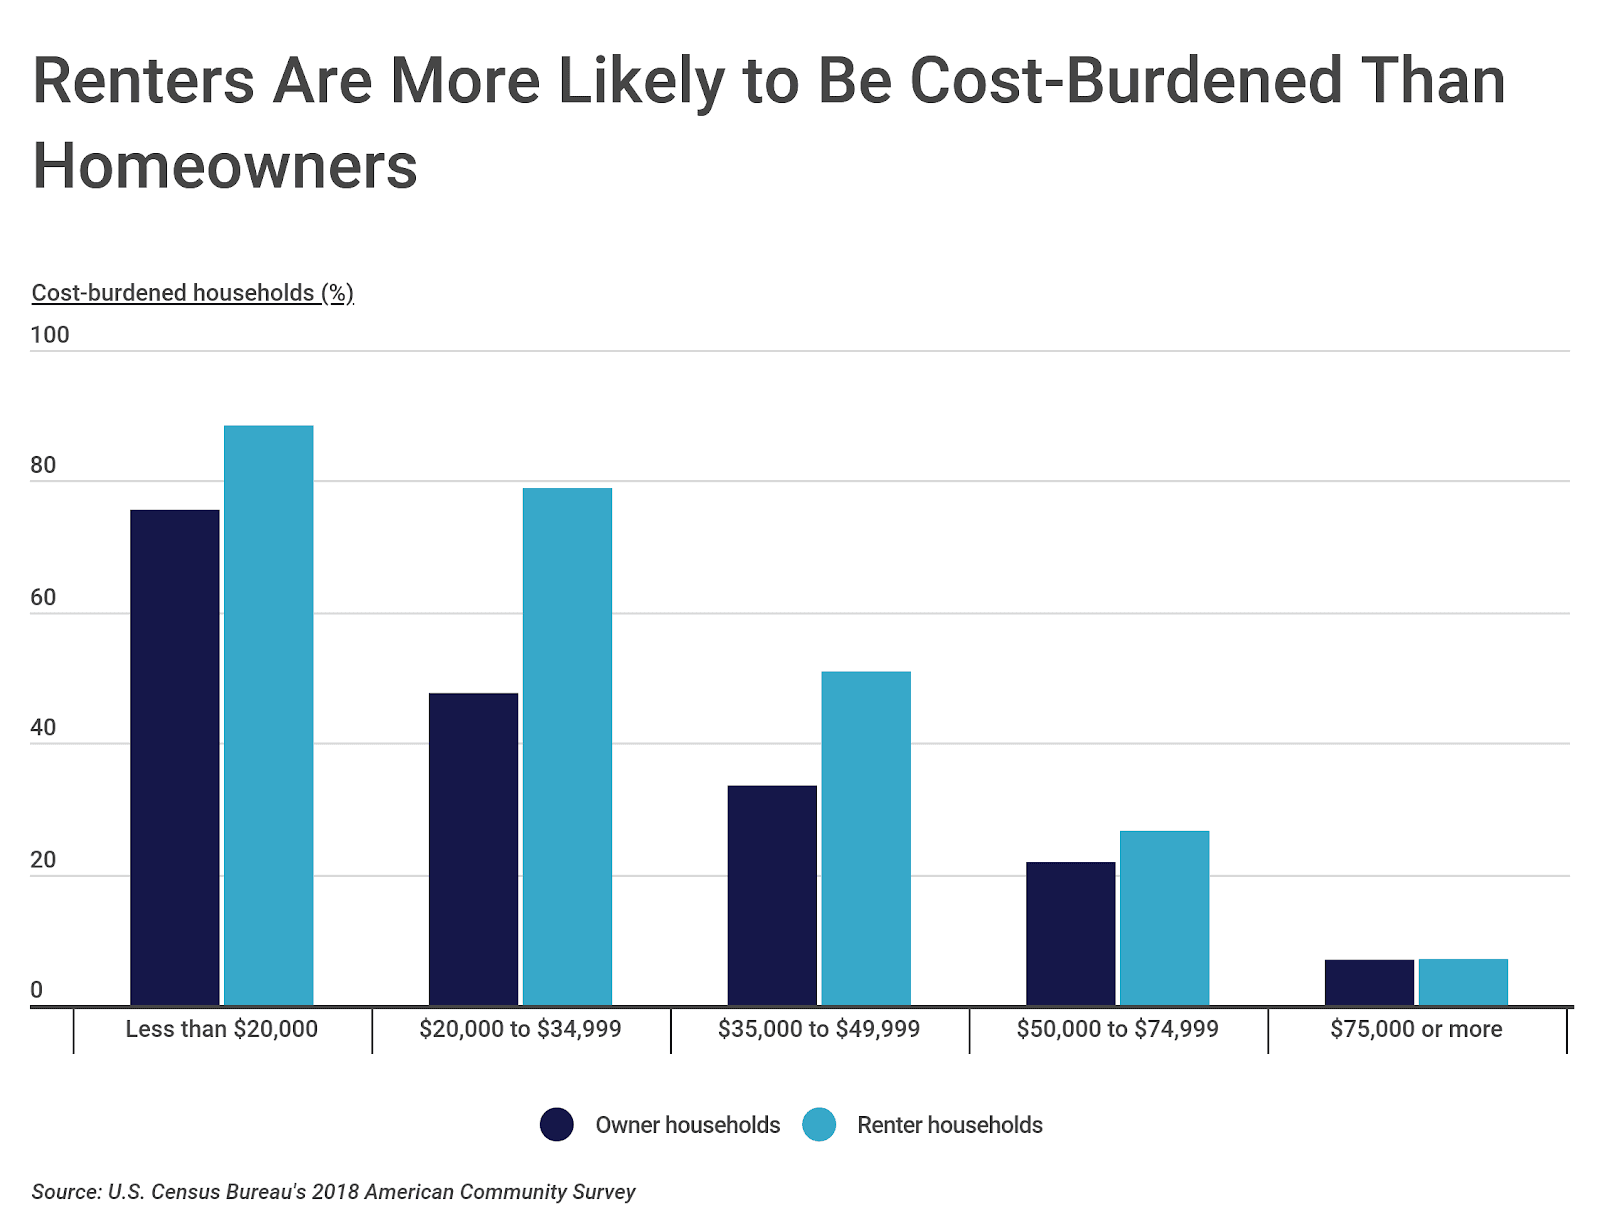
While nearly one-third of all households are cost-burdened, renters are more likely to be than homeowners. Nationally, over 46 percent of renter households are cost-burdened compared to just 22.3 percent of owner households. This holds true across all income groups with the exception of those households making $75,000 or more. Renters may be doubly hurt in the current economic crisis due to their increased likelihood of being cost-burdened and not having the same financial protections as homeowners.
TRENDING ON CONSTRUCTION COVERAGE
Getting ready for a new construction project? Make sure to review our top picks for the best takeoff software and best estimating software before starting.
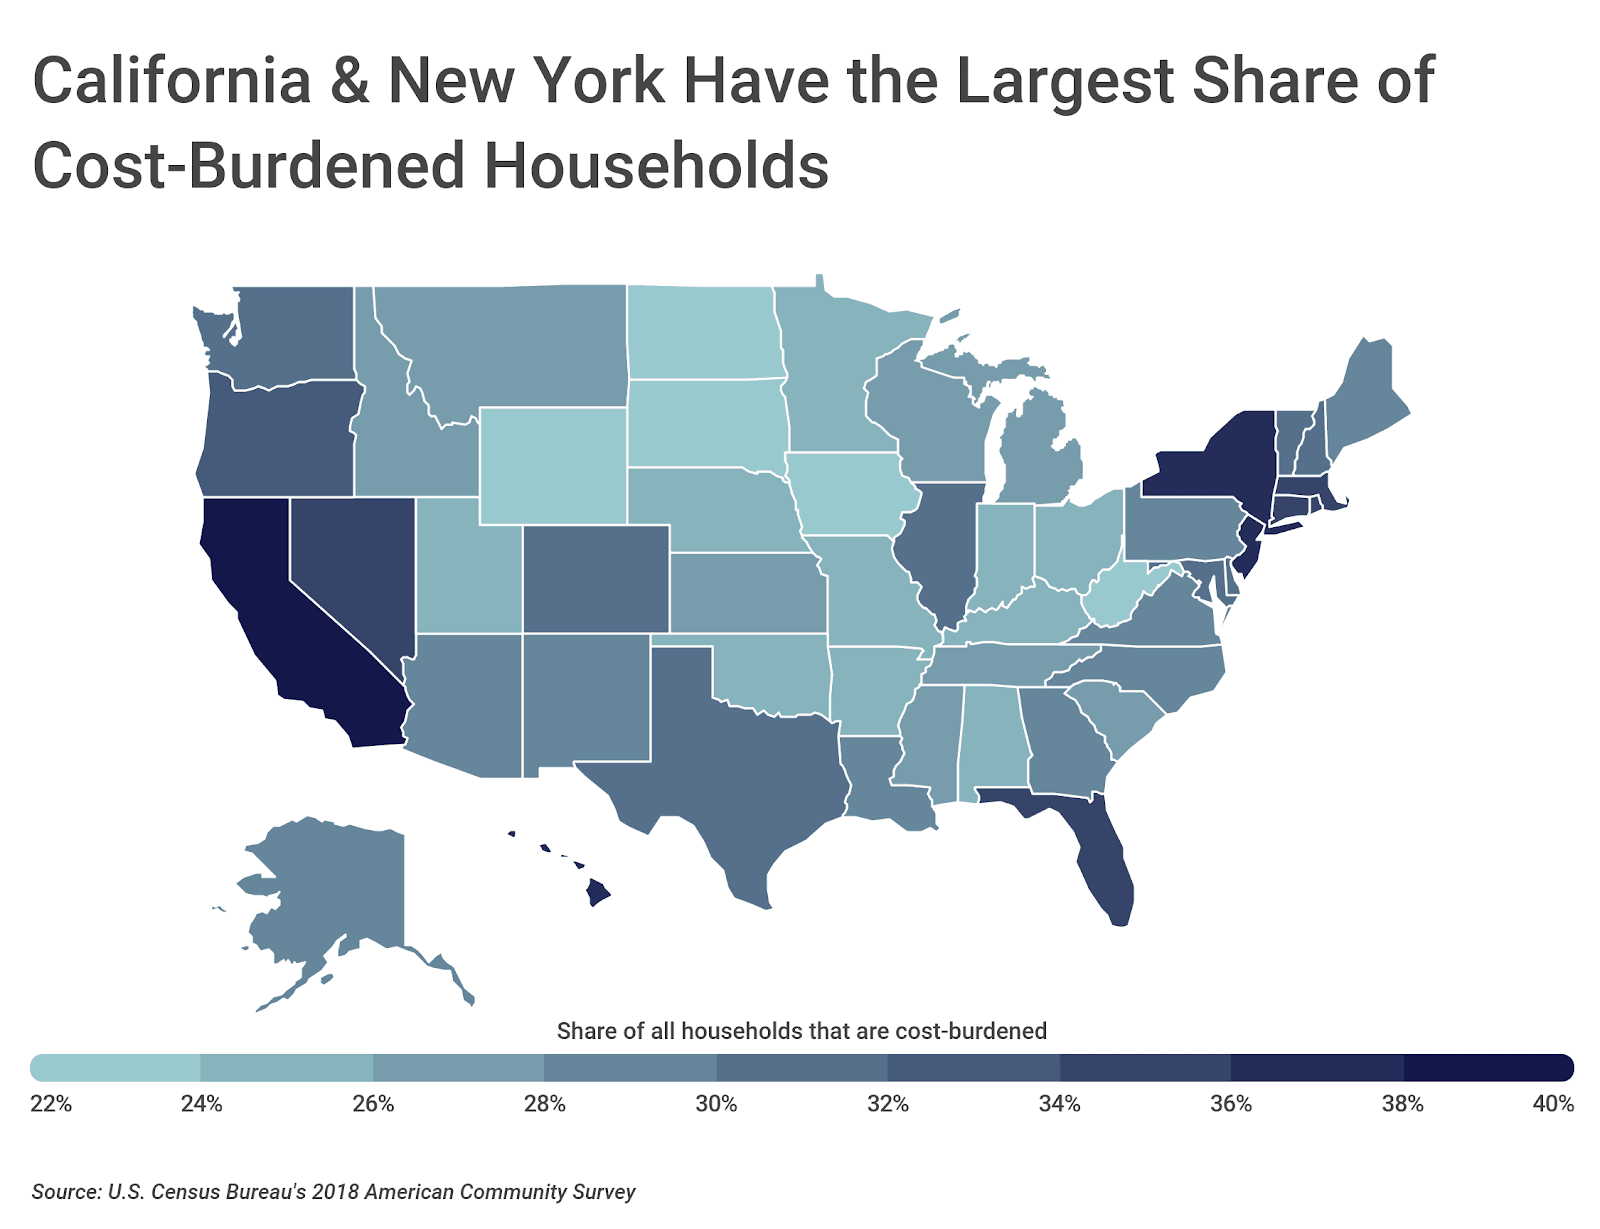
Due to differences in housing costs and job markets across the country, the numbers of cost-burdened households vary significantly across cities and states. At the state level, California and New York have the largest shares of cost-burdened households in the country, at 40.5 and 37.5 percent, respectively. North Dakota claims the lowest share of households that are cost-burdened, at 22 percent.
To determine the cities with the most cost-burdened households, researchers at Construction Coverage, a review website for construction project management software and insurance, analyzed the latest data from the U.S. Census Bureau. The researchers ranked cities according to the share of all households that are cost-burdened. Researchers also calculated the share of owner households that are cost-burdened, the share of renter households that are cost-burdened, median monthly housing costs, and median household income.
To improve relevance, only cities with at least 100,000 people were included in the analysis. Additionally, cities were grouped into the following cohorts based on population size:
- Small cities: 100,000-150,000
- Midsize cities: 150,000-350,000
- Large cities: more than 350,000
Here are the cities with the most cost-burdened households.
15 Large Cities With the Most Cost-Burdened Households

15. Chicago, IL
- Share of all households that are cost-burdened: 39.4%
- Share of owner households that are cost-burdened: 31.8%
- Share of renter households that are cost-burdened: 45.8%
- Median monthly housing costs: $1,230
- Median household income: $57,238
14. Bakersfield, CA
- Share of all households that are cost-burdened: 39.8%
- Share of owner households that are cost-burdened: 29.6%
- Share of renter households that are cost-burdened: 54.5%
- Median monthly housing costs: $1,243
- Median household income: $60,002
TRENDING ON CONSTRUCTION COVERAGE
Even if you are a homeowner, you might still need builders risk insurance for renovations. It depends on your contract with the builder and the size of the project.

13. Detroit, MI
- Share of all households that are cost-burdened: 40.1%
- Share of owner households that are cost-burdened: 28.3%
- Share of renter households that are cost-burdened: 50.6%
- Median monthly housing costs: $696
- Median household income: $31,283

12. Aurora, CO
- Share of all households that are cost-burdened: 40.3%
- Share of owner households that are cost-burdened: 27.7%
- Share of renter households that are cost-burdened: 59.0%
- Median monthly housing costs: $1,375
- Median household income: $63,128

11. Boston, MA
- Share of all households that are cost-burdened: 40.5%
- Share of owner households that are cost-burdened: 28.2%
- Share of renter households that are cost-burdened: 46.9%
- Median monthly housing costs: $1,752
- Median household income: $71,834

10. Memphis, TN
- Share of all households that are cost-burdened: 40.6%
- Share of owner households that are cost-burdened: 24.6%
- Share of renter households that are cost-burdened: 54.5%
- Median monthly housing costs: $870
- Median household income: $37,199

9. Oakland, CA
- Share of all households that are cost-burdened: 40.7%
- Share of owner households that are cost-burdened: 32.1%
- Share of renter households that are cost-burdened: 46.7%
- Median monthly housing costs: $1,690
- Median household income: $76,469
TRENDING ON CONSTRUCTION COVERAGE
Many people are surprised to learn that they should have a commercial auto insurance policy. Fortunately, our researchers found the best insurance for commercial vehicles and current cost benchmarks for commercial auto policies.

8. Fresno, CA
- Share of all households that are cost-burdened: 42.9%
- Share of owner households that are cost-burdened: 26.2%
- Share of renter households that are cost-burdened: 56.1%
- Median monthly housing costs: $1,084
- Median household income: $49,813

7. San Diego, CA
- Share of all households that are cost-burdened: 43.1%
- Share of owner households that are cost-burdened: 30.8%
- Share of renter households that are cost-burdened: 53.9%
- Median monthly housing costs: $1,811
- Median household income: $79,646

6. Anaheim, CA
- Share of all households that are cost-burdened: 43.5%
- Share of owner households that are cost-burdened: 29.0%
- Share of renter households that are cost-burdened: 57.2%
- Median monthly housing costs: $1,696
- Median household income: $76,154

5. New York, NY
- Share of all households that are cost-burdened: 44.7%
- Share of owner households that are cost-burdened: 33.8%
- Share of renter households that are cost-burdened: 50.0%
- Median monthly housing costs: $1,494
- Median household income: $63,799

4. New Orleans, LA
- Share of all households that are cost-burdened: 45.2%
- Share of owner households that are cost-burdened: 33.4%
- Share of renter households that are cost-burdened: 56.1%
- Median monthly housing costs: $997
- Median household income: $38,423

3. Long Beach, CA
- Share of all households that are cost-burdened: 46.2%
- Share of owner households that are cost-burdened: 36.4%
- Share of renter households that are cost-burdened: 53.0%
- Median monthly housing costs: $1,466
- Median household income: $61,610

2. Los Angeles, CA
- Share of all households that are cost-burdened: 50.4%
- Share of owner households that are cost-burdened: 39.9%
- Share of renter households that are cost-burdened: 56.5%
- Median monthly housing costs: $1,627
- Median household income: $62,474

1. Miami, FL
- Share of all households that are cost-burdened: 52.1%
- Share of owner households that are cost-burdened: 36.3%
- Share of renter households that are cost-burdened: 59.1%
- Median monthly housing costs: $1,202
- Median household income: $41,818
Detailed Findings & Methodology
Although Miami claims the top spot, seven out of the 15 large cities with the most cost-burdened households are located in California. With an average cost-burden rate of over 43 percent, these 15 large cities might be especially vulnerable during times of economic crisis. Compared to the national figures, these cities have higher average monthly housing costs—$1,349 compared to the national median of $1,082—and a lower average median household income—$58,059 compared to the national median of $61,937.
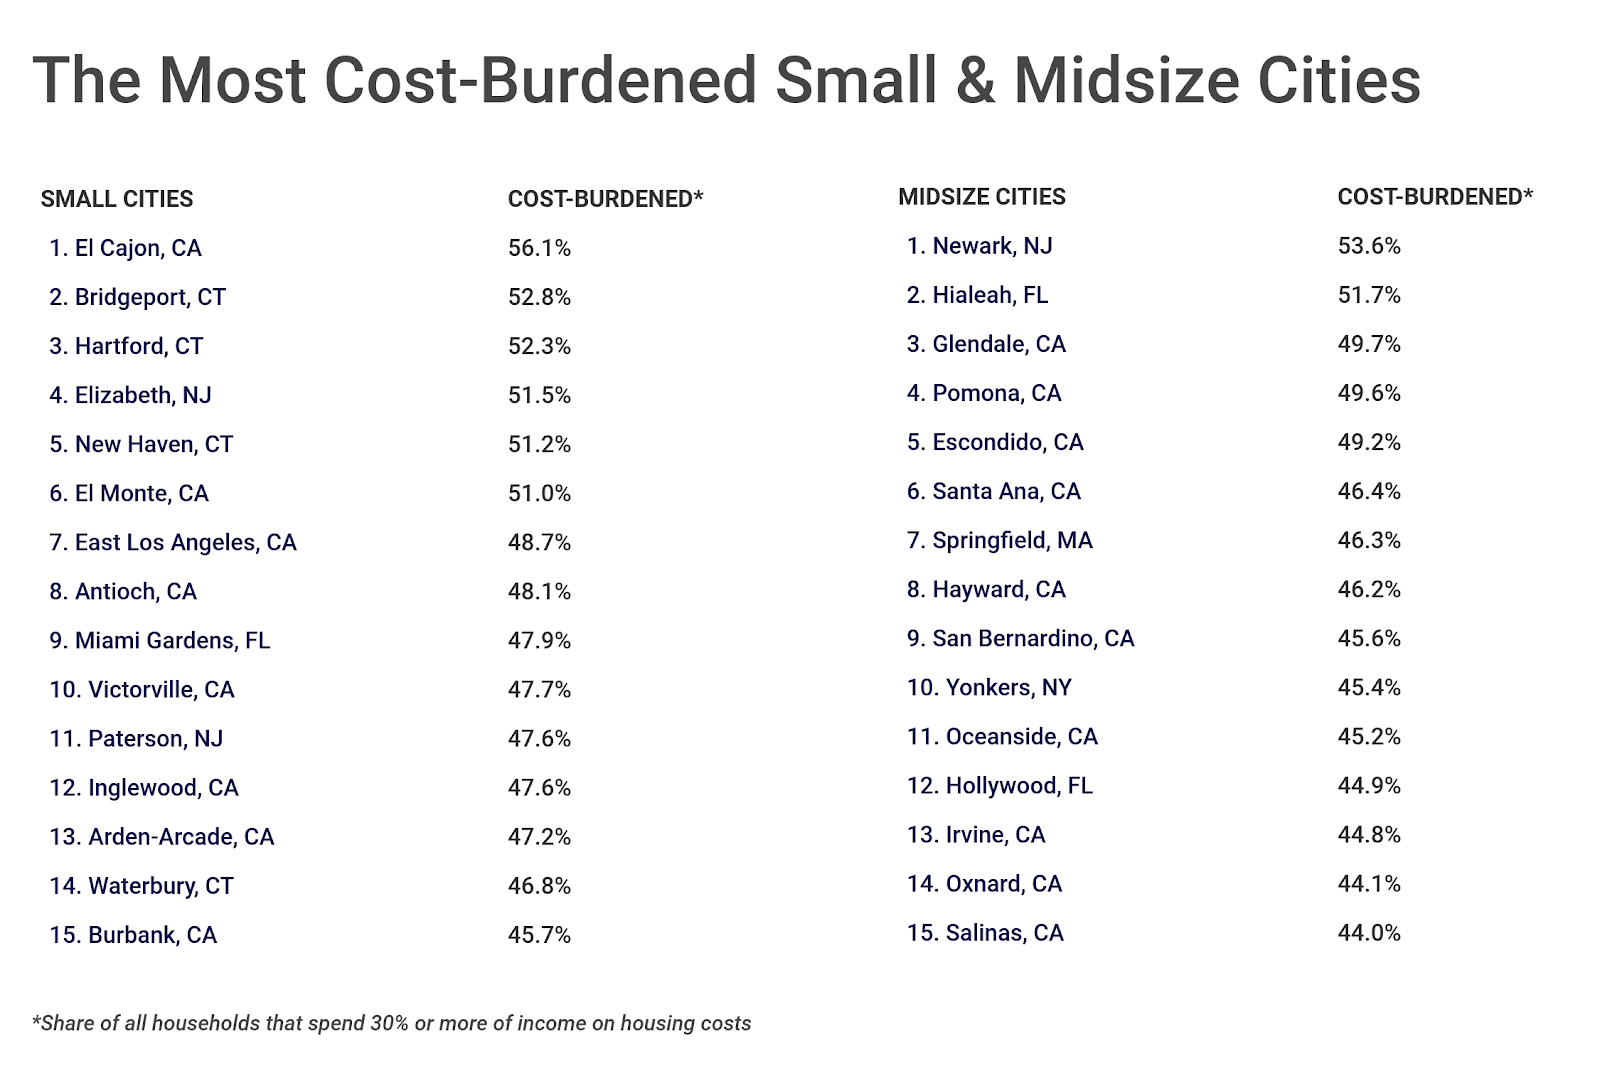
Many of the small and midsize cities with the most cost-burdened households are located in California and the Northeast. Similar to the large cities, these cities also tend to have higher monthly housing costs as well as lower median households incomes, making housing more difficult to afford.
To determine the cities with the most cost-burdened households, researchers at Construction Coverage analyzed the data from the U.S. Census Bureau’s 2018 American Community Survey (ACS). Using ACS data, the researchers ranked cities according to the share of households who spend 30 percent of more of their income on housing costs. In the event of a tie, the city with the larger number of cost-burdened households was ranked higher. The share of owner households that are cost-burdened, the share of renter households that are cost-burdened, median monthly housing costs, and median household income are also from the ACS.
To improve relevance, only cities with at least 100,000 people were included in the analysis. Additionally, cities were grouped into the following cohorts based on population size:
- Small cities: 100,000-150,000
- Midsize cities: 150,000-350,000
- Large cities: more than 350,000