How Much Does Commercial Auto Insurance Cost in 2026?
In 2026, commercial auto insurance for a light-duty vehicle typically costs $250 to $400 per month. Because pricing is not standardized, your final rate will depend directly on your specific trade, vehicle weight class, business use, driver history, operating radius, and state-level risks.
This guide covers current pricing benchmarks for businesses in 2026, how insurers price commercial auto policies, what drives premium differences between trades and vehicle classes, and how construction businesses can evaluate whether their renewal pricing is reasonable.
Scope of This Guide: Light-to-Medium-Duty vs. Heavy-Duty Vehicles
This guide focuses on light- to medium-duty commercial auto vehicles. These are the vehicles most commonly used by construction and service businesses for daily operations, including:
- Passenger vehicles and SUVs
Used for estimating, supervision, and site visits. - Cargo and work vans
Common for service-based trades transporting tools and equipment. - Light-duty pickup trucks
Standard pickups typically rated below medium-duty thresholds. - Light box trucks
Used for local delivery of materials and equipment.
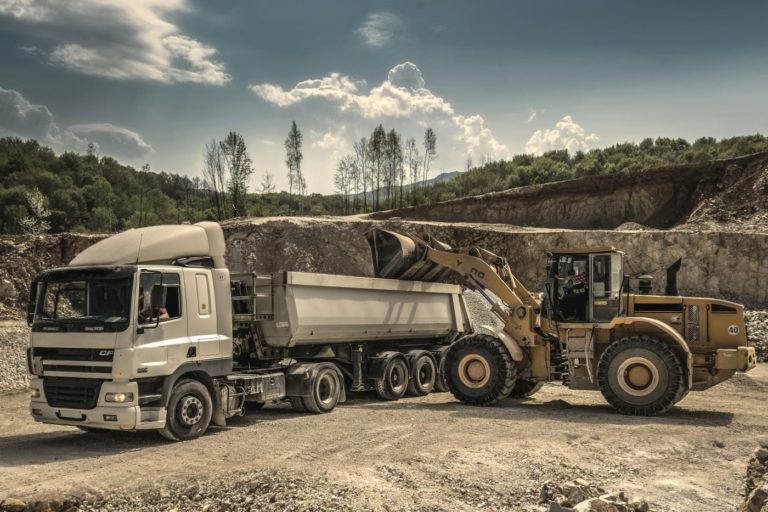
Vehicles above this range—such as dump trucks, semi-tractors, or dedicated hauling units—are insured under commercial trucking programs, which follow different rating rules and regulatory requirements. Learn more in our guide to commercial truck insurance.
Key Takeaways
- Most light-duty contractor vehicles cost $250 to $400 per month for commercial auto insurance in 2026. Passenger vehicles and cargo vans sit at the low end, while pickups and box trucks cost more due to towing exposure and higher claim severity.
- Trade classification and operational risk matter more than vehicle brand when insurers calculate commercial auto insurance cost.
- Location and business age materially change pricing. New ventures typically pay 30–50% more, and high-litigation states such as Florida, Louisiana, New York, and New Jersey can run 30–100% above national averages.
- Even clean fleets are seeing 7%–15% rate increases in 2026. Rising litigation severity and vehicle repair inflation are increasing base rates across the commercial auto market.
Estimated Total Fleet Cost
$0 – $0 / mo
Average $0 – $0 per vehicle
| Company | Best For | AM Best Rating | Get Quote |
|---|---|---|---|
|
Progressive
|
New ventures and drivers with imperfect records; covers pickups to heavy dump trucks | A+ | |
|
ERGO NEXT
|
Tech-savvy contractors who want fast, fully online quotes and mobile policy management | A+ |
*We may earn a commission when you click through these links.
*Estimates are for informational purposes only. Actual premiums vary by location, driving record, vehicle age, and carrier underwriting.
More Commercial Auto Insurance Guides

Table of Contents
- Average Commercial Auto Costs by Vehicle Type
- Cost by Trade: High-Risk vs. Low-Risk Classifications
- Commercial Auto Insurance Rates by State
- Why Rates Are Rising: Litigation Costs and Repair Inflation
- Hidden Liabilities: HNOA & Unlisted Drivers
- Strategies to Lower Commercial Auto Premiums
- Finding the Lowest-Cost Commercial Auto Insurance
- Examples of Real-World Commercial Auto Pricing
- Hidden Fees to Watch for in Commercial Auto Quotes
- Frequently Asked Questions
- Related Guides
Average Commercial Auto Costs by Vehicle Type
For commercial auto policies, the vehicle itself sets the starting point for pricing. Carriers use the VIN (Vehicle Identification Number) to determine the vehicle’s weight class, construction, safety systems, and expected repair costs. That baseline is then adjusted based on how the vehicle is used and who drives it.
Light-Duty Vehicle Rate Comparison
The table below shows typical monthly premiums per vehicle, based on vehicle type and overall risk profile. Risk profiles are determined by a range of factors, including the drivers’ records, prior claims, location, specific vehicle type (which can affect rates by over 300%), the industry or business use (e.g., construction vs. professional services), operating radius, annual mileage, and the presence of safety technology or telematics.
| Vehicle Classification | Low Risk | Medium Risk | High Risk |
| Passenger / Sales Vehicles (Sedan, SUV) | $180–$210 | $211–$250 | $251–$300+ |
| Cargo Vans (Transit, Sprinter, Express) | $230–$270 | $271–$320 | $321–$390+ |
| Pickup Trucks (Class 1–3) | $260–$300 | $301–$360 | $361–$450+ |
| Light Box Trucks / Straight Trucks | $380–$440 | $441–$550 | $551–$700+ |
Risk Profile Definitions
- Low Risk: Established businesses (3+ years), clean loss runs (no claims), liability-only coverage, and operating in cheaper states (like Idaho, Ohio, or Maine).
- Medium Risk: The average contractor. Standard operations, carrying full coverage (comprehensive and collision) to satisfy a vehicle loan, and operating in a state with average insurance rates.
- High Risk: New ventures (under 3 years in business), structural trades with heavy towing exposure (like roofers or excavators), poor driving records, or operating in high-litigation states (like Florida, New York, or Louisiana).
These estimated ranges assume a standard $1,000,000 Combined Single Limit (CSL) for liability, which is the baseline requirement for most commercial contracts and jobs. Rates reflect average market pricing across most states, but businesses operating in high-litigation or high-theft areas (such as Florida, New York, or Louisiana) can easily exceed these benchmarks.
Passenger and Sales Vehicles
Vehicles used for estimating, supervision, or site visits typically carry the lowest premiums. When these vehicles are not used to haul materials or tow trailers, accident severity and third-party damage are less likely.
If these vehicles are used for business and display company branding, they must be insured on a commercial policy (or at least be covered by a business-use endorsement added to their personal policy). Using a personal auto policy without an endorsement for business use increases the risk of claim denial. To better understand when coverage is required, check out our guide to commercial auto insurance requirements.
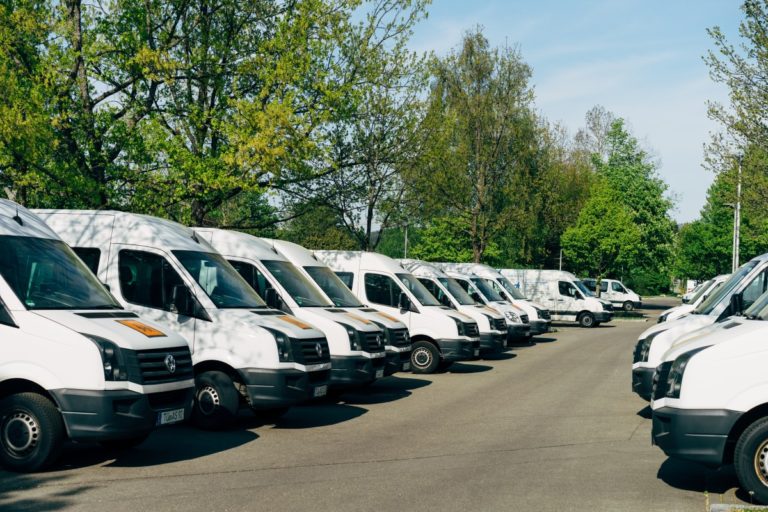
Cargo and Work Vans
Cargo vans are the most cost-efficient vehicle class for many service trades, including electrical, plumbing, and HVAC work. Tools and equipment are stored inside the vehicle, which reduces debris-related liability on highways and job sites.
Another major pricing factor is towing capacity. Because standard vans are rarely used to haul heavy trailers, insurers face significantly less exposure to the multi-vehicle accidents and jackknifing claims associated with pickup trucks. This lower overall claim severity directly translates to a more cost-efficient premium.
While cargo vans can sometimes carry slightly higher comprehensive deductibles due to the theft risk of tools stored in the cabin, their lack of heavy towing exposure keeps their overall premiums noticeably lower than comparable pickup trucks.
Contractors using vans to carry valuable tools should also understand the difference between vehicle coverage and property coverage. For a that, see our guides to tools and equipment insurance and inland marine insurance
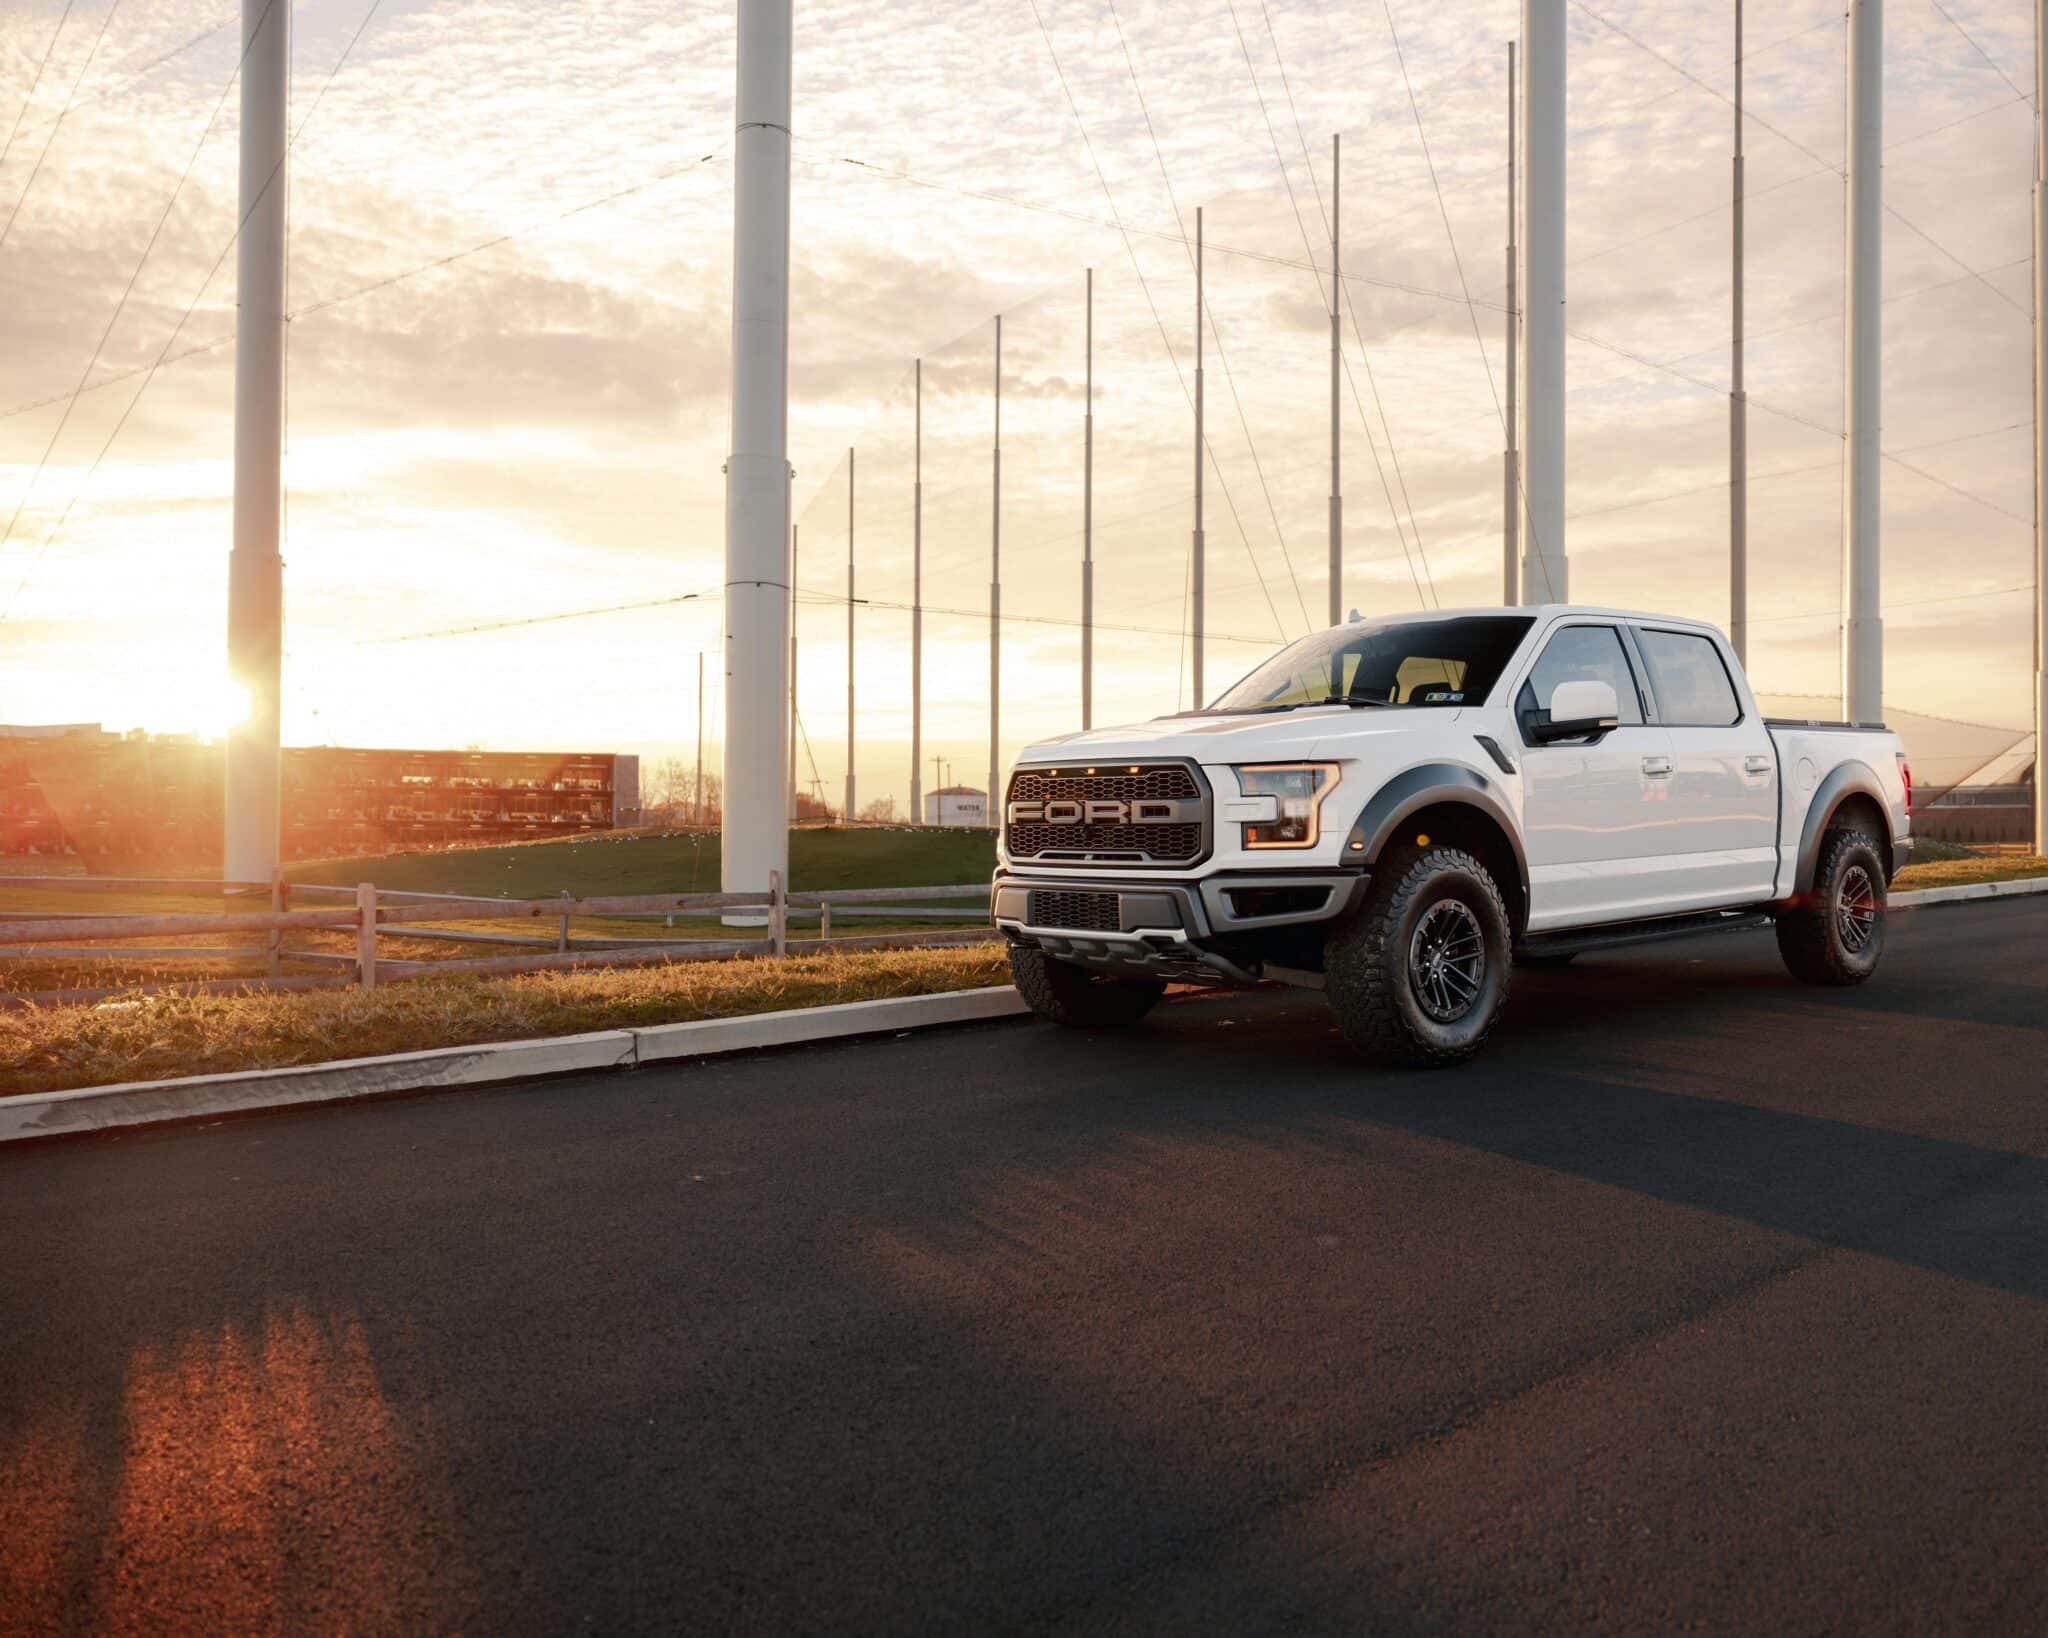
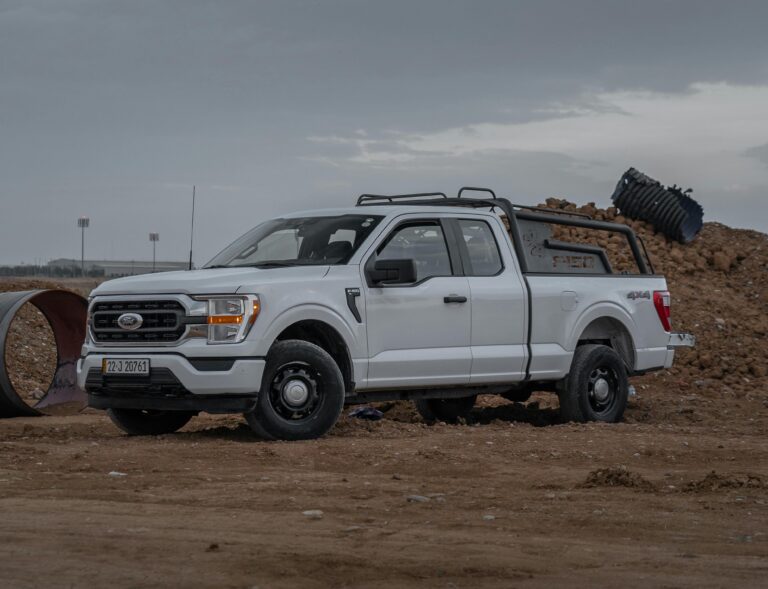
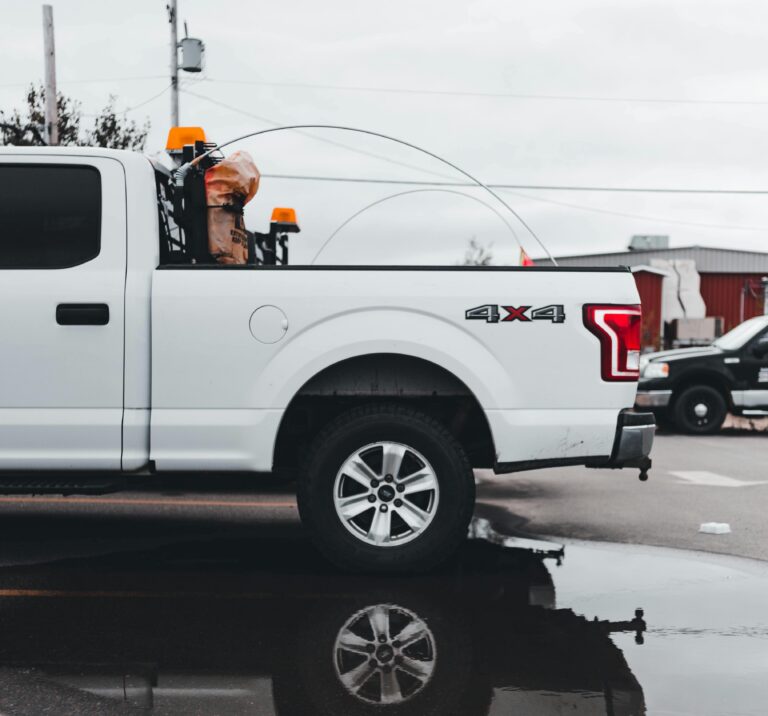
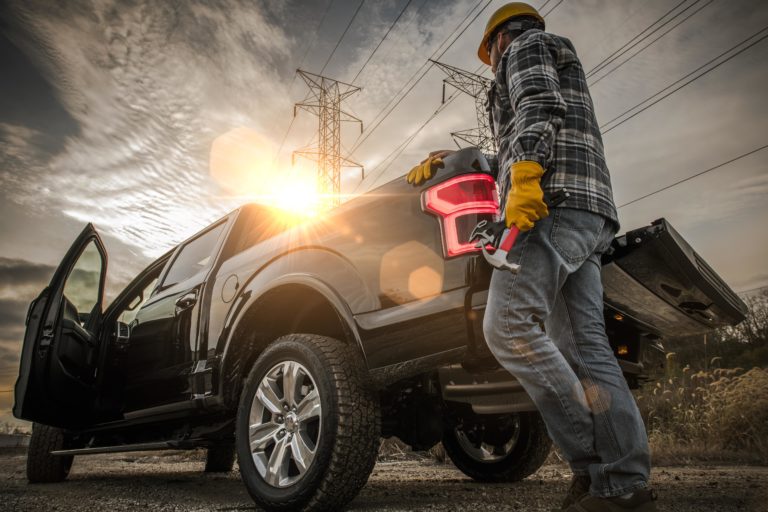
Pickup Trucks (Contractor Class)
Pickup trucks carry higher premiums than standard passenger vehicles because of their higher Gross Vehicle Weight Rating (GVWR) and towing exposure. Carriers consider the damage potential of heavy vehicles and the liability risks of hauling equipment, which increases stopping distance and accident severity.
Dual rear wheel configurations often push a pickup into a higher weight class. Even if the truck is rarely used for heavy hauling, the GVWR alone can trigger a surcharge.
Light Box Trucks
Light box trucks, typically defined as Class 3 vehicles (10,001–14,000 lbs GVWR), represent the entry point of medium-duty commercial insurance pricing. While sometimes colloquially called light-duty due to their size, their gross vehicle weight officially categorizes them as medium-duty risk.
Beyond just weight, their physical dimensions introduce unique claims exposures. Their height and large surface area significantly increase the risk of wind-related accidents and low-clearance strikes against bridges and overhangs. Because of the heavy damage potential involved, insurers usually write these vehicles with higher liability limits—almost always a $1,000,000 Combined Single Limit (CSL)—to meet standard commercial contract requirements and manage the exposure from severe losses.
Regulatory Warning: The 10,001 lb Interstate Threshold
When your vehicle hits that 10,001 lb GVWR mark, you are no longer just dealing with state-level insurance guidelines—you most comply with federal commercial auto requirements. If your business operates a Class 3 vehicle (like a standard light box truck or heavily modified dually) and you cross state lines for work, you are subject to Federal Motor Carrier Safety Administration (FMCSA) regulations. Failing to comply before crossing a state border can result in immediate vehicle impoundment, massive federal fines, and absolute claim denials in the event of an accident.
Electric Vehicles
The pricing stats in the table above are for internal combustion engine (gas/diesel) vehicles. If your business is using electric work vehicles—like the Ford E-Transit, F-150 Lightning, or Rivian commercial vans—you must budget for significantly higher insurance costs.
Commercial EVs currently cost 20% to 40% more to insure than their gas or diesel equivalents. While EVs save money on fuel and routine maintenance, carriers price them for severe physical damage risk. Even minor collisions can compromise the battery pack, turning a standard fender-bender into a total loss. In addition, specialized EV repair labor rates are much higher, and a limited supply of replacement parts leads to longer shop downtimes and higher rental reimbursement payouts. If you are calculating the total cost of ownership for an EV fleet, do not use standard insurance benchmarks.
Cost by Trade: High-Risk vs. Low-Risk Classifications
While a vehicle’s garaging location, size class, and operating radius establish the baseline premium, the trade classification often determines where the final price lands. Carriers assign a business class code (based on NAICS or ISO-style categories) to reflect how the vehicle is used, how often it is on the road, and what the business typically hauls.
In 2026, the pricing gap between low-risk service trades and high-risk structural trades widened. Carriers are charging more aggressively for operations tied to towing, heavy materials, and congested job site driving.
Low-Risk Trades (Finish Work and Service)
Estimated Cost: $250–$320 per month per vehicle
Typical Trades: Painters, finish carpenters, HVAC service technicians, electricians
Note: While insurers view these trades as higher risk than standard professional services (like real estate agents or consultants), they sit in the most favorable pricing tier within the construction and contracting industry. These vehicles operate more like service units than material haulers. Three factors keep their premiums on the lower end:
- Enclosed cargo: Tools and materials are stored securely inside vans. This meaningfully reduces the risk of theft and eliminates liability claims from unsecured items falling into the roadway.
- Lower mileage: Vehicles often stay parked at one job site for long blocks of time.
- Stable drivers: The vehicle is more likely to be driven by the owner or a lead technician, rather than a rotating crew of laborers.
Medium-Risk Trades (General Construction)
Estimated Cost: $325–$425 per month per vehicle
Typical Trades: General contractors, landscapers, framers, masons
This category usually costs more because the vehicle is used for both transportation and hauling. Carriers price these trades assuming more towing, more stops, and more job site traffic.
Common cost drivers include:
- Trailer use: Frequent towing increases stopping distance and accident severity.
- Multiple job sites: Daily travel between supply houses and active projects increases exposure, especially at busy intersections.
- Employee drivers: Vehicles are often driven by apprentices or laborers, which increases the frequency of minor collisions.
High-Risk Trades (Structural and Excavation)
Estimated Cost: $450–$600+ per month per vehicle
Typical Trades: Roofers, excavators, concrete pump operators, loggers
These trades consistently produce the highest premiums because claim severity is higher. While accident frequency is not always worse than other trades, the sheer weight of the vehicles and the hazards of the job sites mean that when losses do happen, they are likely to be more expensive.
Not sure which coverages you actually need? Decode your policy with our commercial auto insurance coverage guide.
Why Roofers Pay More
Roofing contractors sit near the top of the pricing range for light-duty commercial auto. While individual driving records (MVRs) still heavily impact your final quote, the high base rate for this trade comes down to equipment and load exposure.
Heavy payloads of shingles and tiles push these vehicles to their maximum gross vehicle weight (GVW), creating a high center of gravity that increases rollover risk. Furthermore, carriers know roofers frequently navigate tight residential areas, leading to a high frequency of backing accidents and property damage claims. Because accidents involving heavy materials and elevated heights result in more severe injuries and damage, roofers face noticeably higher premiums than standard service trades.
Trade Cost Benchmarks
| Trade Classification | Typical Roles | Primary Risk Drivers | Est. Monthly Cost (Per Vehicle) |
| Lower-Risk (Service & Finish) | Painters, finish carpenters, HVAC, electricians | • Enclosed cargo: Tools secured in vans reduces theft and liability from unsecured items falling. • Lower mileage: Vehicles parked at one site for long blocks of time. • Stable drivers: Often driven by the owner or a lead tech. | $250–$320 |
| Medium-Risk (General Construction) | General contractors, landscapers, framers, masons | • Trailer use: Frequent towing increases stopping distance and accident severity. • Multiple job sites: More daily road exposure and intersection traffic. • Employee drivers: Higher minor collision frequency with rotating laborers. | $325–$425 |
| High-Risk (Structural & Heavy) | Roofers, excavators, concrete pump operators, loggers | • Heavy payloads: Maxed-out weight limits create a high center of gravity and rollover risk. • Severe loss potential: Accidents involving heavy equipment cause extreme damage. • Job site hazards: Frequent backing in tight residential areas. | $450–$600+ |
Commercial Auto Insurance Rates by State
Location is one of the biggest pricing drivers in commercial auto insurance. Carriers file different base rates by state—and often by zip code—based on accident frequency, repair costs, theft rates, and the local legal environment.
In 2026, the gap between high-cost states and low-cost states remains wide. Due to high-cost legal and repair environments, the highest-cost states—including Florida, Nevada, Louisiana, New York, and New Jersey—can cost 30–100% more than the national average. On the other hand, lower cost states—such as Ohio, Iowa, and Idaho—benefit from lower traffic and lower claim-frequency and cost 20–35% below the national average.
Note: Benchmarks reflect 2026 estimated monthly premium ranges for a standard light-duty contractor vehicle. These figures represent full coverage (including liability, comprehensive, and collision), factoring in each state’s current legal environment, repair costs, and weather exposures.
Commercial Auto Rates by State (Table)
| Rank | State | Rate | Reasoning |
|---|---|---|---|
| 1 | Idaho | $125 – $175 | Low traffic density; lower claim severity. |
| 2 | Maine | $130 – $180 | Extremely low uninsured driver rate (5.7%) and low accident frequency. |
| 3 | Ohio | $135 – $185 | Competitive market, though facing recent rises in social inflation. |
| 4 | North Carolina | $140 – $190 | Strict state Rate Bureau regulations limit massive price spikes. |
| 5 | Wisconsin | $145 – $195 | Low uninsured driver rate; stable claims environment. |
| 6 | Vermont | $150 – $200 | Low claim frequency and rural driving, though severe winter weather prevents rates from dropping further. |
| 7 | New Hampshire | $155 – $205 | Lower litigation frequency and a highly competitive local standard market. |
| 8 | Iowa | $160 – $210 | Low congestion; however, savings are increasingly offset by rising severe convective storms (hail/wind). |
| 9 | Indiana | $165 – $215 | “Crossroads of America” means high freight traffic, but a highly competitive market keeps rates in check. |
| 10 | Virginia | $170 – $220 | Strict “contributory negligence” laws heavily favor defense, keeping litigation payouts and severity low. |
| 11 | North Dakota | $175 – $225 | Severe winters; Bakken shale region activity increases heavy commercial truck traffic, leading to higher-severity accidents. |
| 12 | South Dakota | $180 – $230 | Low population density is offset by high rural speed limits and a very high frequency of animal-vehicle collisions. |
| 13 | Nebraska | $185 – $235 | Stable liability environment, but comprehensive (physical damage) costs are rising rapidly due to severe Midwestern convective storms. |
| 14 | Wyoming | $190 – $240 | Extreme wind corridors (especially along I-80) cause frequent high-profile vehicle (van/box truck) rollovers; high-speed driving increases severity. |
| 15 | Kansas | $195 – $245 | High frequency of severe hail and tornado exposure heavily drives up the physical damage portion of local fleet premiums. |
| 16 | Minnesota | $200 – $250 | Severe winter loss frequency and fleet rust/depreciation, though the liability and legal environment remains remarkably stable. |
| 17 | Montana | $205 – $255 | High-speed rural driving and animal collisions; long transport distances to medical trauma centers heavily increase injury claim severity. |
| 18 | Alaska | $210 – $260 | Severe terrain; massive logistical costs for shipping replacement parts and highly limited repair networks drive up physical damage expenses. |
| 19 | Massachusetts | $215 – $265 | High urban density and accident frequency (especially in Boston), but offset by a heavily regulated, stable state market structure. |
| 20 | Illinois | $220 – $270 | Massive geographic divide; Cook County (Chicago) drives severe social inflation and high frequency, while downstate rural areas remain highly affordable. |
| 21 | Oregon | $225 – $275 | High urban theft and vandalism trends (specifically catalytic converters and contractor tools in the Portland metro) drive up comprehensive claims. |
| 22 | Washington | $230 – $280 | Surging repair labor rates and severe Seattle-area congestion; strict liability environments increase overall settlement costs. |
| 23 | Tennessee | $235 – $285 | Massive cross-country freight volume along the I-40 corridor leads to higher-severity multi-vehicle accidents; rapid metro growth increases frequency. |
| 24 | Arizona | $240 – $290 | High-speed urban highway driving; extreme heat degrades tires rapidly (causing blowouts), and frequent windshield/glass claims are a localized staple. |
| 25 | Missouri | $245 – $295 | Highly challenging litigation venues (specifically St. Louis, which is frequently cited for social inflation) drive up liability payouts; moderate severe weather. |
| 26 | Utah | $250 – $300 | Massive population boom has led to unprecedented congestion along the I-15 corridor; combined with severe mountain driving and winter weather. |
| 27 | Alabama | $255 – $305 | High percentage of uninsured motorists drives up Uninsured Motorist (UM) premiums; Gulf Coast hurricane/storm exposure impacts physical damage rates. |
| 28 | Arkansas | $260 – $310 | High frequency of severe accidents on rural, undivided highways; significant logging and heavy trucking presence increases the severity of collisions. |
| 29 | West Virginia | $265 – $315 | Extreme topography; steep, winding mountain roads lead to high rollover frequency. Highly limited access to repair networks drastically increases towing and repair times. |
| 30 | Kentucky | $270 – $320 | Complex Personal Injury Protection (PIP) system and a highly litigious environment for bodily injury claims drive up the liability portion of the premium. |
| 31 | Oklahoma | $275 – $325 | Extremely high uninsured motorist rate; severe convective storms (tornado/hail) constantly threaten physical damage margins for fleet parking. |
| 32 | Texas | $280 – $330 | Massive urban congestion in the “Texas Triangle”; extreme hail exposure; frequent “nuclear verdicts” in commercial auto liability lawsuits. |
| 33 | Colorado | $285 – $335 | The Front Range (Denver/Colorado Springs) experiences some of the most destructive, fleet-totaling hail storms in the country; high repair labor rates. |
| 34 | Hawaii | $290 – $340 | Astronomical logistical costs. Tariffs on imported parts are compounded by ocean freight shipping costs, and repair facility options are highly limited. |
| 35 | New Mexico | $295 – $345 | Carries one of the highest uninsured driver rates in the nation (frequently exceeding 20%); high vehicle theft and rural highway fatality rates. |
| 36 | South Carolina | $300 – $350 | Frequently ranks among the highest in the nation for traffic fatalities per mile driven; poor rural road infrastructure drives severe accidents. |
| 37 | Maryland | $305 – $355 | Extreme accident frequency driven by the dense I-95/Baltimore-DC corridor; rising social inflation and attorney representation in metro areas. |
| 38 | Connecticut | $315 – $365 | Very high baseline repair labor rates combined with dense traffic; highly litigious environment for bodily injury claims. |
| 39 | Rhode Island | $325 – $375 | Extreme urban density statewide means almost every mile driven is high-risk; high rates of attorney involvement even in minor collisions. |
| 40 | California | $335 – $390 | Massive regulatory friction forced many carriers to restrict capacity; extreme repair costs, severe congestion, and a highly plaintiff-friendly legal environment. |
| 41 | Mississippi | $345 – $400 | Highest uninsured motorist rate in the nation (often hovering near 30%); severe rural accident frequency and high attorney involvement. |
| 42 | Georgia | $355 – $410 | Exploding social inflation and frequent “nuclear verdicts” stemming from the Atlanta metro area; extreme freight density along the I-75/I-85 corridors. |
| 43 | Nevada | $365 – $425 | The 24/7 Las Vegas economy drives high frequency of severe, late-night accidents; very high vehicle theft rates and skyrocketing desert repair costs. |
| 44 | Delaware | $375 – $435 | Geographically tiny but carries massive, high-speed pass-through traffic along the I-95 corridor; high severity per capita. |
| 45 | Michigan | $385 – $450 | Unique no-fault (PIP) structure. Despite recent reforms, Michigan’s mandated personal injury protection levels still drive some of the highest medical claim costs in the country. |
| 46 | Pennsylvania | $400 – $475 | Massive urban density in the Philadelphia/Pittsburgh corridors; Philadelphia is frequently cited as a highly challenging, plaintiff-friendly litigation venue. |
| 47 | New York | $420 – $500 | Extreme NYC and downstate congestion; astronomical body shop labor rates, high vehicle theft, and severe No-Fault (PIP) medical claim costs. |
| 48 | New Jersey | $440 – $525 | Highest population density in the US means fender-benders are statistically highly probable; severe traffic choke points and high medical costs. |
| 49 | Louisiana | $475 – $575 | Historically one of the worst legal environments for auto claims. Extremely high rate of attorney involvement in minor accidents; poor road infrastructure. |
| 50 | Florida | $500 – $650 | Lingering effects of historical litigation; massive uninsured driver population; extreme hurricane/flood exposure. (Note: Recent tort reform, HB 837, is beginning to stabilize future rate hikes). |
Why Rates Are Rising: Litigation Costs and Repair Inflation
Many construction business owners see premium increases even after a year with no claims. The cause is not individual driving behavior. It is the rising baseline cost of claims across the commercial auto market.
In 2026, two forces account for most rate pressure: litigation-driven claim severity (also known as social inflation) and higher vehicle repair costs. Repair expenses have been heavily exacerbated by recent trade tariffs on imported autos and parts. Even with ongoing legal volatility surrounding these trade policies, the resulting supply chain friction has sharply increased claim severities. Together, they are driving base rate increases of approximately 7% to 15% for commercial auto policies, regardless of loss history.
1. Litigation-Driven Claim Severity
Claim costs have increased due to higher lawsuit settlements and broader liability standards applied to commercial operators.
- Large jury awards: Verdicts exceeding $10 million are no longer rare in commercial auto cases involving bodily injury. These outcomes raise settlement expectations even in routine accidents.
- Expanded negligence arguments: Plaintiff attorneys increasingly argue that accidents result from company-level failures such as inadequate driver training, poor supervision, or unsafe policies—not just driver error.
- Higher settlements: To avoid unpredictable jury outcomes, insurers now resolve many claims at significantly higher amounts than five years ago. These higher payouts are reflected in future premiums across the market.
For contractors, the practical impact is simple: even a minor accident can escalate into a high-cost claim if documentation, training records, or internal policies cannot be produced quickly.
2. Rising Vehicle Repair Costs
Modern work vehicles are far more expensive to repair than older models, even after low-speed collisions.
- Calibration requirements: Bumper and windshield repairs now often require recalibration of cameras and sensors. These procedures add hours of specialized labor at higher shop rates.
- Costlier materials: Aluminum body panels, LED lighting systems, and integrated assemblies have increased parts costs significantly.
- Longer repair times: Limited availability of qualified technicians and replacement parts keeps vehicles in the shop longer, increasing rental reimbursement and loss-of-use expenses.
Accidents that cost $10,000 to resolve in 2020 now often exceed $16,000, as commercial auto claim severity has surged by more than 60% over the last several years. This increase in claim severity is a primary driver of rate increases at renewal, even for businesses with clean records.
Hidden Liabilities: HNOA & Unlisted Drivers
This guide has focused primarily on the cost of insuring scheduled commercial vehicles (the vans, trucks, and sedans that your business officially owns). However, some of the most expensive commercial auto risks stem from how you manage your employees and their personal vehicles.
What happens when an estimator uses their personal sedan to visit a client, or a laborer takes their own uninsured pickup to Home Depot for extra materials? If that employee causes an accident while driving their personal vehicle on a company errand, the injured party can sue your business directly. Standard commercial auto policies do not cover this exposure automatically.
To close this gap, businesses use Hired and Non-Owned Auto (HNOA) coverage.
- Hired Auto: Covers vehicles your business rents or leases on a short-term basis.
- Non-Owned Auto: Covers vehicles your employees own but use on behalf of the business.
How Much Does Hired & Non-Owned Auto (HNOA) Coverage Cost?
For most light-duty contractors, adding an HNOA endorsement is highly cost-effective, typically running a flat annual fee of just $100 to $300.
Because the employee’s personal auto policy pays out first in an accident, HNOA acts as a practical secondary layer of protection for your business. Skipping it might save you $15 a month, but it leaves your company exposed to costly litigation every time an employee makes a quick run to the hardware store.
Warning: Unlisted Drivers and MVR Claim Denials
Don’t let a new hire drive a company vehicle before formally adding them to your policy. Because commercial auto premiums rely on the Motor Vehicle Records (MVRs) of authorized drivers, carriers can outright deny claims if an unlisted employee causes an accident, especially if they have a hidden DUI or suspended license. If this happens, your policy provides zero protection, leaving you to pay for totaled vehicles, property damage, and medical bills entirely out of pocket.
Strategies to Lower Commercial Auto Premiums
Commercial auto insurance is not a fixed cost. Premiums are directly influenced by how vehicles are classified, rated, and used. Contractors who tighten these definitions can reduce exposure and lower premiums without reducing coverage quality.
Implement Radius Restrictions
Commercial auto insurance is rated based on the ‘radius of operation,’ which is defined as the straight-line distance (as the crow flies) from the vehicle’s principal garaging address to its furthest destination, rather than the total road miles driven.
- Local radius (50 miles or less): Often produces savings of 10–15% when vehicles stay within a defined service area.
- Intermediate radius (51–200 miles): Standard rating for regional operations.
- Long-Distance / Long-Haul (over 200 miles): Highest rating due to increased severity exposure.
Action: Review actual vehicle usage. If a van never leaves the metro area, confirm it is not rated for regional or long-distance travel.
Use Seasonal Storage for Idle Vehicles
For seasonal trades, there is no reason to carry full liability and collision coverage when vehicles are parked for extended periods.
Action: Request comprehensive-only status for inactive vehicles during off-season months. This keeps protection for theft, fire, and vandalism while removing liability and collision, often reducing annual cost by 20–30%.
Avoid Personal Auto Policies for Work Vehicles
Insuring a work truck on a personal policy to save $50–$100 per month creates a dangerous gray area for your business. While standard personal policies generally permit commuting and hauling your own tools, many modern insurers add custom endorsements that strip away coverage for commercial activities. If an accident occurs while you are hauling materials for a fee, making deliveries, or operating a heavy-duty vehicle (typically over 10,000 pounds), your claim could be denied entirely.
This exposes the business owner to full out-of-pocket repair costs, legal defense expenses, and third-party liability—costs that far exceed any short-term premium savings.
For a deeper dive into these liability gaps, read our complete breakdown of commercial vs. personal auto insurance.
Bundle Policies When Possible
Carriers price more competitively when they insure multiple lines for the same business.
Action: Combining commercial auto with general liability or workers’ compensation insurance can often produce discounts of 5–15%, in addition to simplifying administration and claims handling—especially when an accident involves both vehicle damage and an on-the-job injury.
Finding the Lowest-Cost Commercial Auto Insurance
In 2026, the lowest commercial auto premiums are no longer driven by carriers simply prioritizing speed and volume. With the market facing 7% to 15% rate increases in the first quarter alone due to persistent underwriting losses and rising repair costs, the most competitive pricing for light-duty risks is now heavily dependent on telematics and usage-based insurance (UBI).
Carriers achieve competitive pricing in two very different ways. Digital-first InsurTechs reduce premiums by heavily minimizing operational overhead and agent commissions. Conversely, large national writers maintain higher overhead due to massive agent networks, but they offset this through vast economies of scale and highly sophisticated, data-driven underwriting. For contractors prioritizing cost today, opting into a carrier’s telematics program—which can reduce premiums by up to 30% for safe driving—is often the only way to secure the lowest possible rates.
2026 Cheapest Commercial Auto Insurance Comparison (Light-Duty Vans)
| Company | Best For | Est. Monthly Cost (Van) | Get Quote |
|---|---|---|---|
|
ERGO NEXT
|
Solopreneurs and very small contractors | $140–$175 | |
|
Progressive
|
New ventures and higher-risk driver profiles | $180–$240 | |
|
biBERK
|
Direct buyers who want speed | $155–$200 | |
|
GEICO
|
Simple service fleets and light trades | $150–$190 |
*We may earn a commission when you click through these links.
Note: The estimated costs above reflect the 2026 base rate increases. Hitting the lower end of these ranges typically requires opting into the carrier’s telematics or UBI program.
To see our top overall recommendations across all rating categories, check out our guide to the best commercial auto insurance companies.
Examples of Real-World Commercial Auto Pricing
The examples below show how common rating variables—business age, location, vehicle choice, and coverage structure—combine to produce very different premiums. Each scenario uses a realistic contractor profile to illustrate why two businesses driving similar vehicles can see vast pricing gaps.
Scenario A: New Venture, High Cost
Scenario A: New Venture, High Cost
A first-year plumbing contractor operating in Miami, Florida.
The business purchases a new, financed 2026 Ford Transit and must carry full physical damage coverage to satisfy the lender.
The base rate for a light-duty cargo van in Florida starts closer to $210 per month for minimum coverage, reflecting recent market increases. From there, several compounding factors apply. The business is new, which triggers a surcharge due to the absence of loss history. Florida’s baseline rates remain high—though it is worth noting that recent tort reforms (such as HB 837) have begun to stabilize the market and curb historic litigation frequency. Finally, full comprehensive and collision coverage further increases the premium because the vehicle is new and fully exposed to loss.
After these adjustments, the estimated monthly premium for a new venture in the high-risk Miami market realistically lands between $550 and $625 per month.
What changes over time: This pricing is front-loaded. If the contractor maintains continuous coverage and a clean driving record, the new-venture surcharge typically phases out after three years. However, high annual rate inflation and the increasing cost of tech-heavy repairs typically limit total savings. In practice, this profile often sees a 15–25% reduction by year four.
Scenario B: Established Fleet, Low Cost
Scenario B: Established Fleet, Low Cost
A general contractor in Ohio with ten years of operating history.
The business runs a small fleet of five vehicles: three older Chevy Express vans and two newer pickups. The older vans carry liability-only coverage, while the newer trucks retain full coverage.
Because the business qualifies for fleet rating, the carrier evaluates the account as a whole rather than pricing each vehicle in isolation. While Ohio remains relatively affordable due to market competition and geography, its legal environment has recently experienced rising social inflation, which has driven double-digit premium increases statewide. However, limiting physical damage coverage on the depreciated vans significantly reduces the average cost per unit for this specific business.
After fleet credits and selective coverage decisions, the estimated premium averages about $150 to $175 per vehicle per month (which is highly competitive compared to the state average of $173–$272 for construction contractors).
Why this works: The contractor is effectively self-insuring physical damage on vehicles that no longer justify collision coverage. Over several years, the premium savings exceed the replacement cost of a single older van.
Scenario C: Hidden High Risk
Scenario C: Hidden High Risk
A roofing contractor based in Texas.
The business operates a Ford F-350 dually and carries standard commercial liability limits. While the vehicle appears similar to other pickups on paper, several risk factors materially change the rate.
Roofing (Code 5551) is consistently ranked as a high-risk trade due to both the high frequency of accidents—such as construction-related falls—and the extreme severity of the resulting claims. Additionally, ladder racks increase rollover exposure and introduce debris risk at highway speeds. The dual-rear-wheel configuration of the F-350 pushes the vehicle into a heavier rating class, and Texas adds weather-related loss exposure from hail and wind events.
After these adjustments, the estimated monthly premium reaches approximately $250 to $280 per month.
Where the cost comes from: This is a classic example of “too much truck.” Switching to a single-rear-wheel F-250 lowers the vehicle’s weight rating, which can reduce the premium by $40 to $50 per month. (Note: A company’s trade classification is determined by its actual work. Attempting to switch to a lower-risk classification while still performing roofing operations is premium fraud and will lead to claim denials.)
Hidden Fees to Watch for in Commercial Auto Quotes
The quoted premium is not always the final cost. While standard carrier administrative (or “policy”) fees are typically flat charges ranging from $25 to $100, other structural costs—specifically installment finance charges and broker additions—can quietly increase your total annual output by 5% to 10%.
- Agency and Broker Fees: Independent agents may add a separate service fee, distinct from the carrier’s actual premium. These agency or broker fees are often percentage-based, which is one place you might see a 5% to 10% increase added to your overall cost. These are usually disclosed on the invoice but not always discussed during quoting.
- Monthly Installment Fees and Finance Charges: Breaking your premium into payments comes at a cost. Installment fees typically range from $1 to $35 per month, with many standard carriers charging around $5. Additionally, the finance charges for using an installment plan can ultimately add 5% to 10% to your overall premium cost. Paying your premium annually in full eliminates these charges entirely. (Note: While paying quarterly reduces the total number of fees compared to a monthly plan, you will typically still be charged a service fee for each of those four installments.)
- Endorsement and Certificate Fees: Costs can accumulate quickly depending on the specific paperwork you need. While basic requests for standard certificates are frequently provided for free, adding additional insureds or waivers of subrogation individually typically costs $25 to $100 per request. Contractors working with multiple general contractors are usually better served by a policy that includes blanket additional insured and waiver language, even if the base premium is slightly higher.
Frequently Asked Questions
How is insurance calculated for a small fleet?
While five vehicles remains a traditional benchmark for large-scale fleet rating, many modern insurers now offer “mini-fleet” pricing for businesses with as few as two or three vehicles. When you qualify for a fleet or mini-fleet policy, the carrier evaluates the operation as a whole—driver controls, claims history, and total mileage—rather than pricing each VIN in isolation. This structure usually produces a volume discount in the 10–15% range and simplifies administration by placing all vehicles on a single renewal date.
Is a dually truck more expensive to insure than a standard pickup?
Yes. Dual-rear-wheel pickups almost always cost more to insure than single-rear-wheel models. The wider footprint increases side-swipe risk in tight job sites, and the heavy-duty suspension, reinforced frame, and dual-wheel setup often push the vehicle above the 10,001-lb GVWR threshold. Once that happens, the truck is rated as medium duty rather than light duty, which raises the liability base rate even if the truck is not hauling heavy loads.
Depending on your exact weight and what you are hauling, you might even need to upgrade your policy entirely. See our guide to commercial auto vs. commercial truck insurance to find out.
Why are premiums higher for new construction businesses?
Carriers apply a new venture surcharge—typically 20–35%—to businesses with fewer than three years of operating history. Loss data shows that newer companies file claims more frequently and lack established safety controls. This surcharge declines over time as the business builds verified loss history. After three clean years, most carriers remove it entirely.
How much can I save by raising my deductible?
Raising deductibles can significantly reduce your costs, but it is important to understand where those savings apply. Moving from a $500 to $1,000 deductible typically reduces the collision and comprehensive (physical damage) portion of your premium by 15–30%. Increasing that deductible from $1,000 to $2,500 can yield an additional 10–15% in savings on that same portion. For contractors with adequate cash reserves, a $2,500 deductible is often the most efficient option. Over two to three years, the premium savings usually exceed the out-of-pocket cost of a single minor claim.
How does a lapse in coverage affect my premium?
A lapse in coverage occurs when a policy is canceled without a replacement in place. Many carriers treat a lapse as a red flag.
After a lapse, many standard carriers will not quote the business. To regain commercial auto coverage, businesses will often have to shift to non-standard markets for coverage, where premiums can be 30% to 50% higher for the same limits. A lapse can stay on your record for several years and may result in being categorized as a high-risk policyholder. Continuous coverage is one of the most reliable ways to keep access to preferred pricing.
References
- National Association of Insurance Commissioners (NAIC). The standard-setting body for U.S. insurance regulators, providing official data on insurers, policies, and claims.
- American Transportation Research Institute (ATRI). The research arm of the American Trucking Associations, ATRI conducts data-driven studies on trucking industry economics, safety, operating costs, and regulatory impacts.
- Insurance Institute for Highway Safety (IIHS). An independent, nonprofit research organization funded by auto insurers that conducts crash testing, vehicle safety evaluations, and roadway safety research used to inform underwriting, loss prevention, and public safety policy.
Related Guides
The Best Commercial Auto Insurance Companies for 2026
Progressive, Ergo Next, and BiBerk are the best commercial auto insurance providers in 2026. Travelers, Erie, Nationwide, and Liberty Mutual…
The Best Commercial Truck Insurance Companies for 2026
The best commercial truck insurance companies for 2026 are Progressive for its vast selection of fleet policies, The Hartford for…
Commercial Auto vs. Commercial Truck Insurance: Key Differences
The main difference between commercial auto and commercial truck insurance comes down to vehicle size and payload. Commercial auto covers…

Commercial vs. Personal Auto Insurance
The main difference between commercial vs. personal auto insurance is intent: personal policies cover daily commuting, while commercial policies cover…
Commercial Auto Insurance Requirements: State, Federal, & Contractual
Commercial auto insurance requirements are governed by three distinct authorities: state DMVs require basic split limits for vehicle registration, the…

Commercial Auto Insurance Coverage Guide
Commercial auto insurance covers the vehicles owned or used by your business. It protects the company from liability claims if…

The Best Contractors Tools & Equipment Insurance for 2026
Based on our evaluation of coverage limits, replacement cost options, and claims processing speeds, the best contractors tools and equipment…
Best General Liability Insurance for Contractors in 2026
The Hartford, Ergo Next, and Hiscox are the best general liability insurance providers for contractors in 2026. Progressive, Thimble, and…
The Best Inland Marine Insurance Companies for 2026
Based on our evaluation of coverage limits, mobile equipment protection, and claims processing, the best inland marine insurance companies for…