
U.S. States With the Worst Roads
As of 2026, about 13.1% of major U.S. roadways are in poor condition, with Rhode Island, Massachusetts, and New York ranking among the worst for roadway quality.
Note: This is the most recent release of our U.S. States With the Worst Roads study. To see data from prior years, please visit the Full Results section below.
Roadways are a vital component of infrastructure in the United States. The vast majority of goods are transported by truck, highlighting the economy’s need for reliable roadways to connect supply chains and move goods and services efficiently across borders. Most commuters use roads daily to get to work, and individuals also rely on roadways for crucial access to resources including employment, social, health, and education services.
However, many highways, major roads, and bridges are in need of repair. Hazardous road conditions can negatively impact the economy, contribute to traffic congestion, and impact the safety of Americans. The passing of the Infrastructure Investment and Jobs Act (also referred to as the Bipartisan Infrastructure Package) highlights the importance of reliable roads in the U.S. and the commitment to improving America’s infrastructure. The 2021 bill signed into law dedicated $110 billion in funding to repair and update roads and bridges, in addition to supporting major transformational roadway projects across the U.S.
Researchers at Construction Coverage analyzed data from the U.S. Department of Transportation to evaluate the condition of roadways across the country.
Key Findings
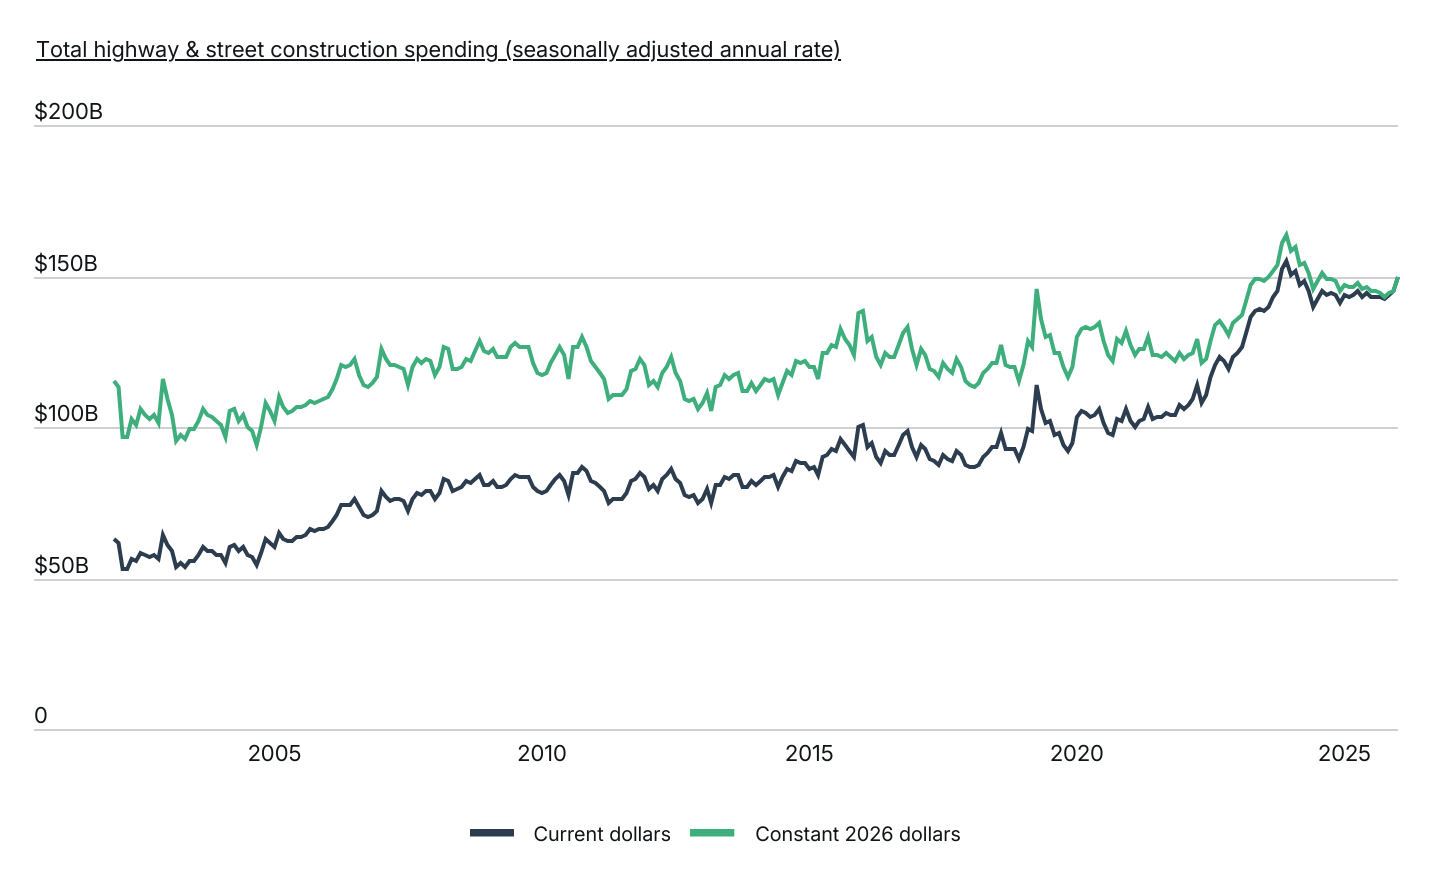
- Highway and street construction spending has surged. In large part due to the Infrastructure Investment and Jobs Act, road construction spending rose to roughly $150 billion annually, an increase of approximately 25%.
- A staggering 13.1% of major U.S. roadways are in poor condition. Even with increased investment, more than one in every eight miles of major roadways are in disrepair.
- Rhode Island leads the nation, with 36.2% of its major roadways rated in poor condition. Despite making incremental improvements in recent years, the state’s share of poor roads remains nearly seven percentage points higher than any other state.
Highway & Street Construction Spending Over Time
Investment in America’s roadways skyrocketed in recent years
Data: Total Highway and Street Construction Spending Time Series
| Date | Current dollars | Constant 2026 dollars |
|---|---|---|
| 1/1/2002 | $62,723,000,000 | $115,276,190,906 |
| 2/1/2002 | $61,801,000,000 | $113,390,252,742 |
| 3/1/2002 | $53,009,000,000 | $96,986,573,064 |
| 4/1/2002 | $53,053,000,000 | $96,633,983,067 |
| 5/1/2002 | $56,278,000,000 | $102,393,980,301 |
| 6/1/2002 | $55,427,000,000 | $100,789,493,742 |
| 7/1/2002 | $58,337,000,000 | $105,845,356,422 |
| 8/1/2002 | $57,418,000,000 | $103,889,361,684 |
| 9/1/2002 | $56,791,000,000 | $102,584,397,721 |
| 10/1/2002 | $57,693,000,000 | $103,983,672,649 |
| 11/1/2002 | $56,464,000,000 | $101,600,357,201 |
| 12/1/2002 | $64,394,000,000 | $115,678,260,022 |
| 1/1/2003 | $61,246,000,000 | $109,541,120,745 |
| 2/1/2003 | $58,630,000,000 | $104,291,146,187 |
| 3/1/2003 | $53,636,000,000 | $95,252,169,483 |
| 4/1/2003 | $54,692,000,000 | $97,498,640,262 |
| 5/1/2003 | $53,949,000,000 | $96,331,853,537 |
| 6/1/2003 | $55,866,000,000 | $99,645,905,014 |
| 7/1/2003 | $55,695,000,000 | $99,016,432,553 |
| 8/1/2003 | $57,611,000,000 | $101,978,651,859 |
| 9/1/2003 | $59,977,000,000 | $105,822,628,179 |
| 10/1/2003 | $59,013,000,000 | $104,234,384,229 |
| 11/1/2003 | $58,686,000,000 | $103,600,774,962 |
| 12/1/2003 | $57,916,000,000 | $101,965,879,288 |
| 1/1/2004 | $57,304,000,000 | $100,455,173,119 |
| 2/1/2004 | $55,212,000,000 | $96,580,485,570 |
| 3/1/2004 | $60,294,000,000 | $105,244,772,165 |
| 4/1/2004 | $60,656,000,000 | $105,707,159,701 |
| 5/1/2004 | $58,842,000,000 | $102,109,942,062 |
| 6/1/2004 | $59,954,000,000 | $103,654,086,564 |
| 7/1/2004 | $57,778,000,000 | $99,786,364,167 |
| 8/1/2004 | $57,106,000,000 | $98,573,648,668 |
| 9/1/2004 | $54,552,000,000 | $93,867,379,220 |
| 10/1/2004 | $58,573,000,000 | $100,258,065,639 |
| 11/1/2004 | $63,169,000,000 | $107,617,305,018 |
| 12/1/2004 | $61,899,000,000 | $105,453,680,814 |
| 1/1/2005 | $59,935,000,000 | $102,161,021,816 |
| 2/1/2005 | $64,765,000,000 | $109,934,884,719 |
| 3/1/2005 | $63,023,000,000 | $106,590,137,359 |
| 4/1/2005 | $62,012,000,000 | $104,555,369,417 |
| 5/1/2005 | $62,550,000,000 | $105,516,939,050 |
| 6/1/2005 | $63,388,000,000 | $106,875,375,034 |
| 7/1/2005 | $63,504,000,000 | $106,411,720,636 |
| 8/1/2005 | $64,349,000,000 | $107,167,828,720 |
| 9/1/2005 | $66,022,000,000 | $108,460,729,054 |
| 10/1/2005 | $65,687,000,000 | $107,747,794,857 |
| 11/1/2005 | $65,950,000,000 | $108,725,283,190 |
| 12/1/2005 | $66,287,000,000 | $109,280,861,969 |
| 1/1/2006 | $66,892,000,000 | $109,614,272,434 |
| 2/1/2006 | $68,677,000,000 | $112,482,868,987 |
| 3/1/2006 | $70,702,000,000 | $115,625,562,223 |
| 4/1/2006 | $74,019,000,000 | $120,447,021,286 |
| 5/1/2006 | $73,929,000,000 | $119,941,998,271 |
| 6/1/2006 | $74,399,000,000 | $120,405,453,974 |
| 7/1/2006 | $76,186,000,000 | $122,629,045,678 |
| 8/1/2006 | $73,190,000,000 | $117,286,436,310 |
| 9/1/2006 | $70,659,000,000 | $113,788,863,373 |
| 10/1/2006 | $69,912,000,000 | $113,087,767,489 |
| 11/1/2006 | $70,891,000,000 | $114,614,603,505 |
| 12/1/2006 | $72,324,000,000 | $116,298,131,521 |
| 1/1/2007 | $78,567,000,000 | $126,127,692,583 |
| 2/1/2007 | $76,517,000,000 | $122,362,157,590 |
| 3/1/2007 | $75,742,000,000 | $120,496,221,387 |
| 4/1/2007 | $75,967,000,000 | $120,492,611,100 |
| 5/1/2007 | $75,974,000,000 | $120,007,722,725 |
| 6/1/2007 | $75,674,000,000 | $119,257,555,768 |
| 7/1/2007 | $72,330,000,000 | $113,785,012,933 |
| 8/1/2007 | $76,396,000,000 | $120,144,350,561 |
| 9/1/2007 | $78,167,000,000 | $122,410,795,629 |
| 10/1/2007 | $77,702,000,000 | $121,308,574,865 |
| 11/1/2007 | $78,990,000,000 | $122,357,808,133 |
| 12/1/2007 | $78,688,000,000 | $121,537,783,083 |
| 1/1/2008 | $76,266,000,000 | $117,392,142,336 |
| 2/1/2008 | $78,084,000,000 | $119,900,592,852 |
| 3/1/2008 | $82,642,000,000 | $126,447,122,934 |
| 4/1/2008 | $82,222,000,000 | $125,514,010,975 |
| 5/1/2008 | $78,669,000,000 | $119,383,811,810 |
| 6/1/2008 | $79,418,000,000 | $119,270,707,127 |
| 7/1/2008 | $80,264,000,000 | $119,686,503,415 |
| 8/1/2008 | $81,947,000,000 | $122,378,283,579 |
| 9/1/2008 | $81,772,000,000 | $122,012,609,530 |
| 10/1/2008 | $83,075,000,000 | $125,031,904,422 |
| 11/1/2008 | $84,013,000,000 | $128,722,737,395 |
| 12/1/2008 | $81,003,000,000 | $125,141,239,577 |
| 1/1/2009 | $80,846,000,000 | $124,583,398,753 |
| 2/1/2009 | $81,852,000,000 | $125,675,846,717 |
| 3/1/2009 | $80,220,000,000 | $123,291,792,089 |
| 4/1/2009 | $80,423,000,000 | $123,479,433,047 |
| 5/1/2009 | $80,498,000,000 | $123,412,984,687 |
| 6/1/2009 | $82,980,000,000 | $126,171,014,665 |
| 7/1/2009 | $83,856,000,000 | $127,540,974,675 |
| 8/1/2009 | $83,320,000,000 | $126,302,825,129 |
| 9/1/2009 | $83,418,000,000 | $126,207,688,207 |
| 10/1/2009 | $83,753,000,000 | $126,335,278,275 |
| 11/1/2009 | $80,417,000,000 | $120,898,327,131 |
| 12/1/2009 | $78,511,000,000 | $117,971,494,743 |
| 1/1/2010 | $78,277,000,000 | $117,543,629,423 |
| 2/1/2010 | $78,587,000,000 | $118,121,562,198 |
| 3/1/2010 | $80,544,000,000 | $121,022,962,057 |
| 4/1/2010 | $82,460,000,000 | $123,873,389,420 |
| 5/1/2010 | $84,312,000,000 | $126,721,374,458 |
| 6/1/2010 | $82,259,000,000 | $123,687,504,510 |
| 7/1/2010 | $77,325,000,000 | $116,051,639,898 |
| 8/1/2010 | $84,485,000,000 | $126,612,552,048 |
| 9/1/2010 | $84,542,000,000 | $126,493,655,691 |
| 10/1/2010 | $87,053,000,000 | $129,798,731,545 |
| 11/1/2010 | $85,148,000,000 | $126,637,438,062 |
| 12/1/2010 | $82,069,000,000 | $121,569,861,806 |
| 1/1/2011 | $81,367,000,000 | $120,140,359,949 |
| 2/1/2011 | $79,963,000,000 | $117,689,011,366 |
| 3/1/2011 | $79,074,000,000 | $115,781,585,467 |
| 4/1/2011 | $74,931,000,000 | $109,202,721,317 |
| 5/1/2011 | $75,973,000,000 | $110,370,141,918 |
| 6/1/2011 | $75,948,000,000 | $110,333,823,047 |
| 7/1/2011 | $76,201,000,000 | $110,412,086,284 |
| 8/1/2011 | $77,984,000,000 | $112,640,259,843 |
| 9/1/2011 | $82,186,000,000 | $118,452,412,733 |
| 10/1/2011 | $82,777,000,000 | $119,223,703,974 |
| 11/1/2011 | $85,067,000,000 | $122,296,006,040 |
| 12/1/2011 | $83,653,000,000 | $120,234,597,572 |
| 1/1/2012 | $79,503,000,000 | $113,959,347,987 |
| 2/1/2012 | $80,610,000,000 | $115,299,671,439 |
| 3/1/2012 | $79,130,000,000 | $112,946,319,125 |
| 4/1/2012 | $82,523,000,000 | $117,594,023,762 |
| 5/1/2012 | $83,927,000,000 | $119,842,558,473 |
| 6/1/2012 | $86,012,000,000 | $122,921,387,058 |
| 7/1/2012 | $82,585,000,000 | $117,989,719,498 |
| 8/1/2012 | $81,259,000,000 | $115,424,691,812 |
| 9/1/2012 | $77,510,000,000 | $109,576,589,745 |
| 10/1/2012 | $77,131,000,000 | $108,747,524,275 |
| 11/1/2012 | $77,605,000,000 | $109,599,876,064 |
| 12/1/2012 | $75,081,000,000 | $106,048,125,508 |
| 1/1/2013 | $76,383,000,000 | $107,673,855,654 |
| 2/1/2013 | $79,360,000,000 | $111,266,237,996 |
| 3/1/2013 | $74,678,000,000 | $104,997,109,823 |
| 4/1/2013 | $80,528,000,000 | $113,459,097,676 |
| 5/1/2013 | $80,869,000,000 | $113,892,376,967 |
| 6/1/2013 | $83,653,000,000 | $117,533,463,675 |
| 7/1/2013 | $82,839,000,000 | $116,162,401,597 |
| 8/1/2013 | $83,952,000,000 | $117,442,754,849 |
| 9/1/2013 | $84,198,000,000 | $117,742,508,581 |
| 10/1/2013 | $80,253,000,000 | $112,165,784,781 |
| 11/1/2013 | $80,460,000,000 | $112,248,058,437 |
| 12/1/2013 | $82,332,000,000 | $114,556,738,977 |
| 1/1/2014 | $80,838,000,000 | $112,205,980,517 |
| 2/1/2014 | $81,919,000,000 | $113,581,418,452 |
| 3/1/2014 | $83,620,000,000 | $115,703,596,861 |
| 4/1/2014 | $83,594,000,000 | $115,452,396,400 |
| 5/1/2014 | $83,861,000,000 | $115,601,162,715 |
| 6/1/2014 | $80,333,000,000 | $110,591,759,947 |
| 7/1/2014 | $83,494,000,000 | $114,814,181,475 |
| 8/1/2014 | $86,017,000,000 | $118,302,535,147 |
| 9/1/2014 | $85,377,000,000 | $117,413,912,404 |
| 10/1/2014 | $88,733,000,000 | $122,053,375,749 |
| 11/1/2014 | $87,966,000,000 | $121,226,585,907 |
| 12/1/2014 | $88,307,000,000 | $122,073,068,232 |
| 1/1/2015 | $86,387,000,000 | $120,184,528,688 |
| 2/1/2015 | $86,534,000,000 | $120,084,668,236 |
| 3/1/2015 | $83,877,000,000 | $116,084,778,435 |
| 4/1/2015 | $89,830,000,000 | $124,194,190,380 |
| 5/1/2015 | $90,512,000,000 | $124,725,773,545 |
| 6/1/2015 | $92,556,000,000 | $127,190,358,071 |
| 7/1/2015 | $92,036,000,000 | $126,275,461,354 |
| 8/1/2015 | $96,309,000,000 | $132,138,668,554 |
| 9/1/2015 | $94,130,000,000 | $129,439,946,610 |
| 10/1/2015 | $92,368,000,000 | $126,891,430,235 |
| 11/1/2015 | $90,167,000,000 | $123,719,987,211 |
| 12/1/2015 | $100,318,000,000 | $137,796,589,786 |
| 1/1/2016 | $100,938,000,000 | $138,711,811,994 |
| 2/1/2016 | $93,496,000,000 | $128,655,878,788 |
| 3/1/2016 | $94,715,000,000 | $129,926,001,428 |
| 4/1/2016 | $90,254,000,000 | $123,334,142,365 |
| 5/1/2016 | $88,381,000,000 | $120,489,795,865 |
| 6/1/2016 | $91,792,000,000 | $124,793,589,663 |
| 7/1/2016 | $90,718,000,000 | $123,395,613,446 |
| 8/1/2016 | $90,891,000,000 | $123,402,730,915 |
| 9/1/2016 | $94,044,000,000 | $127,349,495,273 |
| 10/1/2016 | $97,239,000,000 | $131,368,243,418 |
| 11/1/2016 | $98,486,000,000 | $132,896,241,594 |
| 12/1/2016 | $93,298,000,000 | $125,578,568,907 |
| 1/1/2017 | $89,867,000,000 | $120,473,379,619 |
| 2/1/2017 | $93,921,000,000 | $125,707,857,790 |
| 3/1/2017 | $92,722,000,000 | $124,161,073,492 |
| 4/1/2017 | $89,270,000,000 | $119,391,263,304 |
| 5/1/2017 | $88,732,000,000 | $118,763,653,120 |
| 6/1/2017 | $87,193,000,000 | $116,627,775,232 |
| 7/1/2017 | $90,741,000,000 | $121,333,760,673 |
| 8/1/2017 | $89,415,000,000 | $119,102,327,731 |
| 9/1/2017 | $88,743,000,000 | $117,606,666,602 |
| 10/1/2017 | $92,360,000,000 | $122,305,303,091 |
| 11/1/2017 | $90,975,000,000 | $120,150,690,299 |
| 12/1/2017 | $87,392,000,000 | $115,175,958,903 |
| 1/1/2018 | $86,655,000,000 | $113,720,954,999 |
| 2/1/2018 | $86,468,000,000 | $113,170,858,634 |
| 3/1/2018 | $87,469,000,000 | $114,458,967,661 |
| 4/1/2018 | $90,205,000,000 | $117,732,580,976 |
| 5/1/2018 | $91,619,000,000 | $119,308,693,946 |
| 6/1/2018 | $93,230,000,000 | $121,297,274,458 |
| 7/1/2018 | $93,363,000,000 | $121,375,542,143 |
| 8/1/2018 | $97,780,000,000 | $126,891,019,498 |
| 9/1/2018 | $92,984,000,000 | $120,418,818,916 |
| 10/1/2018 | $92,536,000,000 | $119,558,919,374 |
| 11/1/2018 | $92,662,000,000 | $119,806,081,126 |
| 12/1/2018 | $89,171,000,000 | $115,213,530,833 |
| 1/1/2019 | $93,364,000,000 | $120,729,495,179 |
| 2/1/2019 | $99,405,000,000 | $128,156,514,671 |
| 3/1/2019 | $98,579,000,000 | $126,612,782,328 |
| 4/1/2019 | $113,624,000,000 | $145,389,643,628 |
| 5/1/2019 | $105,902,000,000 | $135,475,379,074 |
| 6/1/2019 | $101,441,000,000 | $129,810,837,645 |
| 7/1/2019 | $102,277,000,000 | $130,579,279,583 |
| 8/1/2019 | $97,496,000,000 | $124,361,510,288 |
| 9/1/2019 | $97,946,000,000 | $124,743,548,914 |
| 10/1/2019 | $94,150,000,000 | $119,570,921,040 |
| 11/1/2019 | $91,908,000,000 | $116,395,867,457 |
| 12/1/2019 | $95,030,000,000 | $120,000,222,867 |
| 1/1/2020 | $103,138,000,000 | $129,988,897,892 |
| 2/1/2020 | $105,248,000,000 | $132,585,279,938 |
| 3/1/2020 | $104,961,000,000 | $132,825,226,166 |
| 4/1/2020 | $103,630,000,000 | $132,187,829,803 |
| 5/1/2020 | $104,132,000,000 | $132,947,598,596 |
| 6/1/2020 | $105,987,000,000 | $134,663,138,149 |
| 7/1/2020 | $101,547,000,000 | $128,367,621,060 |
| 8/1/2020 | $98,327,000,000 | $123,835,082,586 |
| 9/1/2020 | $97,031,000,000 | $121,882,791,832 |
| 10/1/2020 | $102,945,000,000 | $129,151,547,371 |
| 11/1/2020 | $102,136,000,000 | $127,845,863,026 |
| 12/1/2020 | $105,783,000,000 | $131,837,884,348 |
| 1/1/2021 | $102,236,000,000 | $127,105,836,102 |
| 2/1/2021 | $99,769,000,000 | $123,618,946,016 |
| 3/1/2021 | $101,887,000,000 | $125,584,790,048 |
| 4/1/2021 | $102,551,000,000 | $125,619,532,313 |
| 5/1/2021 | $106,554,000,000 | $129,662,675,177 |
| 6/1/2021 | $102,538,000,000 | $123,728,747,198 |
| 7/1/2021 | $103,097,000,000 | $123,831,818,832 |
| 8/1/2021 | $103,065,000,000 | $123,442,445,320 |
| 9/1/2021 | $104,689,000,000 | $124,822,646,607 |
| 10/1/2021 | $104,186,000,000 | $123,037,054,305 |
| 11/1/2021 | $103,894,000,000 | $121,650,133,809 |
| 12/1/2021 | $107,239,000,000 | $124,705,693,646 |
| 1/1/2022 | $106,048,000,000 | $122,579,586,909 |
| 2/1/2022 | $107,609,000,000 | $123,528,323,698 |
| 3/1/2022 | $109,508,000,000 | $124,321,275,833 |
| 4/1/2022 | $113,820,000,000 | $128,819,369,769 |
| 5/1/2022 | $108,074,000,000 | $121,166,885,842 |
| 6/1/2022 | $110,462,000,000 | $122,307,874,219 |
| 7/1/2022 | $116,300,000,000 | $128,791,149,932 |
| 8/1/2022 | $120,653,000,000 | $133,528,371,905 |
| 9/1/2022 | $122,883,000,000 | $135,421,793,912 |
| 10/1/2022 | $121,568,000,000 | $133,227,239,575 |
| 11/1/2022 | $119,087,000,000 | $130,168,030,483 |
| 12/1/2022 | $123,302,000,000 | $134,754,489,399 |
| 1/1/2023 | $124,606,000,000 | $135,459,770,748 |
| 2/1/2023 | $126,475,000,000 | $137,021,785,702 |
| 3/1/2023 | $131,272,000,000 | $142,043,992,751 |
| 4/1/2023 | $136,233,000,000 | $146,913,645,607 |
| 5/1/2023 | $138,445,000,000 | $149,058,383,366 |
| 6/1/2023 | $138,832,000,000 | $149,140,714,625 |
| 7/1/2023 | $138,126,000,000 | $148,092,453,237 |
| 8/1/2023 | $140,022,000,000 | $149,402,790,546 |
| 9/1/2023 | $142,949,000,000 | $151,933,206,668 |
| 10/1/2023 | $144,732,000,000 | $153,618,293,432 |
| 11/1/2023 | $152,008,000,000 | $161,104,367,719 |
| 12/1/2023 | $154,904,000,000 | $163,858,339,359 |
| 1/1/2024 | $150,118,000,000 | $158,304,985,450 |
| 2/1/2024 | $151,914,000,000 | $159,545,191,072 |
| 3/1/2024 | $146,971,000,000 | $153,672,909,597 |
| 4/1/2024 | $148,187,000,000 | $154,608,753,849 |
| 5/1/2024 | $145,072,000,000 | $151,285,301,624 |
| 6/1/2024 | $139,430,000,000 | $145,462,506,357 |
| 7/1/2024 | $142,695,000,000 | $148,619,521,254 |
| 8/1/2024 | $144,899,000,000 | $150,678,129,197 |
| 9/1/2024 | $143,731,000,000 | $149,145,367,576 |
| 10/1/2024 | $144,199,000,000 | $149,204,808,818 |
| 11/1/2024 | $143,977,000,000 | $148,552,925,732 |
| 12/1/2024 | $141,364,000,000 | $145,362,734,827 |
| 1/1/2025 | $143,722,000,000 | $147,158,682,522 |
| 2/1/2025 | $143,168,000,000 | $146,262,190,460 |
| 3/1/2025 | $143,469,000,000 | $146,521,111,910 |
| 4/1/2025 | $145,071,000,000 | $147,918,051,551 |
| 5/1/2025 | $143,311,000,000 | $145,978,581,710 |
| 6/1/2025 | $144,350,000,000 | $146,664,108,762 |
| 7/1/2025 | $143,283,000,000 | $145,248,327,443 |
| 8/1/2025 | $143,320,000,000 | $144,781,612,108 |
| 9/1/2025 | $143,237,000,000 | $144,272,033,049 |
| 10/1/2025 | $142,186,000,000 | $143,213,438,505 |
| 11/1/2025 | $143,922,000,000 | $144,597,195,424 |
| 12/1/2025 | $144,795,000,000 | $145,042,371,615 |
| 1/1/2026 | $149,538,000,000 | $149,538,000,000 |
The passage of the Infrastructure Investment and Jobs Act came at a critical time. After adjusting for inflation, highway and street construction spending had largely stagnated for much of the previous decade. From 2010 to 2021, real spending hovered around $120 billion annually with little sustained growth—despite persistent infrastructure needs across the country.
The new federal investment helped reverse that trend. In constant 2026 dollars, annual spending surged from about $120 billion in mid-2022 to averaging nearly $150 billion through 2025 and into early 2026, providing renewed capacity to address long-standing maintenance backlogs and advance long-term transportation projects.
Manage large infrastructure projects more efficiently
Construction project management software helps contractors and infrastructure teams coordinate schedules, budgets, field crews, and reporting across complex roadway and transportation projects. Learn more about tools designed to improve efficiency and visibility across construction operations.
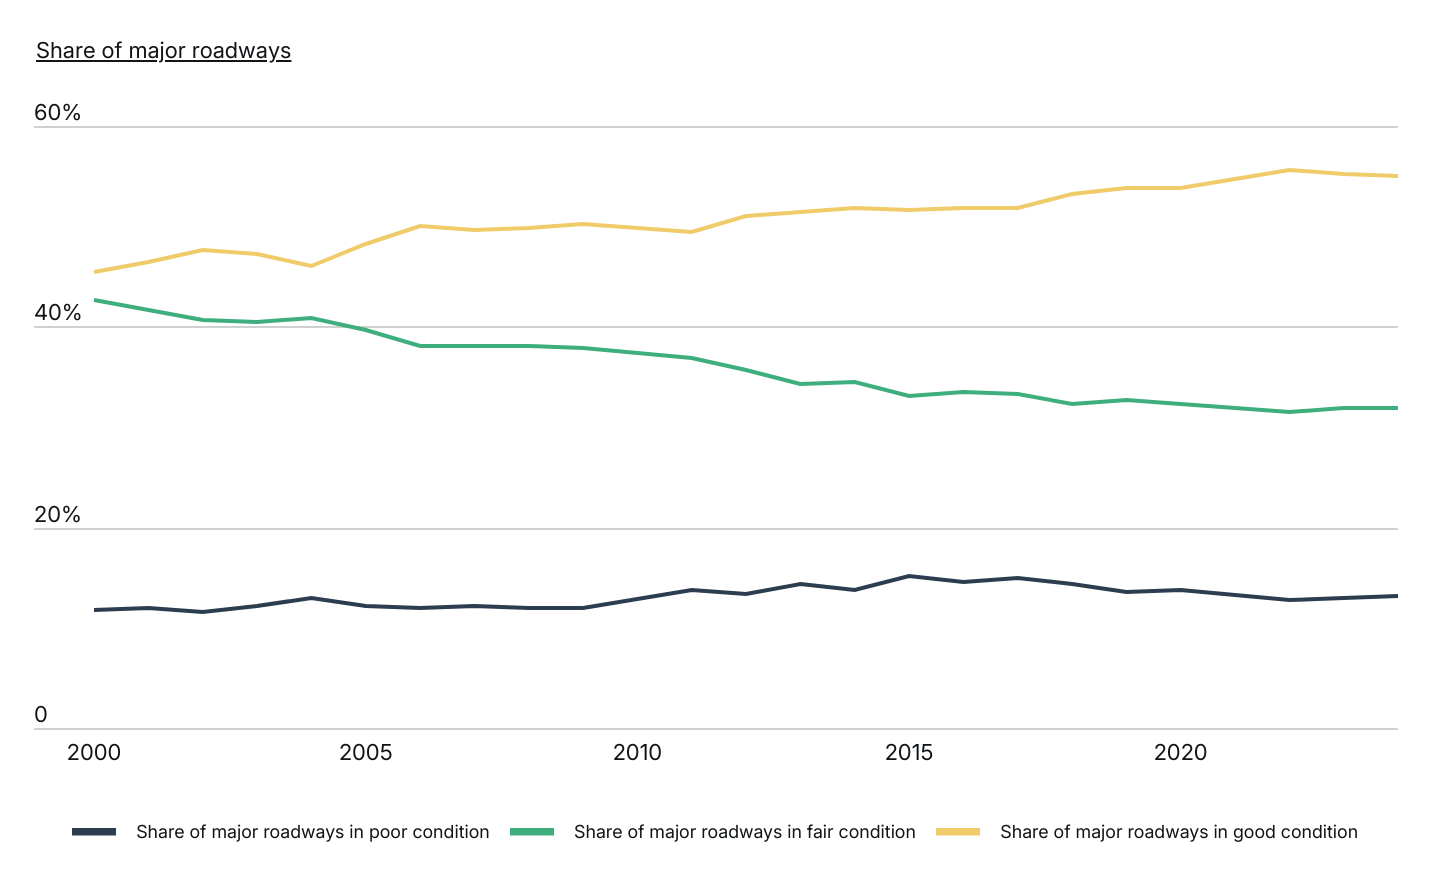
Trends in America’s Road Conditions
The share of major roads in good condition has increased steadily since 2000
Data: U.S. Roadway Conditions Time Series
| Year | Share of major roadways in poor condition | Share of major roadways in fair condition | Share of major roadways in good condition |
|---|---|---|---|
| 2000 | 11.8% | 42.6% | 45.5% |
| 2001 | 11.9% | 41.6% | 46.5% |
| 2002 | 11.6% | 40.7% | 47.7% |
| 2003 | 12.2% | 40.5% | 47.3% |
| 2004 | 13.0% | 40.9% | 46.1% |
| 2005 | 12.2% | 39.6% | 48.3% |
| 2006 | 11.9% | 38.0% | 50.0% |
| 2007 | 12.1% | 38.1% | 49.7% |
| 2008 | 12.0% | 38.1% | 49.9% |
| 2009 | 11.9% | 37.9% | 50.2% |
| 2011 | 13.8% | 36.9% | 49.4% |
| 2012 | 13.3% | 35.6% | 51.1% |
| 2013 | 14.3% | 34.3% | 51.4% |
| 2014 | 13.8% | 34.4% | 51.8% |
| 2015 | 15.2% | 33.0% | 51.7% |
| 2016 | 14.6% | 33.5% | 51.9% |
| 2017 | 15.0% | 33.2% | 51.9% |
| 2018 | 14.4% | 32.3% | 53.3% |
| 2019 | 13.5% | 32.7% | 53.8% |
| 2020 | 13.8% | 32.3% | 53.9% |
| 2021 | |||
| 2022 | 12.8% | 31.5% | 55.7% |
| 2023 | 13.0% | 31.8% | 55.2% |
| 2024 | 13.1% | 31.9% | 55.1% |
Despite increased investment, many U.S. roads remain in poor shape. From 2000 to 2024, the share of major roadways in poor condition rose slightly—from 11.8% to 13.1%. At the same time, there has been clear progress: the share of roads in good condition increased by nearly 10 percentage points, reaching 55.1% in 2024, with noticeable improvements in the years following the 2021 infrastructure law.
The most significant shift occurred in the middle category. Roads classified as being in fair condition declined from 42.6% in 2000 to 31.9% in 2024. This suggests that many roads have either improved or worsened enough to move into a different category—reflecting a gradual but measurable change in overall road quality.
Protect roadway construction operations
Construction insurance helps contractors manage risk across infrastructure and roadway projects, including liability protection for crews, equipment, and jobsite operations. Explore how the right coverage can help reduce financial exposure on complex jobsites.
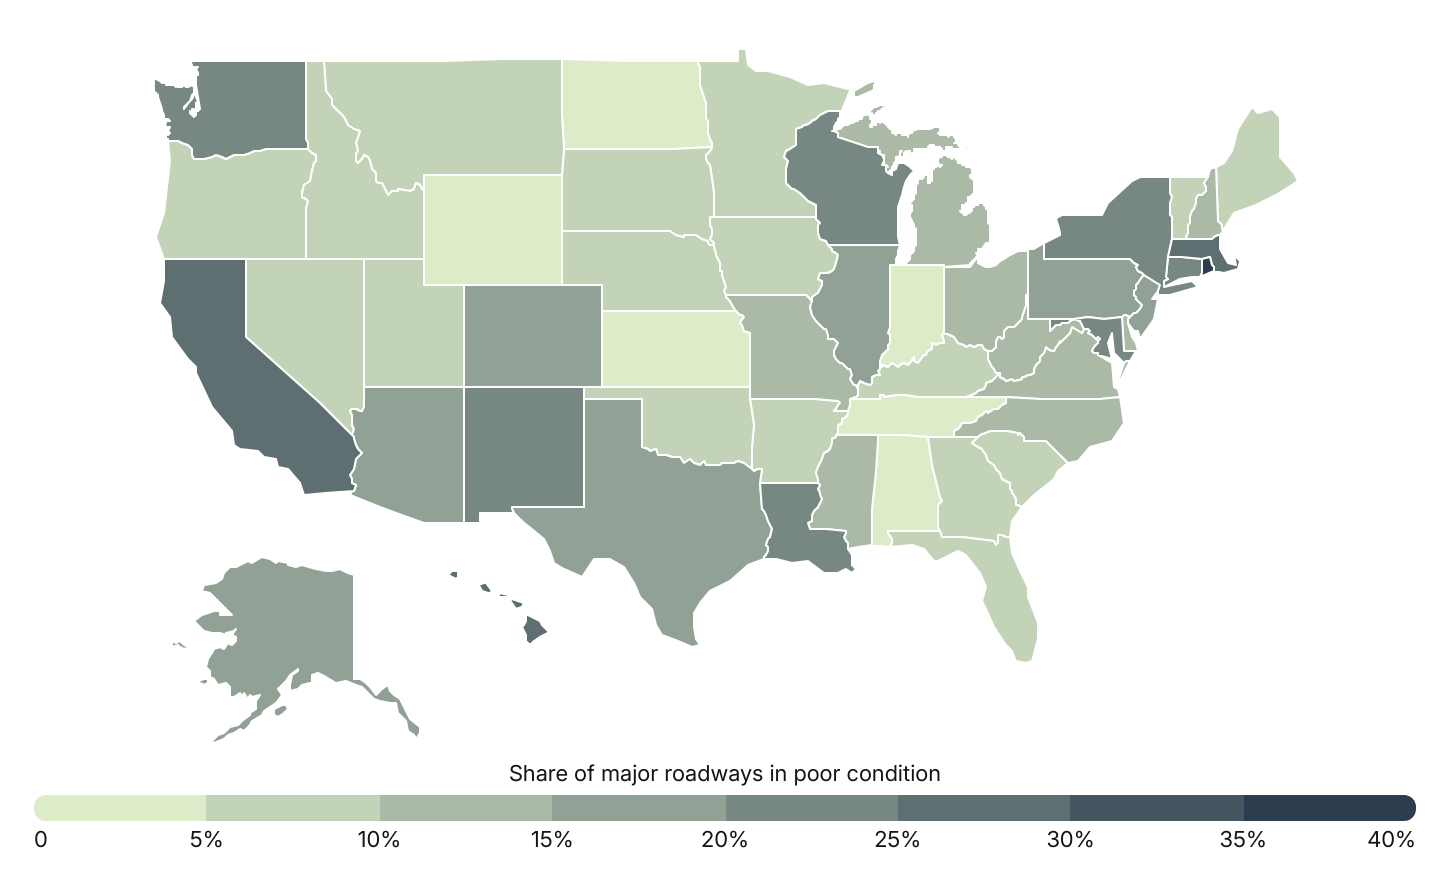
The Percentage of Roads in Poor Condition by State
The Northeast and California have the most roads in poor condition
Data: Share of Major Roads in Poor Condition by State
| State | Share of major roadways in poor condition |
|---|---|
| Rhode Island | 36.2% |
| Massachusetts | 29.3% |
| California | 28.4% |
| Hawaii | 26.5% |
| New York | 24.3% |
| Washington | 22.1% |
| Maryland | 21.6% |
| Louisiana | 21.3% |
| New Mexico | 21.1% |
| Wisconsin | 20.9% |
| Connecticut | 20.5% |
| Colorado | 18.5% |
| New Jersey | 17.6% |
| Illinois | 16.5% |
| Arizona | 15.9% |
| Alaska | 15.3% |
| Texas | 15.3% |
| Pennsylvania | 15.1% |
| Ohio | 14.4% |
| Mississippi | 14.0% |
| West Virginia | 13.2% |
| Michigan | 12.9% |
| Missouri | 12.7% |
| Delaware | 11.9% |
| New Hampshire | 10.8% |
| North Carolina | 10.7% |
| Virginia | 10.3% |
| South Carolina | 9.6% |
| Oklahoma | 8.8% |
| Iowa | 8.4% |
| Maine | 7.8% |
| Utah | 7.5% |
| Nevada | 6.7% |
| Idaho | 6.5% |
| Florida | 6.4% |
| Oregon | 6.1% |
| Kentucky | 5.9% |
| Arkansas | 5.7% |
| Montana | 5.6% |
| Georgia | 5.2% |
| South Dakota | 5.2% |
| Nebraska | 5.2% |
| Vermont | 5.2% |
| Minnesota | 5.0% |
| Alabama | 4.7% |
| Tennessee | 4.7% |
| North Dakota | 4.2% |
| Indiana | 4.1% |
| Wyoming | 3.0% |
| Kansas | 2.8% |
While public investment in roads is growing, many states continue to face significant maintenance challenges—particularly in the Northeast and along the West Coast. Rhode Island leads the nation, with 36.2% of its major roadways rated in poor condition—a slight improvement from years past. Other Northeastern states, including Massachusetts (29.3%), New York (24.3%), Maryland (21.6%), and Connecticut (20.5%), also rank among the worst. These states feature dense urban centers, with some of the country’s oldest housing and infrastructure, yet still rely on heavily trafficked roadways.
Outside the Northeast, California reports 28.4% of its roads in poor condition, reflecting wear from its large, car-dependent population. Hawaii follows closely at 26.5%, despite its small population and geographic footprint.
In contrast, many Midwestern and Southern states report far lower shares of deteriorating roads. Indiana (4.1%), Wyoming (3.0%), and Kansas (2.8%) are among the best-performing states, highlighting a stark regional divide in infrastructure quality. Lower traffic volumes and a higher share of rural roads make maintaining highway infrastructure easier in many of these states.
Below is a complete breakdown of the states with the best and worst roads. The analysis was conducted by Construction Coverage, using data from the Federal Highway Administration. For more details on the methodology, see the section below.
States With the Best & Worst Roads
| Worst States | Share* |
|---|---|
| 1. Rhode Island | 36.2% |
| 2. Massachusetts | 29.3% |
| 3. California | 28.4% |
| 4. Hawaii | 26.5% |
| 5. New York | 24.3% |
| 6. Washington | 22.1% |
| 7. Maryland | 21.6% |
| 8. Louisiana | 21.3% |
| 9. New Mexico | 21.1% |
| 10. Wisconsin | 20.9% |
| 11. Connecticut | 20.5% |
| 12. Colorado | 18.5% |
| 13. New Jersey | 17.6% |
| 14. Illinois | 16.5% |
| 15. Arizona | 15.9% |
| Best States | Share* |
|---|---|
| 1. Kansas | 2.8% |
| 2. Wyoming | 3.0% |
| 3. Indiana | 4.1% |
| 4. North Dakota | 4.2% |
| 5. Tennessee | 4.7% |
| 6. Alabama | 4.7% |
| 7. Minnesota | 5.0% |
| 8. Vermont | 5.2% |
| 9. Nebraska | 5.2% |
| 10. South Dakota | 5.2% |
| 11. Georgia | 5.2% |
| 12. Montana | 5.6% |
| 13. Arkansas | 5.7% |
| 14. Kentucky | 5.9% |
| 15. Oregon | 6.1% |
*Share of major roadways in poor condition
Full Results
Methodology
The data used in this analysis is from the U.S. Department of Transportation Federal Highway Administration’s 2024 Highway Statistics Series. To determine the states with the worst roads, researchers at Construction Coverage calculated the percentage of major roadways in poor condition using the latest data available. In the event of a tie, the state with the lower share of major roadways in good condition was ranked higher. Major roadways are defined to include interstates, other freeways and expressways, other principal arterials, and minor arterials. The International Roughness Index (IRI) was used to classify poor, fair, and good conditions of roadways by the following criteria:
- Poor: IRI greater than 170 inches/mile
- Fair: IRI between 95 and 170 inches/mile
- Good: IRI less than 95 inches/mile
References
- U.S. Census Bureau (2024). Community Characteristics by Sex, American Community Survey (ACS). https://data.census.gov/table/ACSST1Y2024.S0801.
- National Association of Counties (March 4, 2022). Legislative Analysis for Counties: The Bipartisan Infrastructure Law. https://www.naco.org/resources/legislative-analysis-counties-bipartisan-infrastructure-law.
- U.S. Department of Transportation Federal Highway Administration (2024). Highway Statistics Series. https://www.fhwa.dot.gov/policyinformation/statistics.cfm.