American Cities With the Oldest Homes
Which U.S. cities have the oldest homes? Buffalo, Pittsburgh, and New York City top the list, with median home ages of 66, 64, and 63 years—far exceeding the national median of 43.
Note: This is the most recent release of our American Cities With the Oldest Homes study. To see data from previous years, please visit the Full Results section below.
Today’s real estate market is a challenging one for buyers. While home prices have relaxed since their peak in the COVID-19 pandemic, the typical cost of a home in the U.S. has risen by more than 23% from early 2020 through the end of 2025. Compounding the housing affordability problem further, mortgage rates remain at elevated levels not seen since before the Great Recession. Additionally, the impacts of high rent and inflation have made it harder for many would-be buyers to save up for home purchases.
Underlying all of these conditions is the simple fact that America has been slow to add new homes to its housing supply. Estimates of the national housing shortfall range between 1.5 and 7.3 million housing units relative to the needs of the current population. One of the primary reasons is that many construction firms downsized or went out of business entirely during the Great Recession, leading to a long stretch of underbuilding.
This prolonged underinvestment has led to an aging housing stock, leaving buyers to contend with homes that often require expensive repairs, costly renovations, and higher energy bills. To better understand how and where these effects are most pronounced, researchers at Construction Coverage examined patterns in housing age and condition using the latest data from the U.S. Census Bureau.
Key Findings
- U.S. housing stock continues to age. The median age of U.S. homes has consistently risen since the turn of the century and reached 43 years in 2024.
- Historic charm means more home maintenance. Homes built before 1940 are nearly 30 times more likely to be in inadequate condition and cost nearly 10 times more in routine maintenance than new homes built after 2022.
- The Northeast is the epicenter of aging properties. Buyers in New York State face a national-high median home age of 65, a stark contrast to Sun Belt states like Nevada, Arizona, and Texas, where the median age sits at 30 years or less.
- The new construction gap. More than a quarter of homes in older metros like Buffalo and Boston were built before 1940, while booming cities like Austin and Raleigh are driven by new development and boast median home ages of 19 and 22 years, respectively.
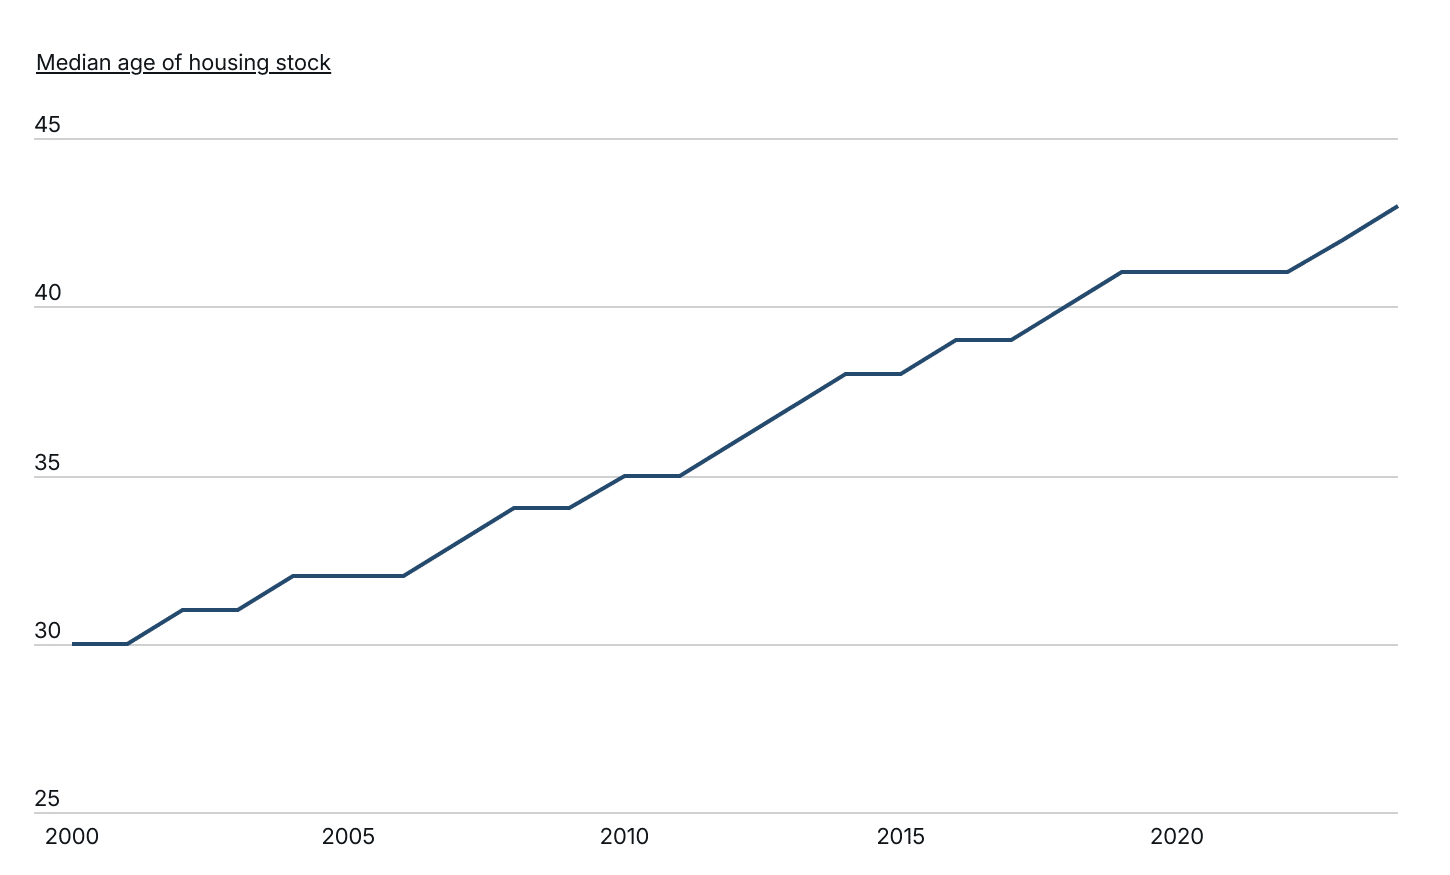
The Age of America’s Housing Stock
The median age of U.S. homes has increased steadily over the past 25 years
Data: Median Age of U.S. Housing Stock Over Time
| Survey year | Median age |
|---|---|
| 2000 | 30 |
| 2001 | 30 |
| 2002 | 31 |
| 2003 | 31 |
| 2004 | 32 |
| 2005 | 32 |
| 2006 | 32 |
| 2007 | 33 |
| 2008 | 34 |
| 2009 | 34 |
| 2010 | 35 |
| 2011 | 35 |
| 2012 | 36 |
| 2013 | 37 |
| 2014 | 38 |
| 2015 | 38 |
| 2016 | 39 |
| 2017 | 39 |
| 2018 | 40 |
| 2019 | 41 |
| 2020 | 41 |
| 2021 | 41 |
| 2022 | 41 |
| 2023 | 42 |
| 2024 | 43 |
With fewer new homes coming onto the market, many buyers are increasingly competing for older homes. Over the last two decades, the median age of a home in the U.S. has increased by more than 10 years, from 30 years in 2000 to 43 in 2024.
Older homes do have some advantages for buyers. For one, they are often less expensive to purchase, making them more accessible for lower- or middle-income buyers. Old homes may also have more character, with design features and amenities that reflect the time at which they were built. And as the saying goes, “they don’t build them like they used to.” In many cases, surviving older homes demonstrate higher quality craftsmanship or the use of long-lasting materials like old-growth lumber.
Protecting new construction projects
As the U.S. works to close its housing supply gap, more new residential construction and large renovation projects are likely to follow. Construction insurance can help property owners, developers, and contractors protect projects from liability risks, job-site accidents, and costly delays.
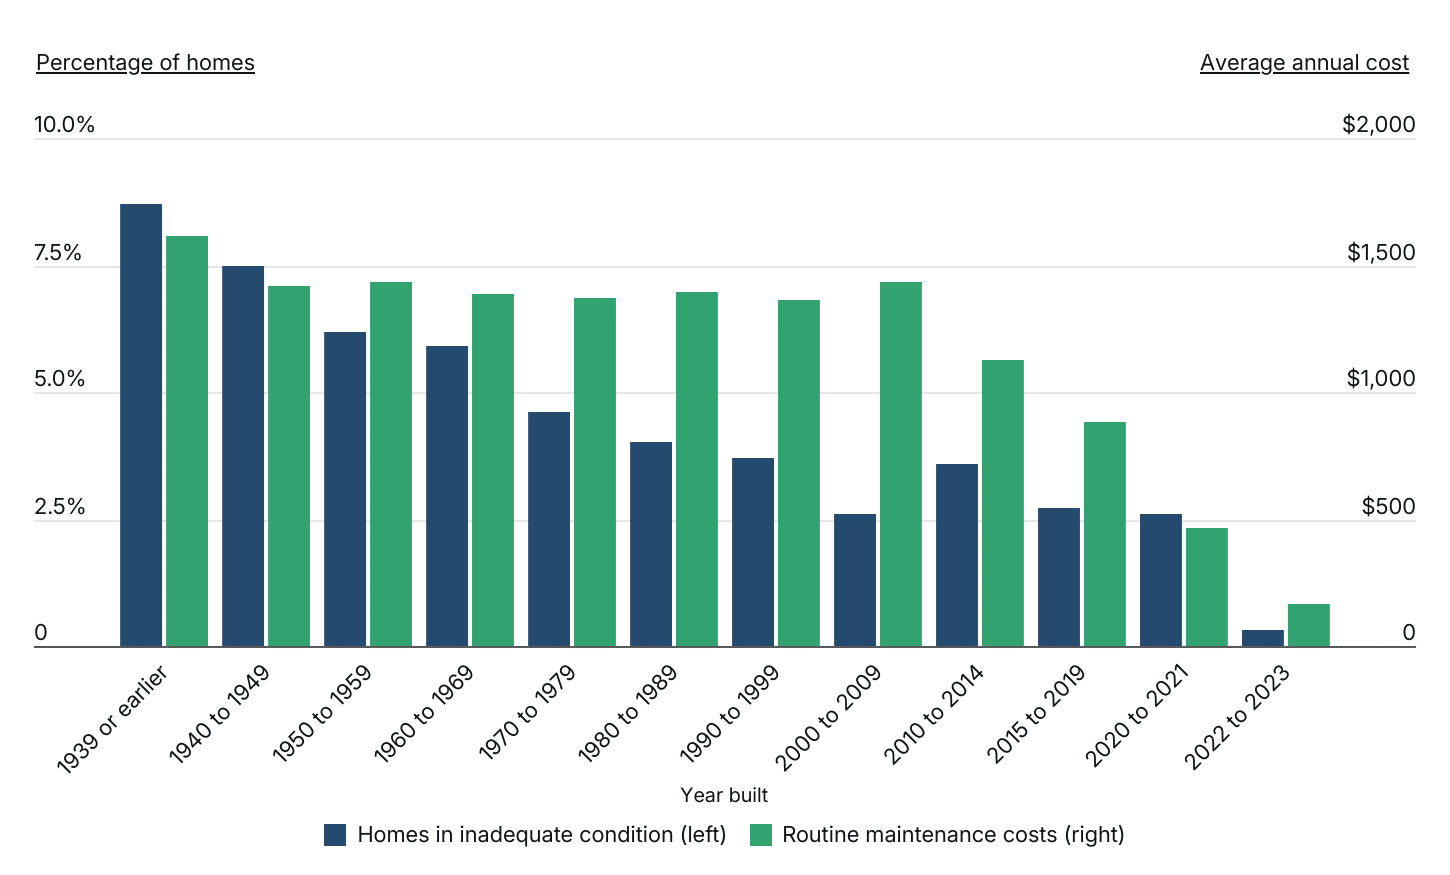
Housing Age and Quality
Older homes require significantly more upkeep to maintain adequate living conditions
Data: U.S. Housing Age and Quality Over Time
| Year built | Homes in inadequate condition (left) | Routine maintenance costs (right) |
|---|---|---|
| 1939 or earlier | 8.7% | $1,615 |
| 1940 to 1949 | 7.5% | $1,419 |
| 1950 to 1959 | 6.2% | $1,430 |
| 1960 to 1969 | 5.9% | $1,383 |
| 1970 to 1979 | 4.6% | $1,374 |
| 1980 to 1989 | 4.0% | $1,394 |
| 1990 to 1999 | 3.7% | $1,366 |
| 2000 to 2009 | 2.6% | $1,432 |
| 2010 to 2014 | 3.6% | $1,128 |
| 2015 to 2019 | 2.7% | $882 |
| 2020 to 2021 | 2.6% | $466 |
| 2022 to 2023 | 0.3% | $164 |
The downside of older homes, of course, is that aging homes often come with additional costs for maintenance and repairs. According to data from the U.S. Census Bureau, both the likelihood that a home is in inadequate condition and the typical costs of routine maintenance increase with age. Of U.S. homes built before 1940, 8.7% are considered to be in inadequate condition, as opposed to just 0.3% of homes built since 2022. Meanwhile, the average annual maintenance costs for homes built before 1940 are $1,615, compared with just $164 for homes built after 2022—nearly 10 times higher.
Renovating older homes comes with risks
Homes built decades ago often require significant repairs—from structural updates to electrical or plumbing replacements. During renovation projects, builders risk insurance helps protect the property and materials from damage caused by fire, weather, theft, or vandalism while work is underway.
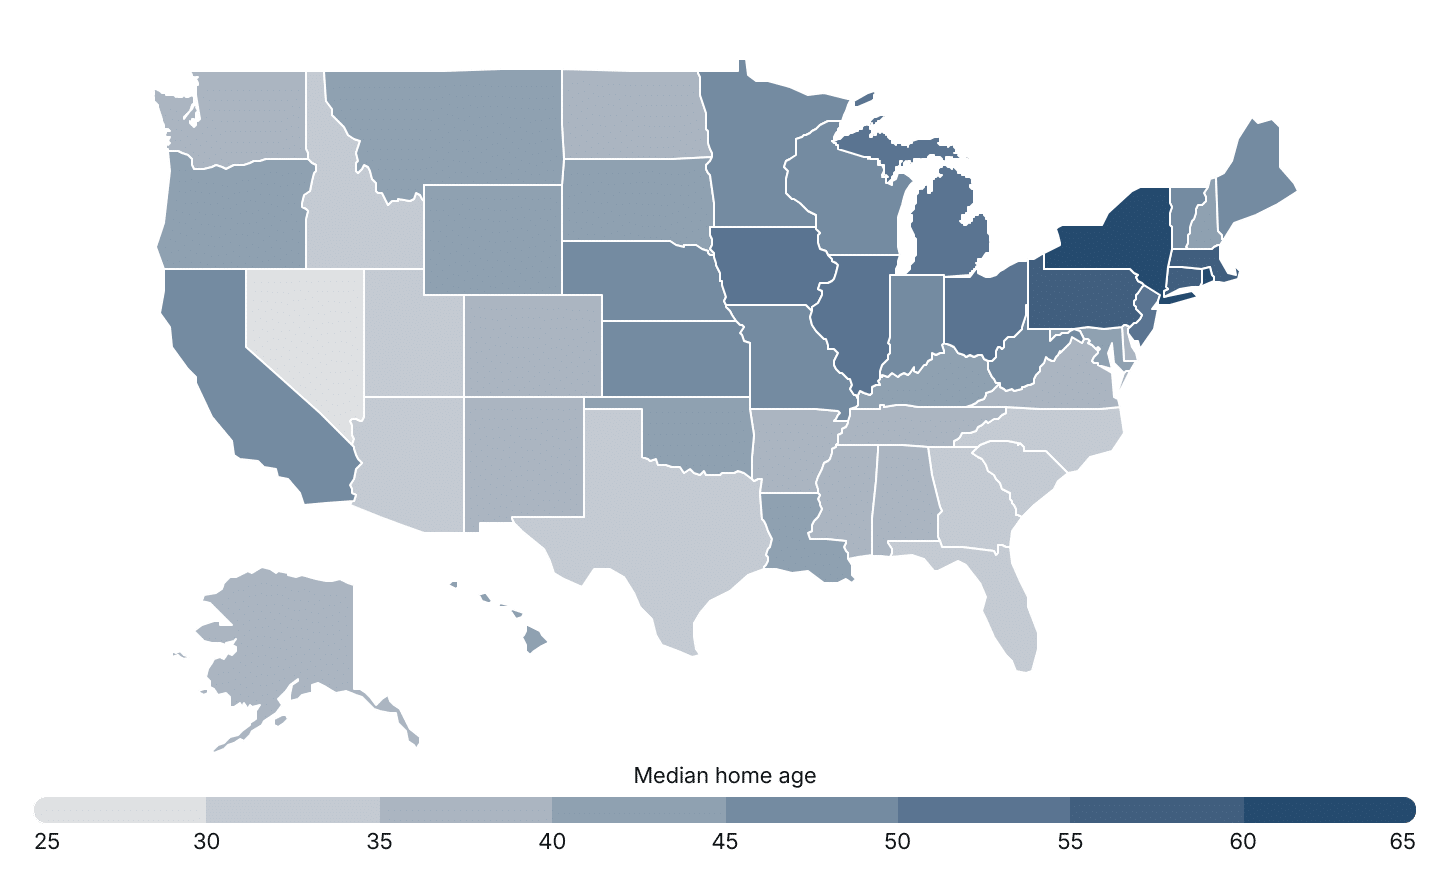
Which States Have the Oldest Homes?
States in the Northeast and Midwest have the oldest housing stock in the nation
Data: Median Housing Age by U.S. State
| State | Median home age |
|---|---|
| New York | 65 |
| Rhode Island | 60 |
| Massachusetts | 59 |
| Pennsylvania | 58 |
| Connecticut | 57 |
| Illinois | 53 |
| Ohio | 53 |
| New Jersey | 53 |
| Michigan | 52 |
| Iowa | 51 |
| Nebraska | 48 |
| Wisconsin | 48 |
| Kansas | 48 |
| Vermont | 47 |
| California | 47 |
| West Virginia | 47 |
| Indiana | 47 |
| Maine | 46 |
| Missouri | 46 |
| Minnesota | 45 |
| New Hampshire | 44 |
| Maryland | 44 |
| Hawaii | 43 |
| Oregon | 42 |
| Wyoming | 42 |
| Oklahoma | 42 |
| Montana | 41 |
| Kentucky | 41 |
| Louisiana | 41 |
| South Dakota | 40 |
| North Dakota | 39 |
| Virginia | 39 |
| New Mexico | 39 |
| Alaska | 38 |
| Washington | 37 |
| Alabama | 37 |
| Mississippi | 37 |
| Delaware | 36 |
| Tennessee | 36 |
| Arkansas | 35 |
| Colorado | 35 |
| Florida | 34 |
| Idaho | 31 |
| North Carolina | 31 |
| South Carolina | 31 |
| Georgia | 31 |
| Utah | 30 |
| Texas | 30 |
| Arizona | 30 |
| Nevada | 27 |
However, the aging of the U.S. housing stock varies across geographies. Areas that have grown quickly in recent decades, including Sun Belt states like Nevada (27 years) and Arizona (30 years), have the lowest median home ages. Many of these regions are also among the cities investing the most in new housing, helping keep their housing stock relatively young. On the other hand, states in the Northeast and Midwest tend to have the oldest supply, led by New York with a median home age of 65 years. At the state and local levels, many of the locations with the oldest homes used to be heavily populated, denser areas but have had stagnant or declining populations in recent years. With fewer people moving in and more limited space for new construction, these places have found it difficult to add new housing inventory.
Liability risks during residential renovations
Contractor general liability insurance helps protect businesses from claims involving property damage, job-site injuries, or faulty workmanship during renovation and construction work.
Below is a complete breakdown of 387 metropolitan areas in the U.S. and all 50 states. The study was conducted by Construction Coverage using data from the U.S. Census Bureau. For more information, refer to the methodology.
Large Metros With the Oldest Homes
| Top Large Metros | Home Age* |
|---|---|
| 1. Buffalo-Cheektowaga, NY | 66 |
| 2. Pittsburgh, PA | 64 |
| 3. New York-Newark-Jersey City, NY-NJ | 63 |
| 4. Cleveland, OH | 61 |
| 5. Providence-Warwick, RI-MA | 60 |
| 6. Boston-Cambridge-Newton, MA-NH | 59 |
| 7. Philadelphia-Camden-Wilmington, PA-NJ-DE-MD | 58 |
| 8. Rochester, NY | 57 |
| 9. Hartford-West Hartford-East Hartford, CT | 56 |
| 10. Milwaukee-Waukesha, WI | 56 |
| 11. Detroit-Warren-Dearborn, MI | 56 |
| 12. San Francisco-Oakland-Fremont, CA | 56 |
| 13. Los Angeles-Long Beach-Anaheim, CA | 55 |
| 14. Chicago-Naperville-Elgin, IL-IN | 52 |
| 15. St. Louis, MO-IL | 50 |
| Bottom Large Metros | Home Age* |
|---|---|
| 1. Austin-Round Rock-San Marcos, TX | 19 |
| 2. Raleigh-Cary, NC | 22 |
| 3. Las Vegas-Henderson-North Las Vegas, NV | 25 |
| 4. Charlotte-Concord-Gastonia, NC-SC | 26 |
| 5. Orlando-Kissimmee-Sanford, FL | 27 |
| 6. Houston-Pasadena-The Woodlands, TX | 27 |
| 7. Atlanta-Sandy Springs-Roswell, GA | 28 |
| 8. Dallas-Fort Worth-Arlington, TX | 28 |
| 9. Jacksonville, FL | 28 |
| 10. Nashville-Davidson–Murfreesboro–Franklin, TN | 28 |
| 11. San Antonio-New Braunfels, TX | 28 |
| 12. Phoenix-Mesa-Chandler, AZ | 29 |
| 13. Denver-Aurora-Centennial, CO | 35 |
| 14. Salt Lake City-Murray, UT | 35 |
| 15. Riverside-San Bernardino-Ontario, CA | 37 |
States With the Oldest Homes
| Top States | Home Age* |
|---|---|
| 1. New York | 65 |
| 2. Rhode Island | 60 |
| 3. Massachusetts | 59 |
| 4. Pennsylvania | 58 |
| 5. Connecticut | 57 |
| 6. Illinois | 53 |
| 7. Ohio | 53 |
| 8. New Jersey | 53 |
| 9. Michigan | 52 |
| 10. Iowa | 51 |
| 11. Nebraska | 48 |
| 12. Wisconsin | 48 |
| 13. Kansas | 48 |
| 14. Vermont | 47 |
| 15. California | 47 |
| Bottom States | Home Age* |
|---|---|
| 1. Nevada | 27 |
| 2. Arizona | 30 |
| 3. Texas | 30 |
| 4. Utah | 30 |
| 5. Georgia | 31 |
| 6. South Carolina | 31 |
| 7. North Carolina | 31 |
| 8. Idaho | 31 |
| 9. Florida | 34 |
| 10. Colorado | 35 |
| 11. Arkansas | 35 |
| 12. Tennessee | 36 |
| 13. Delaware | 36 |
| 14. Mississippi | 37 |
| 15. Alabama | 37 |
*Median home age
Full Results
Methodology
The data used in this analysis is from the U.S. Census Bureau’s 2024 American Community Survey 1-Year Estimates. To determine the locations with the oldest homes, researchers calculated the median age of residential housing units based on the year each unit was built. In the event of a tie, the location with the larger percentage of homes built before 1980 was ranked higher. To improve relevance, metropolitan statistical areas were grouped into cohorts based on population size: small (less than 350,000), midsize (350,000–999,999), and large (1,000,000 or more).
References
- U.S. Census Bureau and U.S. Department of Housing and Urban Development (February 25, 2026). Median Sales Price of Houses Sold for the United States. https://fred.stlouisfed.org/series/MSPUS.
- Freddie Mac. (March 5, 2026). 30-Year Fixed Rate Mortgage Average in the United States. https://fred.stlouisfed.org/series/MORTGAGE30US.
- deRitis, C., et al. (July 2025). Bringing the Housing Shortage Into Sharper Focus. Urban Institute. https://www.urban.org/sites/default/files/2025-07/Bringing-Housing-Shortage-Into-Sharper-Focus.pdf.
- Martín, C. (March 23, 2023). Despite a Pandemic Remodeling Boom, Aging US Homes Require Additional Investment. Harvard Joint Center for Housing Studies. https://www.jchs.harvard.edu/blog/despite-pandemic-remodeling-boom-aging-us-homes-require-additional-investment.
- U.S. Census Bureau (2024). American Community Survey 1-Year Estimates. https://www.census.gov/data/developers/data-sets/acs-1year.html.