
U.S. Cities With the Highest Rent Prices
Note: This is the most recent release of our U.S. Cities With the Highest Rent Prices study. To see data from previous years, please visit the Full Results section below.
While the inflation rate has stabilized, it persists above the Federal Open Market Committee’s 2% target, with the cost of shelter continuing to pressure consumer wallets. Data released by the Bureau of Labor Statistics in October 2025 showed the overall Consumer Price Index up 3.0% year-over-year; however, the index for shelter rose 3.6% during that same period. Sustained rent prices remain a driving force behind these higher housing costs.
The dynamics of the rental market in recent years largely reflect simple supply and demand. In the years following the housing crash and Great Recession, the number of new housing construction projects plummeted and was slow to recover over the course of the 2010s. Around the same time, the Millennial generation—America’s largest, with more than 72 million members—began to reach adulthood, introducing greater demand in the market.
Economic conditions during the COVID-19 pandemic exacerbated issues within the rental market. As fast-rising real estate values priced more people out of homebuying, rental markets became more competitive among consumers. On the supply side, inflation in the cost of materials, high interest rates, and tightness in the labor market have all contributed to difficulties in developing new housing stock.
Rental Housing Supply and Prices Over Time
After a historically tight rental market during COVID, rental price inflation has slowed and vacancy rates are on the rise
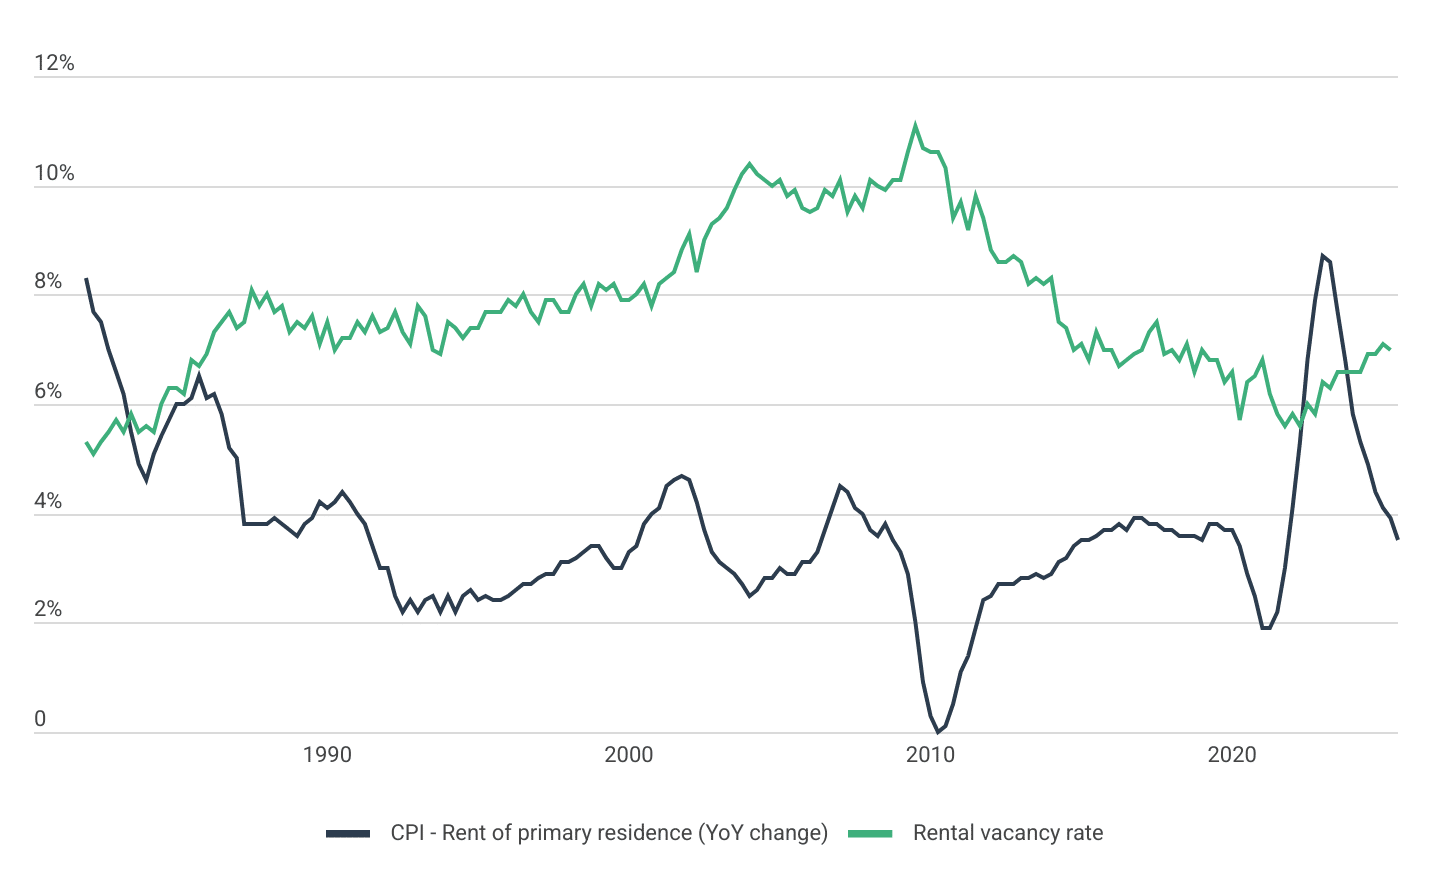
Data: U.S. Rent CPI and Vacancy Rate Time Series
| Date | CPI – Rent of primary residence (YoY change) | Rental vacancy rate |
|---|---|---|
| 1/1/1982 | 8.3% | 5.3% |
| 4/1/1982 | 7.7% | 5.1% |
| 7/1/1982 | 7.5% | 5.3% |
| 10/1/1982 | 7.0% | 5.5% |
| 1/1/1983 | 6.6% | 5.7% |
| 4/1/1983 | 6.2% | 5.5% |
| 7/1/1983 | 5.5% | 5.8% |
| 10/1/1983 | 4.9% | 5.5% |
| 1/1/1984 | 4.6% | 5.6% |
| 4/1/1984 | 5.1% | 5.5% |
| 7/1/1984 | 5.4% | 6.0% |
| 10/1/1984 | 5.7% | 6.3% |
| 1/1/1985 | 6.0% | 6.3% |
| 4/1/1985 | 6.0% | 6.2% |
| 7/1/1985 | 6.1% | 6.8% |
| 10/1/1985 | 6.5% | 6.7% |
| 1/1/1986 | 6.1% | 6.9% |
| 4/1/1986 | 6.2% | 7.3% |
| 7/1/1986 | 5.8% | 7.5% |
| 10/1/1986 | 5.2% | 7.7% |
| 1/1/1987 | 5.0% | 7.4% |
| 4/1/1987 | 3.8% | 7.5% |
| 7/1/1987 | 3.8% | 8.1% |
| 10/1/1987 | 3.8% | 7.8% |
| 1/1/1988 | 3.8% | 8.0% |
| 4/1/1988 | 3.9% | 7.7% |
| 7/1/1988 | 3.8% | 7.8% |
| 10/1/1988 | 3.7% | 7.3% |
| 1/1/1989 | 3.6% | 7.5% |
| 4/1/1989 | 3.8% | 7.4% |
| 7/1/1989 | 3.9% | 7.6% |
| 10/1/1989 | 4.2% | 7.1% |
| 1/1/1990 | 4.1% | 7.5% |
| 4/1/1990 | 4.2% | 7.0% |
| 7/1/1990 | 4.4% | 7.2% |
| 10/1/1990 | 4.2% | 7.2% |
| 1/1/1991 | 4.0% | 7.5% |
| 4/1/1991 | 3.8% | 7.3% |
| 7/1/1991 | 3.4% | 7.6% |
| 10/1/1991 | 3.0% | 7.3% |
| 1/1/1992 | 3.0% | 7.4% |
| 4/1/1992 | 2.5% | 7.7% |
| 7/1/1992 | 2.2% | 7.3% |
| 10/1/1992 | 2.4% | 7.1% |
| 1/1/1993 | 2.2% | 7.8% |
| 4/1/1993 | 2.4% | 7.6% |
| 7/1/1993 | 2.5% | 7.0% |
| 10/1/1993 | 2.2% | 6.9% |
| 1/1/1994 | 2.5% | 7.5% |
| 4/1/1994 | 2.2% | 7.4% |
| 7/1/1994 | 2.5% | 7.2% |
| 10/1/1994 | 2.6% | 7.4% |
| 1/1/1995 | 2.4% | 7.4% |
| 4/1/1995 | 2.5% | 7.7% |
| 7/1/1995 | 2.4% | 7.7% |
| 10/1/1995 | 2.4% | 7.7% |
| 1/1/1996 | 2.5% | 7.9% |
| 4/1/1996 | 2.6% | 7.8% |
| 7/1/1996 | 2.7% | 8.0% |
| 10/1/1996 | 2.7% | 7.7% |
| 1/1/1997 | 2.8% | 7.5% |
| 4/1/1997 | 2.9% | 7.9% |
| 7/1/1997 | 2.9% | 7.9% |
| 10/1/1997 | 3.1% | 7.7% |
| 1/1/1998 | 3.1% | 7.7% |
| 4/1/1998 | 3.2% | 8.0% |
| 7/1/1998 | 3.3% | 8.2% |
| 10/1/1998 | 3.4% | 7.8% |
| 1/1/1999 | 3.4% | 8.2% |
| 4/1/1999 | 3.2% | 8.1% |
| 7/1/1999 | 3.0% | 8.2% |
| 10/1/1999 | 3.0% | 7.9% |
| 1/1/2000 | 3.3% | 7.9% |
| 4/1/2000 | 3.4% | 8.0% |
| 7/1/2000 | 3.8% | 8.2% |
| 10/1/2000 | 4.0% | 7.8% |
| 1/1/2001 | 4.1% | 8.2% |
| 4/1/2001 | 4.5% | 8.3% |
| 7/1/2001 | 4.6% | 8.4% |
| 10/1/2001 | 4.7% | 8.8% |
| 1/1/2002 | 4.6% | 9.1% |
| 4/1/2002 | 4.2% | 8.4% |
| 7/1/2002 | 3.7% | 9.0% |
| 10/1/2002 | 3.3% | 9.3% |
| 1/1/2003 | 3.1% | 9.4% |
| 4/1/2003 | 3.0% | 9.6% |
| 7/1/2003 | 2.9% | 9.9% |
| 10/1/2003 | 2.7% | 10.2% |
| 1/1/2004 | 2.5% | 10.4% |
| 4/1/2004 | 2.6% | 10.2% |
| 7/1/2004 | 2.8% | 10.1% |
| 10/1/2004 | 2.8% | 10.0% |
| 1/1/2005 | 3.0% | 10.1% |
| 4/1/2005 | 2.9% | 9.8% |
| 7/1/2005 | 2.9% | 9.9% |
| 10/1/2005 | 3.1% | 9.6% |
| 1/1/2006 | 3.1% | 9.5% |
| 4/1/2006 | 3.3% | 9.6% |
| 7/1/2006 | 3.7% | 9.9% |
| 10/1/2006 | 4.1% | 9.8% |
| 1/1/2007 | 4.5% | 10.1% |
| 4/1/2007 | 4.4% | 9.5% |
| 7/1/2007 | 4.1% | 9.8% |
| 10/1/2007 | 4.0% | 9.6% |
| 1/1/2008 | 3.7% | 10.1% |
| 4/1/2008 | 3.6% | 10.0% |
| 7/1/2008 | 3.8% | 9.9% |
| 10/1/2008 | 3.5% | 10.1% |
| 1/1/2009 | 3.3% | 10.1% |
| 4/1/2009 | 2.9% | 10.6% |
| 7/1/2009 | 2.0% | 11.1% |
| 10/1/2009 | 0.9% | 10.7% |
| 1/1/2010 | 0.3% | 10.6% |
| 4/1/2010 | 0.0% | 10.6% |
| 7/1/2010 | 0.1% | 10.3% |
| 10/1/2010 | 0.5% | 9.4% |
| 1/1/2011 | 1.1% | 9.7% |
| 4/1/2011 | 1.4% | 9.2% |
| 7/1/2011 | 1.9% | 9.8% |
| 10/1/2011 | 2.4% | 9.4% |
| 1/1/2012 | 2.5% | 8.8% |
| 4/1/2012 | 2.7% | 8.6% |
| 7/1/2012 | 2.7% | 8.6% |
| 10/1/2012 | 2.7% | 8.7% |
| 1/1/2013 | 2.8% | 8.6% |
| 4/1/2013 | 2.8% | 8.2% |
| 7/1/2013 | 2.9% | 8.3% |
| 10/1/2013 | 2.8% | 8.2% |
| 1/1/2014 | 2.9% | 8.3% |
| 4/1/2014 | 3.1% | 7.5% |
| 7/1/2014 | 3.2% | 7.4% |
| 10/1/2014 | 3.4% | 7.0% |
| 1/1/2015 | 3.5% | 7.1% |
| 4/1/2015 | 3.5% | 6.8% |
| 7/1/2015 | 3.6% | 7.3% |
| 10/1/2015 | 3.7% | 7.0% |
| 1/1/2016 | 3.7% | 7.0% |
| 4/1/2016 | 3.8% | 6.7% |
| 7/1/2016 | 3.7% | 6.8% |
| 10/1/2016 | 3.9% | 6.9% |
| 1/1/2017 | 3.9% | 7.0% |
| 4/1/2017 | 3.8% | 7.3% |
| 7/1/2017 | 3.8% | 7.5% |
| 10/1/2017 | 3.7% | 6.9% |
| 1/1/2018 | 3.7% | 7.0% |
| 4/1/2018 | 3.6% | 6.8% |
| 7/1/2018 | 3.6% | 7.1% |
| 10/1/2018 | 3.6% | 6.6% |
| 1/1/2019 | 3.5% | 7.0% |
| 4/1/2019 | 3.8% | 6.8% |
| 7/1/2019 | 3.8% | 6.8% |
| 10/1/2019 | 3.7% | 6.4% |
| 1/1/2020 | 3.7% | 6.6% |
| 4/1/2020 | 3.4% | 5.7% |
| 7/1/2020 | 2.9% | 6.4% |
| 10/1/2020 | 2.5% | 6.5% |
| 1/1/2021 | 1.9% | 6.8% |
| 4/1/2021 | 1.9% | 6.2% |
| 7/1/2021 | 2.2% | 5.8% |
| 10/1/2021 | 3.0% | 5.6% |
| 1/1/2022 | 4.1% | 5.8% |
| 4/1/2022 | 5.3% | 5.6% |
| 7/1/2022 | 6.8% | 6.0% |
| 10/1/2022 | 7.9% | 5.8% |
| 1/1/2023 | 8.7% | 6.4% |
| 4/1/2023 | 8.6% | 6.3% |
| 7/1/2023 | 7.7% | 6.6% |
| 10/1/2023 | 6.8% | 6.6% |
| 1/1/2024 | 5.8% | 6.6% |
| 4/1/2024 | 5.3% | 6.6% |
| 7/1/2024 | 4.9% | 6.9% |
| 10/1/2024 | 4.4% | 6.9% |
| 1/1/2025 | 4.1% | 7.1% |
| 4/1/2025 | 3.9% | 7.0% |
| 7/1/2025 | 3.5% |
These market dynamics have shifted noticeably over the last year. As supply catches up with demand, the national rental vacancy rate has climbed from its recent lows to 7%—a return to levels more consistent with pre-pandemic norms. With more units available, the pace of price increases has cooled significantly. The year-over-year increase in rents has decelerated from a peak of 8.7% in Q1 2023 to just 3.5% in Q3 2025. While this slowdown marks a return to a more stable environment, renters continue to face steep housing costs due to the compounding effect of previous rent hikes.
Residential Rent Prices by Location
Rents in top coastal states are roughly double those found in the lower-cost parts of the Midwest, South, and Great Plains
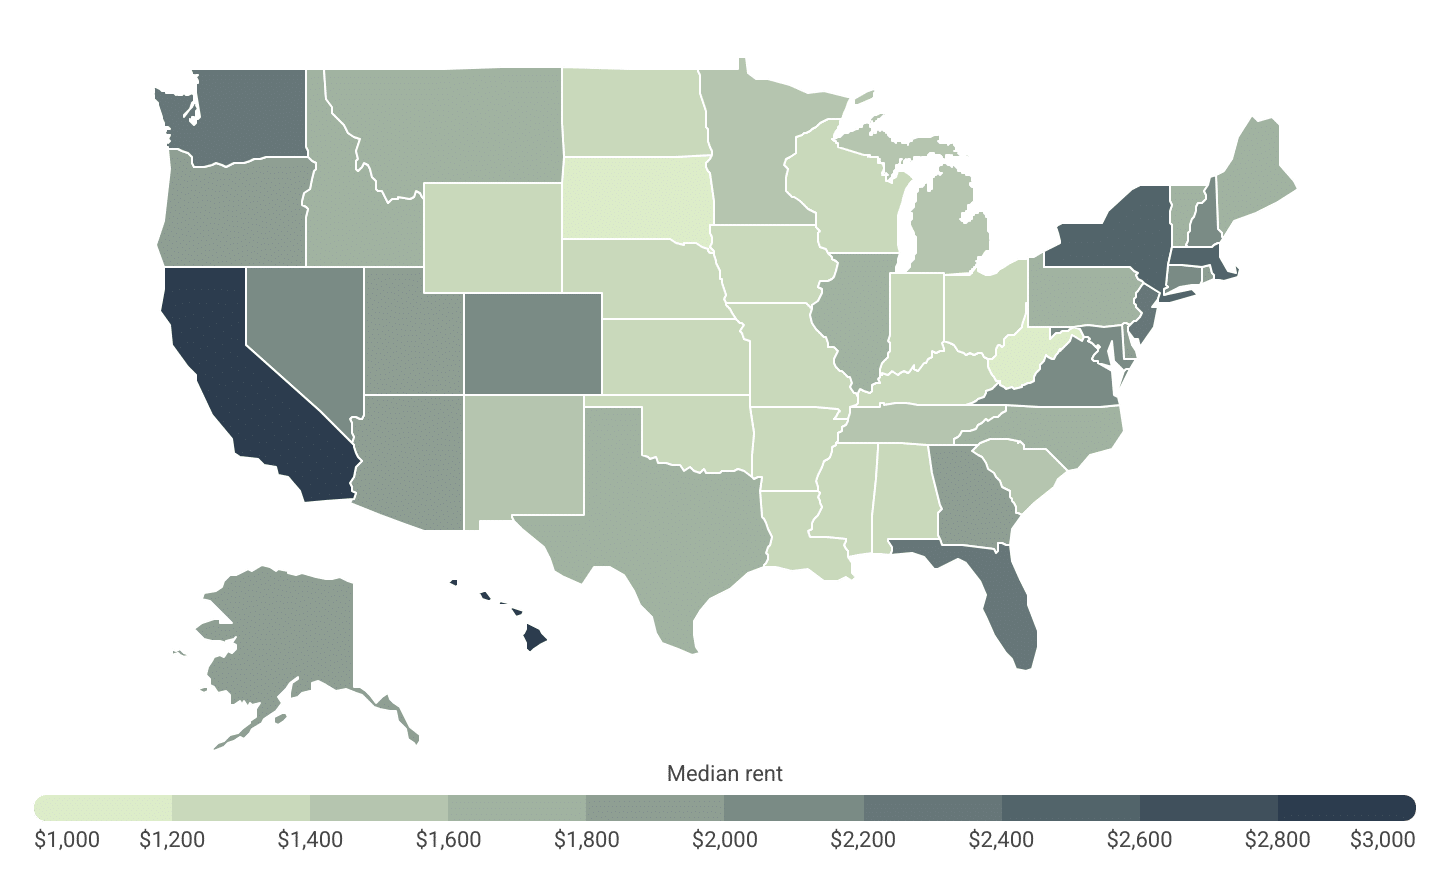
Data: Median Rent by State
| State | Median rent |
|---|---|
| California | $2,895 |
| Hawaii | $2,869 |
| Massachusetts | $2,595 |
| New York | $2,592 |
| New Jersey | $2,373 |
| Washington | $2,237 |
| Florida | $2,220 |
| Maryland | $2,195 |
| New Hampshire | $2,143 |
| Connecticut | $2,127 |
| Colorado | $2,076 |
| Nevada | $2,062 |
| Virginia | $2,011 |
| Arizona | $1,986 |
| Oregon | $1,927 |
| Delaware | $1,871 |
| Rhode Island | $1,867 |
| Utah | $1,837 |
| Georgia | $1,819 |
| Alaska | $1,800 |
| Maine | $1,734 |
| Illinois | $1,733 |
| Texas | $1,722 |
| Vermont | $1,721 |
| Montana | $1,713 |
| Idaho | $1,644 |
| North Carolina | $1,621 |
| Pennsylvania | $1,619 |
| South Carolina | $1,580 |
| Minnesota | $1,575 |
| Tennessee | $1,561 |
| New Mexico | $1,509 |
| Michigan | $1,423 |
| Indiana | $1,353 |
| Wisconsin | $1,342 |
| Ohio | $1,336 |
| Nebraska | $1,295 |
| Alabama | $1,290 |
| Oklahoma | $1,288 |
| Louisiana | $1,278 |
| Missouri | $1,275 |
| Kansas | $1,247 |
| Kentucky | $1,239 |
| Wyoming | $1,236 |
| Arkansas | $1,231 |
| Iowa | $1,212 |
| Mississippi | $1,202 |
| North Dakota | $1,201 |
| South Dakota | $1,185 |
| West Virginia | $1,126 |
However, the impact of rent increases has not been felt evenly across the U.S., as renters in some locations face much higher costs than in others. Recently released data from the Department of Housing and Urban Development (HUD) shows that 13 states now have median market rents exceeding $2,000 per month, an increase from 12 states last year. California leads the list with a median rent of $2,895, followed by Hawaii at $2,869, Massachusetts at $2,595, and New York at $2,592.
Beyond the broader national supply and demand trends, many of these high-cost areas experience even greater pressures due to strong local economies, high levels of tourism, and more severe supply constraints. These constraints stem from a combination of strict regulations, zoning laws, and geographic limitations that make it particularly difficult to increase housing availability in these regions.
High rent markets often push construction crews farther from urban jobsites
As workers live farther from city centers, contractors rely more heavily on business vehicles to move labor and equipment each day. Commercial auto insurance helps cover accidents and damage tied to operating company vehicles in dense, high-traffic metros.
Unsurprisingly, the states with the highest rents are also home to some of the nation’s priciest metropolitan areas for renters. California dominates the list, claiming 9 of the 10 most expensive metros overall, including four of the five most expensive large metros with populations of one million or more.
Below is a complete breakdown of rental prices across more than 380 metropolitan areas grouped by size and all 50 states. The analysis was conducted by researchers at Construction Coverage using data from the U.S. Department of Housing and Urban Development and the U.S. Census Bureau. For more information on how each statistic was computed, refer to the methodology section below.
Most & Least Expensive Cities for Renters
| Top Large Metros | Median Rent* |
|---|---|
| 1. San Jose-Sunnyvale-Santa Clara, CA | $3,865 |
| 2. San Francisco-Oakland-Fremont, CA | $3,442 |
| 3. San Diego-Chula Vista-Carlsbad, CA | $3,360 |
| 4. Los Angeles-Long Beach-Anaheim, CA | $2,953 |
| 5. New York-Newark-Jersey City, NY-NJ | $2,924 |
| 6. Boston-Cambridge-Newton, MA-NH | $2,839 |
| 7. Riverside-San Bernardino-Ontario, CA | $2,681 |
| 8. Sacramento-Roseville-Folsom, CA | $2,600 |
| 9. Seattle-Tacoma-Bellevue, WA | $2,593 |
| 10. Miami-Fort Lauderdale-West Palm Beach, FL | $2,593 |
| 11. Washington-Arlington-Alexandria, DC-VA-MD-WV | $2,457 |
| 12. Orlando-Kissimmee-Sanford, FL | $2,299 |
| 13. Denver-Aurora-Centennial, CO | $2,251 |
| 14. Tampa-St. Petersburg-Clearwater, FL | $2,248 |
| 15. Portland-Vancouver-Hillsboro, OR-WA | $2,151 |
| Bottom Large Metros | Median Rent* |
|---|---|
| 1. St. Louis, MO-IL | $1,334 |
| 2. Tulsa, OK | $1,360 |
| 3. Louisville/Jefferson County, KY-IN | $1,364 |
| 4. Cleveland, OH | $1,384 |
| 5. Pittsburgh, PA | $1,412 |
| 6. Oklahoma City, OK | $1,421 |
| 7. Milwaukee-Waukesha, WI | $1,433 |
| 8. Birmingham, AL | $1,467 |
| 9. Cincinnati, OH-KY-IN | $1,472 |
| 10. Omaha, NE-IA | $1,476 |
| 11. Buffalo-Cheektowaga, NY | $1,493 |
| 12. Detroit-Warren-Dearborn, MI | $1,527 |
| 13. Columbus, OH | $1,534 |
| 14. Kansas City, MO-KS | $1,538 |
| 15. Tucson, AZ | $1,555 |
| Top Midsize Metros | Median Rent* |
|---|---|
| 1. Santa Maria-Santa Barbara, CA | $3,684 |
| 2. Oxnard-Thousand Oaks-Ventura, CA | $3,206 |
| 3. Santa Rosa-Petaluma, CA | $3,141 |
| 4. Urban Honolulu, HI | $3,006 |
| 5. Salinas, CA | $2,727 |
| 6. Bridgeport-Stamford-Danbury, CT | $2,694 |
| 7. Vallejo, CA | $2,548 |
| 8. Cape Coral-Fort Myers, FL | $2,342 |
| 9. Naples-Marco Island, FL | $2,302 |
| 10. North Port-Bradenton-Sarasota, FL | $2,255 |
| 11. Stockton-Lodi, CA | $2,184 |
| 12. Worcester, MA | $2,179 |
| 13. Port St. Lucie, FL | $2,174 |
| 14. Manchester-Nashua, NH | $2,173 |
| 15. Modesto, CA | $2,158 |
| Bottom Midsize Metros | Median Rent* |
|---|---|
| 1. Youngstown-Warren, OH | $1,037 |
| 2. Lafayette, LA | $1,109 |
| 3. Huntington-Ashland, WV-KY-OH | $1,111 |
| 4. Peoria, IL | $1,137 |
| 5. Toledo, OH | $1,156 |
| 6. Flint, MI | $1,179 |
| 7. Fort Wayne, IN | $1,192 |
| 8. Canton-Massillon, OH | $1,195 |
| 9. Brownsville-Harlingen, TX | $1,197 |
| 10. Wichita, KS | $1,199 |
| 11. McAllen-Edinburg-Mission, TX | $1,219 |
| 12. Springfield, MO | $1,220 |
| 13. Montgomery, AL | $1,246 |
| 14. Davenport-Moline-Rock Island, IA-IL | $1,254 |
| 15. Hickory-Lenoir-Morganton, NC | $1,254 |
| Top Small Metros | Median Rent* |
|---|---|
| 1. Santa Cruz-Watsonville, CA | $4,279 |
| 2. Napa, CA | $3,187 |
| 3. Kahului-Wailuku, HI | $2,896 |
| 4. San Luis Obispo-Paso Robles, CA | $2,890 |
| 5. Bozeman, MT | $2,593 |
| 6. Barnstable Town, MA | $2,467 |
| 7. Boulder, CO | $2,368 |
| 8. Lexington Park, MD | $2,328 |
| 9. Olympia-Lacey-Tumwater, WA | $2,287 |
| 10. Bremerton-Silverdale-Port Orchard, WA | $2,279 |
| 11. Crestview-Fort Walton Beach-Destin, FL | $2,279 |
| 12. Flagstaff, AZ | $2,274 |
| 13. Burlington-South Burlington, VT | $2,219 |
| 14. Hilton Head Island-Bluffton-Port Royal, SC | $2,149 |
| 15. Charlottesville, VA | $2,131 |
| Bottom Small Metros | Median Rent* |
|---|---|
| 1. Fort Smith, AR-OK | $1,051 |
| 2. Wheeling, WV-OH | $1,056 |
| 3. Joplin, MO-KS | $1,057 |
| 4. Parkersburg-Vienna, WV | $1,068 |
| 5. Decatur, AL | $1,090 |
| 6. Jefferson City, MO | $1,097 |
| 7. Mansfield, OH | $1,101 |
| 8. Weirton-Steubenville, WV-OH | $1,104 |
| 9. Anniston-Oxford, AL | $1,111 |
| 10. Florence-Muscle Shoals, AL | $1,116 |
| 11. Gadsden, AL | $1,123 |
| 12. Charleston, WV | $1,124 |
| 13. Beckley, WV | $1,131 |
| 14. Evansville, IN | $1,134 |
| 15. St. Joseph, MO-KS | $1,138 |
Most & Least Expensive States for Renters
| Top States | Median Rent* |
|---|---|
| 1. California | $2,895 |
| 2. Hawaii | $2,869 |
| 3. Massachusetts | $2,595 |
| 4. New York | $2,592 |
| 5. New Jersey | $2,373 |
| 6. Washington | $2,237 |
| 7. Florida | $2,220 |
| 8. Maryland | $2,195 |
| 9. New Hampshire | $2,143 |
| 10. Connecticut | $2,127 |
| 11. Colorado | $2,076 |
| 12. Nevada | $2,062 |
| 13. Virginia | $2,011 |
| 14. Arizona | $1,986 |
| 15. Oregon | $1,927 |
| Bottom States | Median Rent* |
|---|---|
| 1. West Virginia | $1,126 |
| 2. South Dakota | $1,185 |
| 3. North Dakota | $1,201 |
| 4. Mississippi | $1,202 |
| 5. Iowa | $1,212 |
| 6. Arkansas | $1,231 |
| 7. Wyoming | $1,236 |
| 8. Kentucky | $1,239 |
| 9. Kansas | $1,247 |
| 10. Missouri | $1,275 |
| 11. Louisiana | $1,278 |
| 12. Oklahoma | $1,288 |
| 13. Alabama | $1,290 |
| 14. Nebraska | $1,295 |
| 15. Ohio | $1,336 |
*Median rent
Full Results
Methodology
The data used in this study comes from the U.S. Department of Housing and Urban Development’s 2026 50th Percentile Rent Estimates dataset and the U.S. Census Bureau’s 2024 American Community Survey 1-Year Estimates. To determine the locations with the highest rent prices, researchers at Construction Coverage calculated a median monthly rent estimate across all rental types in each location. This estimate is a weighted average of each location’s median monthly rent price across each rental size category (e.g. studio, one-bedroom, two-bedroom, etc.). The weights used in the calculation were the number of renter-occupied housing units belonging to each size category as reported by the Census Bureau in 2024. In the event of a tie, the location with the greater one-bedroom rent was ranked higher.
For relevance, only locations with complete data were included, and metropolitan areas were grouped into size cohorts based on population: small (less than 350,000), midsize (350,000–999,999), and large (1,000,000 or more).
References
- Board of Governors of the Federal Reserve System (December 10, 2025). Federal Reserve issues FOMC statement. https://www.federalreserve.gov/newsevents/pressreleases/monetary20251210a.htm.
- U.S. Bureau of Labor Statistics (September 2025). Consumer Price Index News Release. https://www.bls.gov/news.release/archives/cpi_10242025.htm.
- Center for American Progress (August 22, 2022). The Rental Housing Crisis Is a Supply Problem That Needs Supply Solutions. https://www.americanprogress.org/article/the-rental-housing-crisis-is-a-supply-problem-that-needs-supply-solutions/.
- Consulting-Specifying Engineer (August 9, 2023). Construction industry struggling with inflation, changing economic dynamics. https://www.csemag.com/construction-industry-struggling-with-inflation-changing-economic-dynamics/.
- U.S. Department of Housing and Urban Development (2026). Fair Market Rents. https://www.huduser.gov/periodicals/ushmc/winter98/summary-2.html.
- U.S. Census Bureau (2024). American Community Survey. https://www.census.gov/programs-surveys/acs.