
Cities With the Most Homebuyers Under 25
Note: This is the most recent release of our Cities With the Most Homebuyers Under 25 study. To see data from previous years, please visit the Full Results section below.
The red-hot residential real estate market that existed during the COVID-19 pandemic has cooled off, but finding a home remains challenging for many buyers. Elevated home prices and high interest rates have made it especially difficult for young, first-time homebuyers to make a purchase.
Some unique, pandemic-related economic factors have contributed to the current state of the market, but some of the largest structural factors driving the current market are generational. Baby boomers and members of the Silent Generation—those born in 1946–1964 and 1925–1945, respectively—are increasingly choosing to age in place as they reach retirement. Simultaneously, the millennial generation, who were born between 1981 and 1996, are now America’s largest generational cohort and at a peak age for buying a first or second home. Together, these forces mean that more buyers are competing for fewer homes. Zillow recently estimated that the U.S. needs 4.5 million more homes to meet current demand.
Trends in Young Adult Homeownership
After peaking during COVID, the under-25 homeownership rate has declined
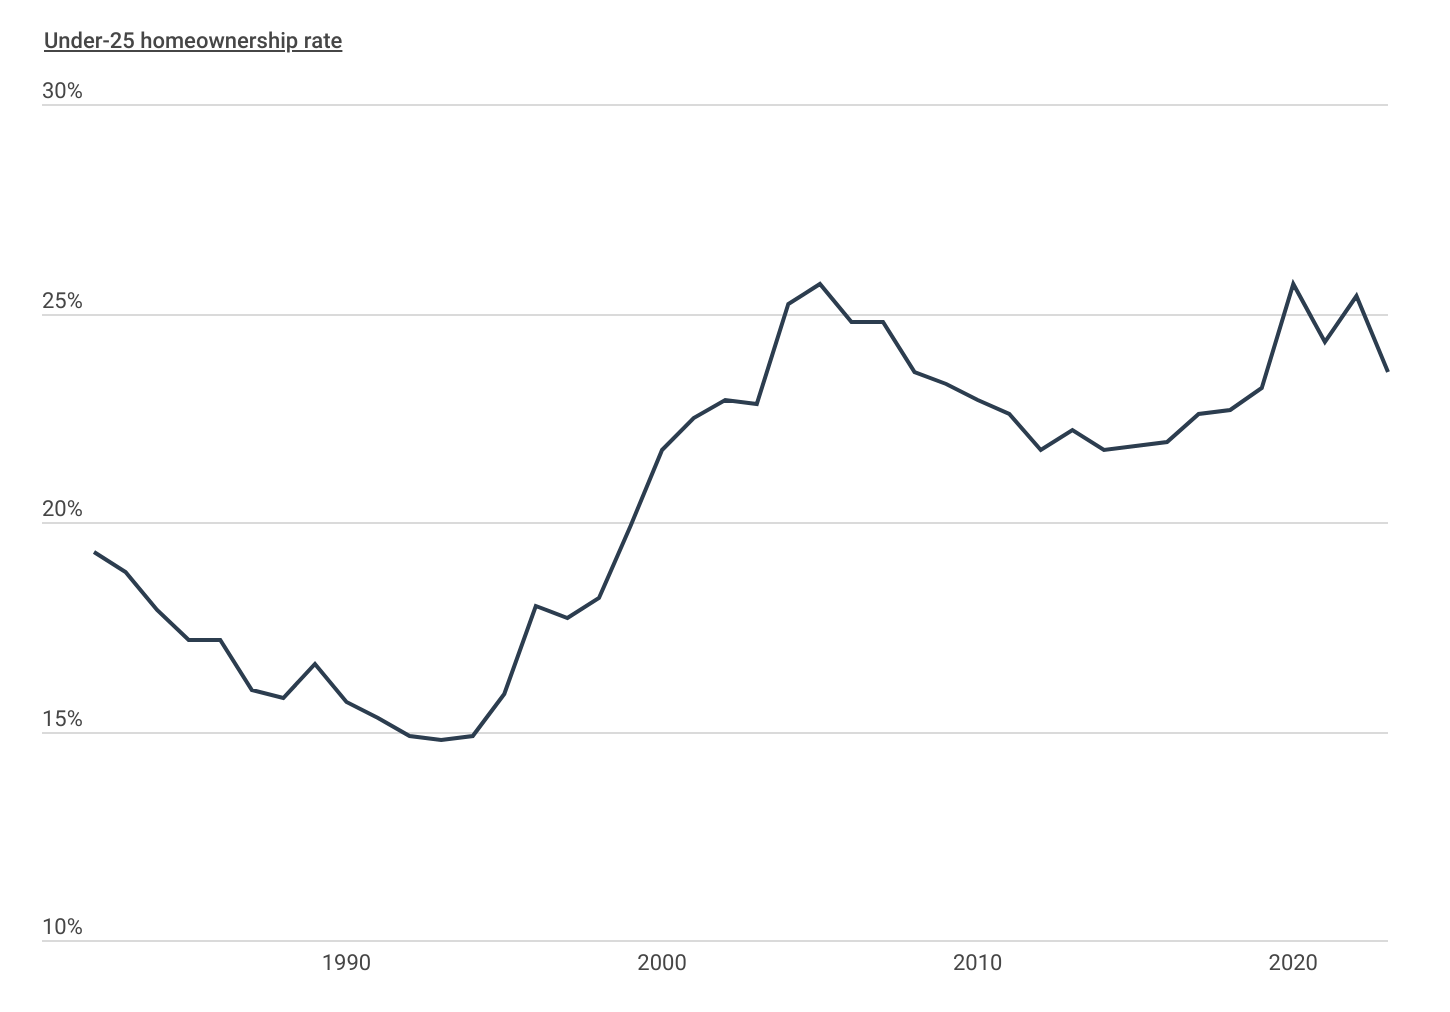
Despite these challenging conditions, young buyers have made progress in homeownership in recent years. The homeownership rate for adults under 25 reached 25.7% in 2020, matching a previous peak from the height of the housing bubble in 2005. While the Great Recession reduced ownership among this group, their rate remained higher throughout the 2010s than in the 1980s and 1990s. However, after peaking during the pandemic, the under-25 homeownership rate has declined to 23.6% as of 2023.
FOR LANDLORDS
Many young buyers are turning to rental properties for extra income, but did you know standard home insurance often doesn’t cover rentals? Discover how the best commercial property insurance companies can offer the protection you need for rental properties.
Home Purchase Loans by Applicant Age
Home purchase loans have dropped below pre-pandemic levels across all age cohorts
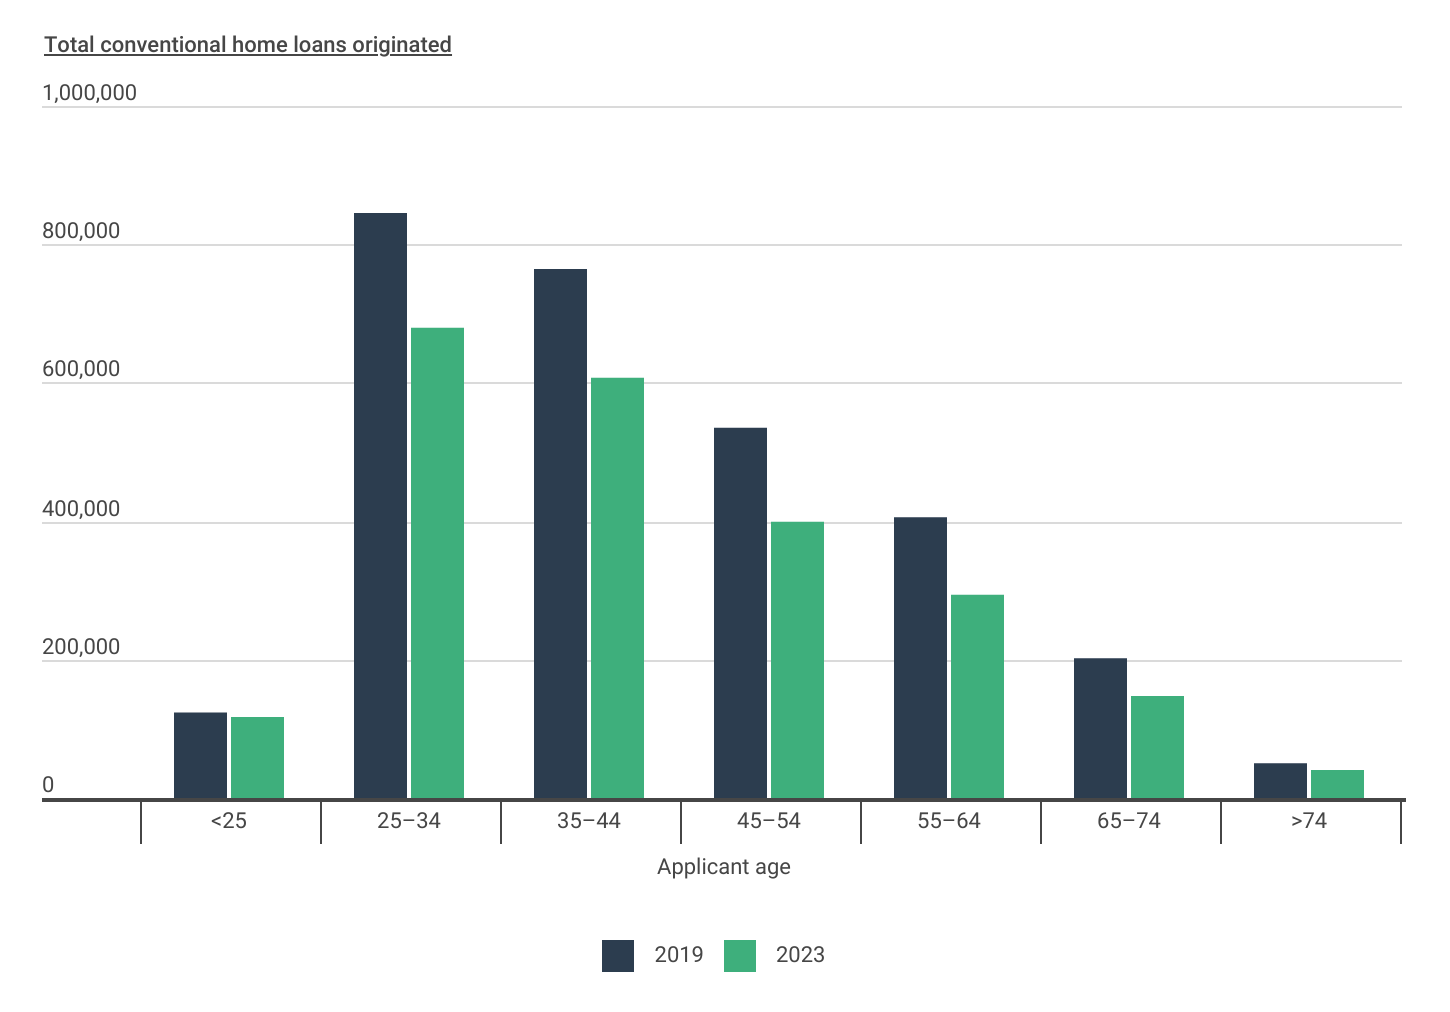
Data from the Home Mortgage Disclosure Act also shows a decline in home purchase loans among young adults. In 2023, home loan originations for adults under 25 dropped by 5.1% compared to 2019, before the pandemic. Despite this decline, the under-25 age group saw the smallest decrease in originations among all age groups, which collectively experienced a drop of 22%. Importantly, this cohort represents one of the smallest in terms of overall loan volume—accounting for roughly 117,000 out of nearly 2.3 million home loans originated last year.
Where Adults Under 25 Are Buying Homes
The Midwest is a hot spot for homebuyers under 25
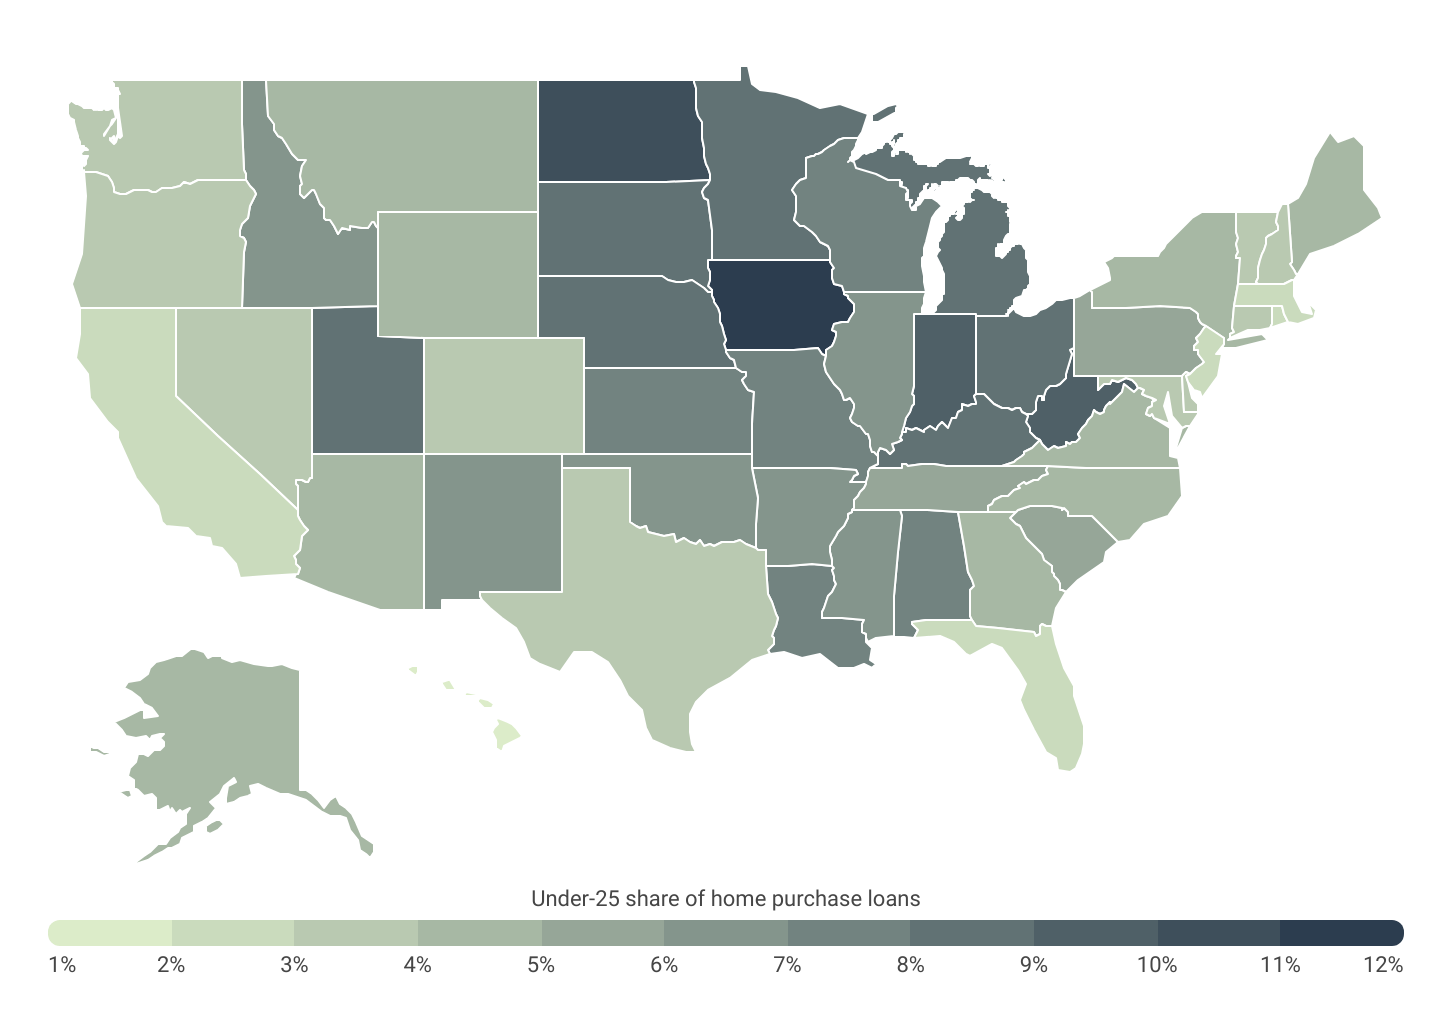
For young adults interested in homeownership, some geographic locations prove more favorable than others. Many of the states with the highest shares of home purchase loans from adults under age 25 are found in the Midwest, led by Iowa at 11.9%. The Midwest tends to have lower home prices, which makes homeownership more attainable. Many leading metros for young homeownership are also found in the affordable Midwest and South. In contrast, high-cost states including Hawaii (1.7%), California (2.1%), and Massachusetts (2.5%) have much lower shares of home purchase loans from young adults. With lower earnings and less savings and equity accumulated than their older counterparts, young adults are more likely to struggle to afford homes in these markets.
Below is a complete breakdown of areas with the most homebuyers under 25 for over 380 metropolitan areas and all 50 states. The analysis was conducted by Construction Coverage, using data from the Federal Financial Institutions Examination Council’s Home Mortgage Disclosure Act dataset. For more information, see the methodology section.
Large Metros With the Most Homebuyers Under 25
| Top Metros | Share* |
|---|---|
| 1. Grand Rapids-Wyoming-Kentwood, MI | 9.1% |
| 2. Cincinnati, OH-KY-IN | 7.7% |
| 3. Louisville/Jefferson County, KY-IN | 7.7% |
| 4. Birmingham, AL | 7.7% |
| 5. Detroit-Warren-Dearborn, MI | 7.0% |
| 6. Salt Lake City-Murray, UT | 7.0% |
| 7. St. Louis, MO-IL | 6.7% |
| 8. Minneapolis-St. Paul-Bloomington, MN-WI | 6.6% |
| 9. Indianapolis-Carmel-Greenwood, IN | 6.6% |
| 10. Cleveland, OH | 6.4% |
| 11. Pittsburgh, PA | 6.4% |
| 12. Tulsa, OK | 6.3% |
| 13. Buffalo-Cheektowaga, NY | 6.2% |
| 14. Oklahoma City, OK | 6.1% |
| 15. Kansas City, MO-KS | 5.9% |
| Bottom Metros | Share* |
|---|---|
| 1. San Francisco-Oakland-Fremont, CA | 1.2% |
| 2. San Jose-Sunnyvale-Santa Clara, CA | 1.3% |
| 3. Los Angeles-Long Beach-Anaheim, CA | 1.5% |
| 4. San Diego-Chula Vista-Carlsbad, CA | 1.9% |
| 5. Riverside-San Bernardino-Ontario, CA | 2.1% |
| 6. Boston-Cambridge-Newton, MA-NH | 2.1% |
| 7. Miami-Fort Lauderdale-West Palm Beach, FL | 2.2% |
| 8. New York-Newark-Jersey City, NY-NJ | 2.4% |
| 9. Sacramento-Roseville-Folsom, CA | 2.5% |
| 10. Orlando-Kissimmee-Sanford, FL | 2.7% |
| 11. Austin-Round Rock-San Marcos, TX | 2.8% |
| 12. Seattle-Tacoma-Bellevue, WA | 2.9% |
| 13. Washington-Arlington-Alexandria, DC-VA-MD-WV | 2.9% |
| 14. Portland-Vancouver-Hillsboro, OR-WA | 3.0% |
| 15. Providence-Warwick, RI-MA | 3.1% |
FOR BUILDERS
Building a new home? Make sure you’re covered by one of our top picks for the best liability insurance for contractors. Protect your project from unexpected risks and ensure smooth construction from the ground up.
States With the Most Homebuyers Under 25
| Top States | Share* |
|---|---|
| 1. Iowa | 11.9% |
| 2. North Dakota | 10.2% |
| 3. Indiana | 9.8% |
| 4. West Virginia | 9.7% |
| 5. South Dakota | 8.6% |
| 6. Ohio | 8.5% |
| 7. Nebraska | 8.5% |
| 8. Kentucky | 8.2% |
| 9. Michigan | 8.1% |
| 10. Minnesota | 8.1% |
| 11. Utah | 8.0% |
| 12. Wisconsin | 7.9% |
| 13. Kansas | 7.9% |
| 14. Alabama | 7.6% |
| 15. Louisiana | 7.4% |
| Bottom States | Share* |
|---|---|
| 1. Hawaii | 1.7% |
| 2. California | 2.1% |
| 3. Massachusetts | 2.5% |
| 4. New Jersey | 2.6% |
| 5. Florida | 2.8% |
| 6. Rhode Island | 2.9% |
| 7. Delaware | 3.2% |
| 8. New Hampshire | 3.2% |
| 9. Oregon | 3.2% |
| 10. Nevada | 3.4% |
| 11. Washington | 3.4% |
| 12. Vermont | 3.6% |
| 13. Colorado | 3.6% |
| 14. Maryland | 3.7% |
| 15. Connecticut | 3.8% |
*Under-25 share of home purchase loans
Full Results
Methodology
The data used in this analysis is from the Federal Financial Institutions Examination Council’s 2023 Home Mortgage Disclosure Act dataset. Only conventional home purchase loans originated in 2023 were considered. To determine the locations with the most homebuyers under 25, researchers calculated the share of home purchase loans taken out by applicants under 25 years old. In the event of a tie, the location with the greater total number of home purchase loans accounted for by applicants under 25 years old was ranked higher. To improve relevance, metros were grouped into cohorts based on population size: small (less than 350,000), midsize (350,000–999,999), and large (1,000,000 or more).
References
- Federal Reserve Bank of St. Louis (July 24, 2024). Median Sales Price of Houses Sold for the United States. https://fred.stlouisfed.org/series/MSPUS.
- Anderson, D. (April 2, 2024). Quarters of Baby Boomers Plan to Stay In Their Home As They Grow Older. Redfin. https://www.redfin.com/news/baby-boomers-aging-in-place/.
- Divounguy, O. (June 18, 2024). Affordability Crisis: Housing Shortage Worsened Despite Pandemic Construction Boom. Zillow. https://www.zillow.com/research/affordability-housing-shortage-34153/.
- Federal Financial Institutions Examination Council (2023). The Home Mortgage Disclosure Act. https://ffiec.cfpb.gov/.
- Redfin (2024). Data Center. https://www.redfin.com/news/data-center/.