
Cities With the Most Women in Construction
Note: This is the most recent release of our Cities With the Most Women in Construction study. To see data from previous years, please visit the Full Results section below.
Construction has long been a male-dominated field. According to recently released data from the U.S. Census Bureau, only 11.5% of payroll employees in the construction industry are women. However, a promising shift is underway. In recent Construction has long been a male-dominated field. According to recently released data from the U.S. Census Bureau, only 11.7% of payroll employees in the construction industry are women. However, a shift is underway. In recent years, the Department of Labor’s Women in Apprenticeship and Nontraditional Occupations (WANTO) grant program has allocated millions of dollars to bolster women’s participation in industries like construction. And with the construction industry facing a massive worker shortage—estimated at 349,000 workers—recruiting women into construction roles has become a necessity for sustaining growth and meeting demand.
Female Construction Employment Over Time
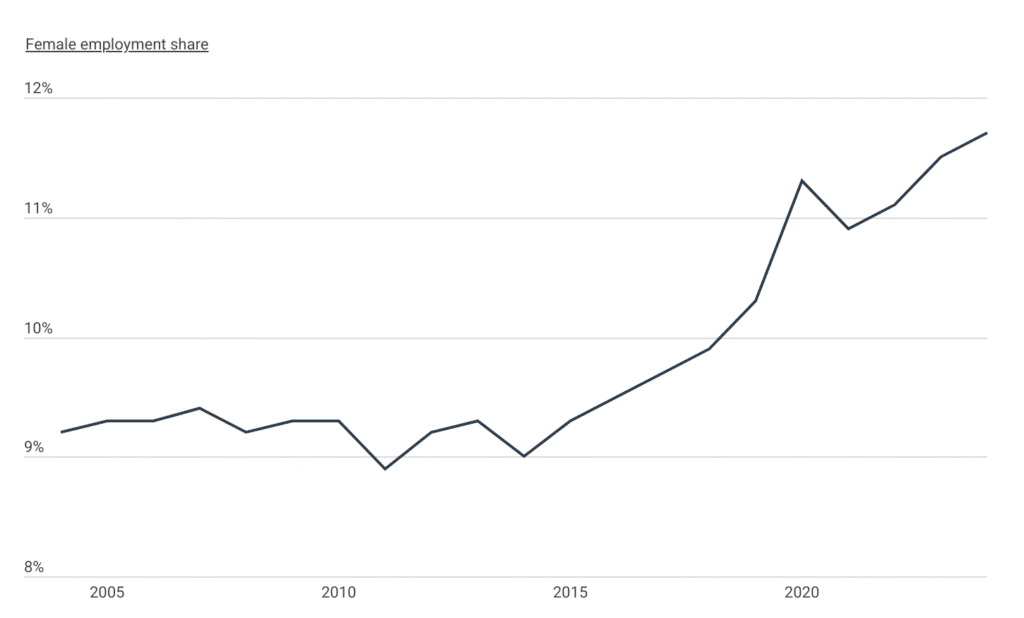
The share of women in construction has increased steadily over the past several years
Data: Female Construction Employment Time Series
| Year | Female employment share |
|---|---|
| 2003 | 9.5% |
| 2004 | 9.2% |
| 2005 | 9.3% |
| 2006 | 9.3% |
| 2007 | 9.4% |
| 2008 | 9.2% |
| 2009 | 9.3% |
| 2010 | 9.3% |
| 2011 | 8.9% |
| 2012 | 9.2% |
| 2013 | 9.3% |
| 2014 | 9.0% |
| 2015 | 9.3% |
| 2016 | 9.5% |
| 2017 | 9.7% |
| 2018 | 9.9% |
| 2019 | 10.3% |
| 2020 | 11.3% |
| 2021 | 10.9% |
| 2022 | 11.1% |
| 2023 | 11.5% |
| 2024 | 11.6% |
The share of women in construction has steadily increased over the past several years. While women remain underrepresented in the workforce, the data reveals a gradual yet consistent upward trend in female employment within the construction sector.
Prior to 2016, women comprised approximately 9% of the construction workforce. This figure held relatively steady for over a decade, fluctuating slightly between 8.9% and 9.5% from 2003 to 2015. However, since 2016, the share of female employees in construction has climbed nearly every year, reaching 11.1% in 2022 and continuing to rise to 11.7% by 2024. This growth reflects both industry efforts to address workforce shortages and initiatives aimed at increasing diversity, such as targeted training programs and grants.
Expanding the workforce increases payroll exposure.
As construction firms hire more workers, their workers’ compensation obligations grow as well. Understanding coverage requirements and cost drivers becomes increasingly important as teams scale.
Female Construction Employment by Occupation Type
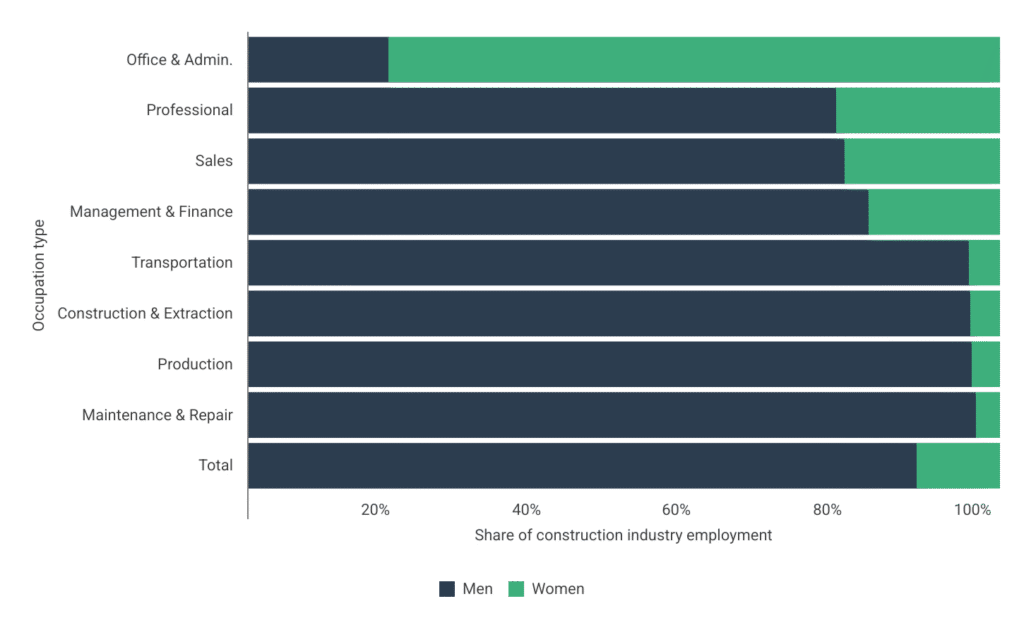
Women in the construction industry are most likely to work in office positions
Data: Male vs. Female Construction Employment Share by Occupation Type
| Occupation type | Men | Women |
|---|---|---|
| Office & Admin. | 100,000 | 437,000 |
| Professional | 286,000 | 80,000 |
| Sales | 149,000 | 39,000 |
| Management & Finance | 2,076,000 | 441,000 |
| Total | 10,684,000 | 1,344,000 |
| Transportation | 326,000 | 14,000 |
| Construction & Extraction | 6,867,000 | 287,000 |
| Production | 208,000 | 8,000 |
| Maintenance & Repair | 618,000 | 20,000 |
Nationwide, over 1.3 million women are employed in the construction sector, compared to more than 10 million men. The women who are employed in the sector are far more likely to work in office and administrative positions, while men dominate field-based roles.
According to the Bureau of Labor Statistics, women make up 81.4% of the construction industry’s office and administrative roles. They also are more highly concentrated in professional, sales, and management roles compared to other occupations in the sector. However, female representation is significantly lower in roles traditionally associated with fieldwork. Only 4.1% of transportation positions and 4.0% of construction and extraction roles are filled by women. The share of employment is even lower in maintenance and repair jobs, as well as production roles, where women account for just 3.7% and 3.1% of workers, respectively.
Field roles come with real jobsite risk.
Construction and extraction positions involve exposure to third-party property damage and bodily injury claims. Find a top-tier general liability insurance insurer to help protect your business when operating in higher-risk environments.
Construction Industry Wages by Sex
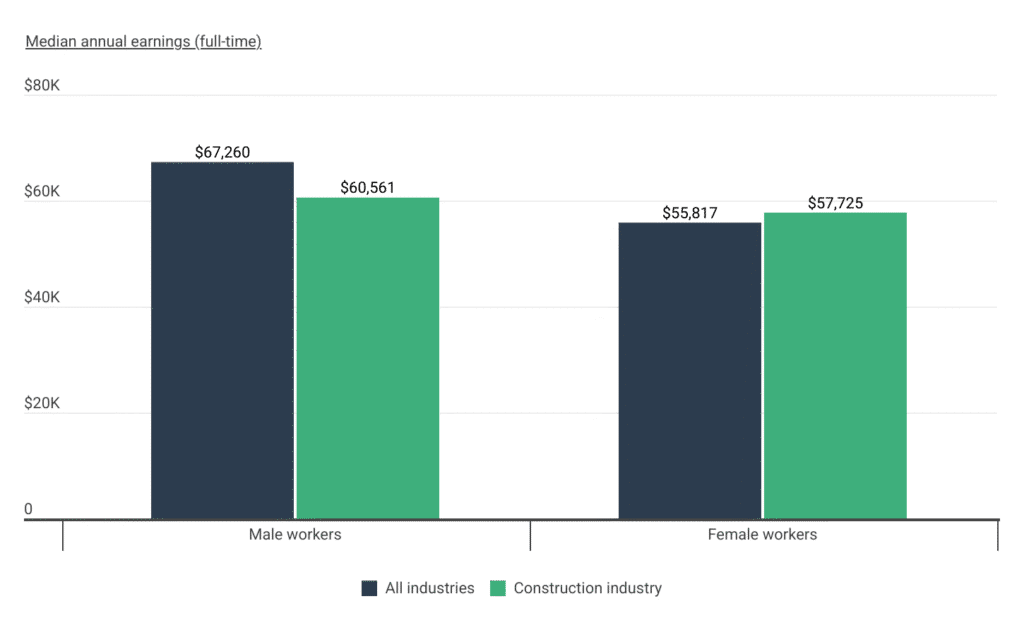
Full-time female workers earn more in construction than in other industries; face smaller wage gaps
Data: Construction Industry Earnings by Sex
| Gender cohort | All industries | Construction industry |
|---|---|---|
| Male workers | $67,260 | $60,561 |
| Female workers | $55,817 | $57,725 |
Women in the construction industry tend to command higher wages than female workers in other fields. The median annual wage for full-time female construction industry workers is $57,725, exceeding the median of $55,817 for women across all industries.
Interestingly, the opposite is true for men in construction, who typically earn less than their counterparts in other sectors. Male workers in the construction industry have a median annual wage of $60,561, compared to $67,260 for male workers across all industries.
Another noteworthy aspect of wages in construction is the narrower gender pay gap. While the national gender pay gap across all industries sits at approximately 17.0%, the gap in construction is significantly smaller at just 4.7%.
Competitive wages require tighter cost control.
With construction offering strong pay across roles, firms need clear visibility into labor costs to protect profitability. Accounting tools help connect payroll, job costing, and overhead in one place.
Geographic Differences in Female Employment in the Construction Industry
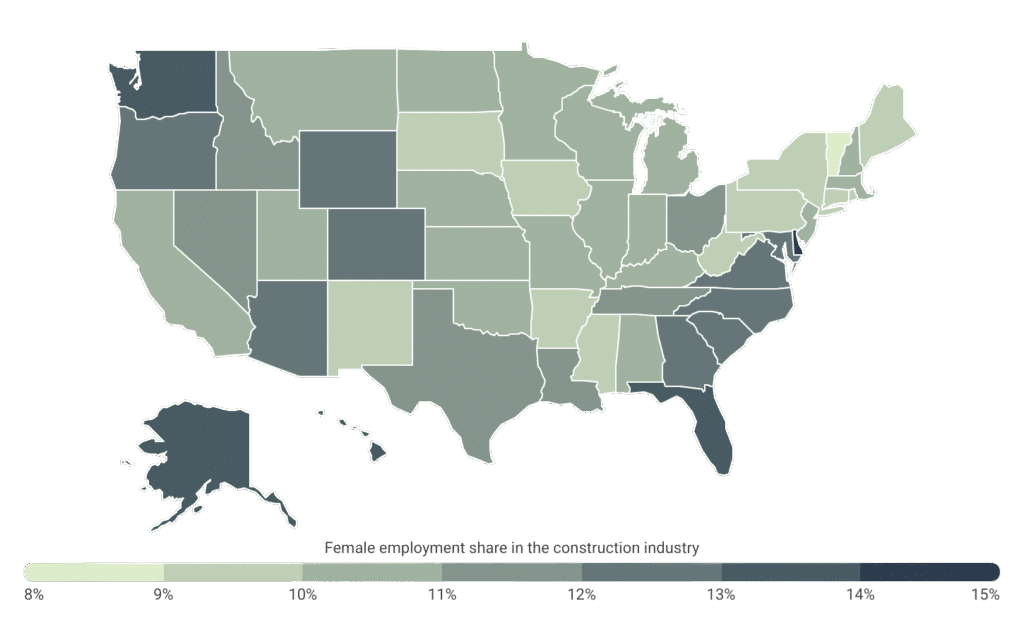
Delaware has the highest share of women working in the construction sector
Data: Female Construction Employment by State
| State | Female employment share in the construction industry |
|---|---|
| Delaware | 14.2% |
| Florida | 13.5% |
| Alaska | 13.3% |
| Hawaii | 13.2% |
| Washington | 13.0% |
| Wyoming | 12.9% |
| Oregon | 12.7% |
| Maryland | 12.6% |
| South Carolina | 12.5% |
| Georgia | 12.4% |
| North Carolina | 12.2% |
| Arizona | 12.2% |
| Colorado | 12.2% |
| Virginia | 12.1% |
| Louisiana | 11.4% |
| Nevada | 11.4% |
| Idaho | 11.4% |
| Texas | 11.3% |
| Ohio | 11.1% |
| Tennessee | 11.0% |
| Illinois | 10.9% |
| Indiana | 10.9% |
| Utah | 10.9% |
| Alabama | 10.8% |
| Montana | 10.8% |
| North Dakota | 10.8% |
| New Jersey | 10.7% |
| Oklahoma | 10.7% |
| Nebraska | 10.7% |
| California | 10.6% |
| Kansas | 10.6% |
| Michigan | 10.5% |
| Massachusetts | 10.5% |
| Minnesota | 10.5% |
| Missouri | 10.3% |
| Kentucky | 10.3% |
| New Hampshire | 10.1% |
| Wisconsin | 10.0% |
| Pennsylvania | 9.8% |
| Mississippi | 9.7% |
| Maine | 9.7% |
| Rhode Island | 9.7% |
| New York | 9.6% |
| Arkansas | 9.5% |
| New Mexico | 9.4% |
| West Virginia | 9.3% |
| Connecticut | 9.2% |
| South Dakota | 9.2% |
| Iowa | 9.0% |
| Vermont | 8.4% |
While the construction industry remains male-dominated nationally, the underrepresentation of women in construction is less pronounced in certain parts of the country. This variation highlights regional differences in workforce dynamics, compensation levels, and diversification efforts within the industry.
Delaware and Florida lead the nation in female construction employment, with women making up 14.2% and 13.5% of the industry’s workforce, respectively. These states likely benefit from the relatively high wages offered in the construction sector, which can be an attractive factor for women entering the field. Remotely located states like Alaska (13.3%) and Hawaii (13.2%), and parts of the Pacific Northwest, such as Washington (13.0%) and Oregon (12.7%), also report female representation above the national average of 11.7%.
Similar trends can be observed at the metropolitan level. Metros like Jacksonville, FL (17.4%), and Orlando, FL (15.7%) rank as the top major metros for female construction employment. In fact, five of the top seven major metros for female construction employment are located in Florida. At the opposite end of the spectrum, Texas and the Northeast are home to the only major metros that report concentrations of women in construction below 9.0%. In McAllen, TX, just 7.5% of construction industry workers are female—the lowest of any major U.S. metropolitan area.
Below is a breakdown of female construction employment across the top and bottom states and metropolitan areas. The analysis was conducted by Construction Coverage using data from the U.S. Census Bureau. For more information, refer to the methodology section.
States With the Most Women in Construction
| Top States | Female Share* |
|---|---|
| 1. Delaware | 14.2% |
| 2. Florida | 13.5% |
| 3. Alaska | 13.3% |
| 4. Hawaii | 13.2% |
| 5. Washington | 13.0% |
| 6. Wyoming | 12.9% |
| 7. Oregon | 12.7% |
| 8. Maryland | 12.6% |
| 9. South Carolina | 12.5% |
| 10. Georgia | 12.4% |
| 11. North Carolina | 12.2% |
| 12. Arizona | 12.2% |
| 13. Colorado | 12.2% |
| 14. Virginia | 12.1% |
| 15. Louisiana | 11.4% |
| Bottom States | Female Share* |
|---|---|
| 1. Vermont | 8.4% |
| 2. Iowa | 9.0% |
| 3. South Dakota | 9.2% |
| 4. Connecticut | 9.2% |
| 5. West Virginia | 9.3% |
| 6. New Mexico | 9.4% |
| 7. Arkansas | 9.5% |
| 8. New York | 9.6% |
| 9. Rhode Island | 9.7% |
| 10. Maine | 9.7% |
| 11. Mississippi | 9.7% |
| 12. Pennsylvania | 9.8% |
| 13. Wisconsin | 10.0% |
| 14. New Hampshire | 10.1% |
| 15. Kentucky | 10.3% |
Cities With the Most Women in Construction
| Top Metros | Female Share* |
|---|---|
| 1. Jacksonville, FL | 17.4% |
| 2. Orlando-Kissimmee-Sanford, FL | 15.7% |
| 3. Austin-Round Rock-San Marcos, TX | 14.9% |
| 4. Cape Coral-Fort Myers, FL | 14.6% |
| 5. Greenville-Anderson-Greer, SC | 14.6% |
| 6. North Port-Bradenton-Sarasota, FL | 14.5% |
| 7. Palm Bay-Melbourne-Titusville, FL | 14.5% |
| 8. Seattle-Tacoma-Bellevue, WA | 14.2% |
| 9. Charlotte-Concord-Gastonia, NC-SC | 14.2% |
| 10. New Orleans-Metairie, LA | 14.2% |
| 11. Tampa-St. Petersburg-Clearwater, FL | 14.0% |
| 12. Virginia Beach-Chesapeake-Norfolk, VA-NC | 14.0% |
| 13. Baltimore-Columbia-Towson, MD | 13.9% |
| 14. Deltona-Daytona Beach-Ormond Beach, FL | 13.8% |
| 15. Colorado Springs, CO | 13.6% |
| Bottom Metros | Female Share* |
|---|---|
| 1. McAllen-Edinburg-Mission, TX | 7.5% |
| 2. Kiryas Joel-Poughkeepsie-Newburgh, NY | 8.7% |
| 3. El Paso, TX | 8.7% |
| 4. Worcester, MA | 8.7% |
| 5. Bridgeport-Stamford-Danbury, CT | 8.8% |
| 6. Providence-Warwick, RI-MA | 9.2% |
| 7. Fayetteville-Springdale-Rogers, AR | 9.3% |
| 8. Birmingham, AL | 9.3% |
| 9. New Haven, CT | 9.4% |
| 10. Riverside-San Bernardino-Ontario, CA | 9.4% |
| 11. Jackson, MS | 9.6% |
| 12. Hartford-West Hartford-East Hartford, CT | 9.6% |
| 13. Los Angeles-Long Beach-Anaheim, CA | 9.6% |
| 14. Durham-Chapel Hill, NC | 9.8% |
| 15. Greensboro-High Point, NC | 9.9% |
*Female employment share in the construction industry
Full Results
Methodology
The data used in this analysis is from the U.S. Census Bureau’s 2024 American Community Survey. Due to sample size constraints, one-year estimates were used for national statistics, while five-year estimates were used for state and MSA statistics. To determine the locations with the most women in construction, researchers at Construction Coverage ranked locations by the percentage of employees in the construction industry that are female. In the event of a tie, locations with the higher total female employment in the construction industry were ranked higher. Additionally, due to statistical significance limitations of the dataset, only the top 100 metropolitan areas by population with complete data were included in the analysis.
References
- U.S. Department of Labor (2025). WANTO Grant Program. https://www.dol.gov/agencies/wb/grants/wanto.
- Associated Builders and Contractors (January 15, 2026). ABC: Construction Industry Must Attract 349,000 Workers in 2026 Despite Macroeconomic Headwinds. https://www.abc.org/News-Media/News-Releases/abc-construction-industry-must-attract-349000-workers-in-2026-despite-macroeconomic-headwinds.
- U.S. Census Bureau (2024). American Community Survey. https://www.census.gov/programs-surveys/acs.