
U.S. Cities With the Oldest Renters
One of the surprising trends in the U.S. rental market in recent years has been the emergence of Baby Boomers as a major source of demand. For many, the view of a typical renter is a young person, living on leases while they leave home for the first time, seek out jobs and potential partners, and accumulate the savings needed to buy a house and settle down. In contrast, the Boomers—a more established generation, and one whose members have benefited from tremendous economic prosperity over the course of their lifetime—are far more likely to own a home.
And yet, over the last two decades, the data shows that many older Americans are forgoing homeownership in favor of shorter-term living arrangements in the rental market.
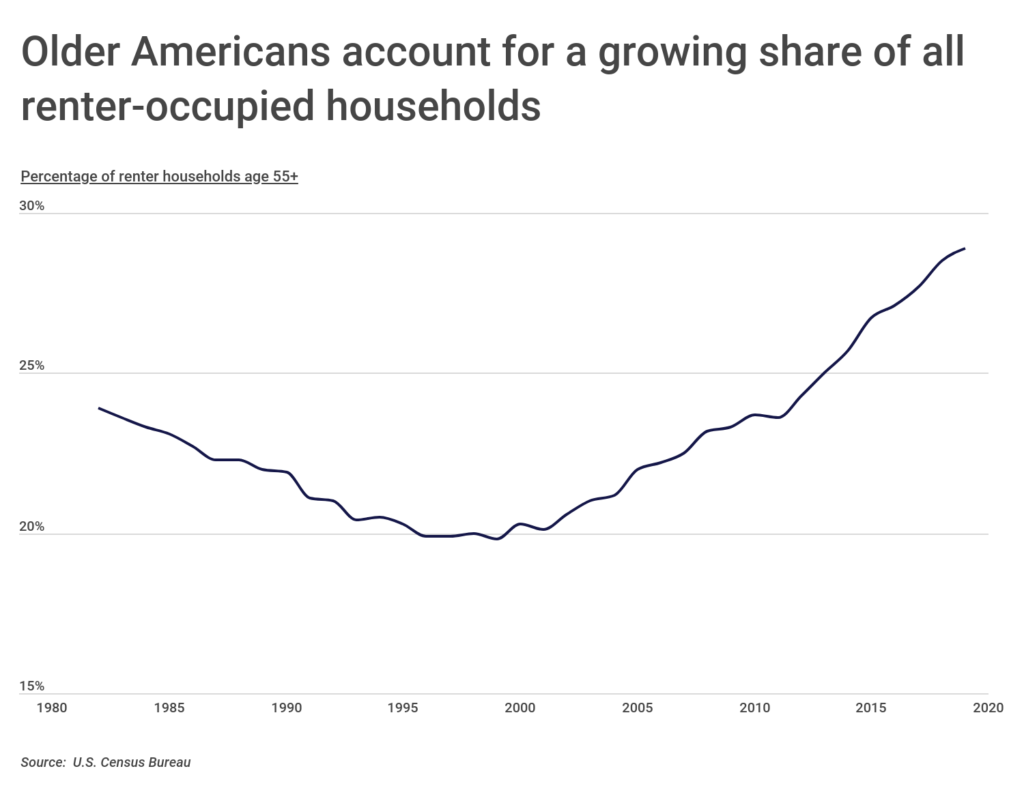
The percentage of renters above the age of 55 hit its low point in the late 1990s, and since then has grown significantly over time. One of the reasons for this is simply the size of the Baby Boomer generation, which prior to 2019 was America’s largest for decades. The first Baby Boomer turned 55 in 2001, and with more than 70 million Boomers following behind, an older population would inevitably come to be a larger force in the rental market.
But late middle age also brings other dynamics that could explain the increased trend toward rentals. By around the age of 55, it is likely that one’s children are grown or nearly grown and out of the house. At that time, empty nesters may already be thinking about their life in retirement. Many of these Boomers want fewer responsibilities and more flexibility to move around in their later years. Older adults are also divorcing at higher rates than past generations, and the dissolution of marriages may push more divorcees into renting.
COVID-19 could potentially further shake up demographics in the rental market. With more people moving for reasons related to the pandemic and showing a preference for spacious homes, demand in the real estate market is high. For Boomers who have been thinking about selling, now could be the right time to leave their homes behind, which would only grow the share of older Americans who rent.
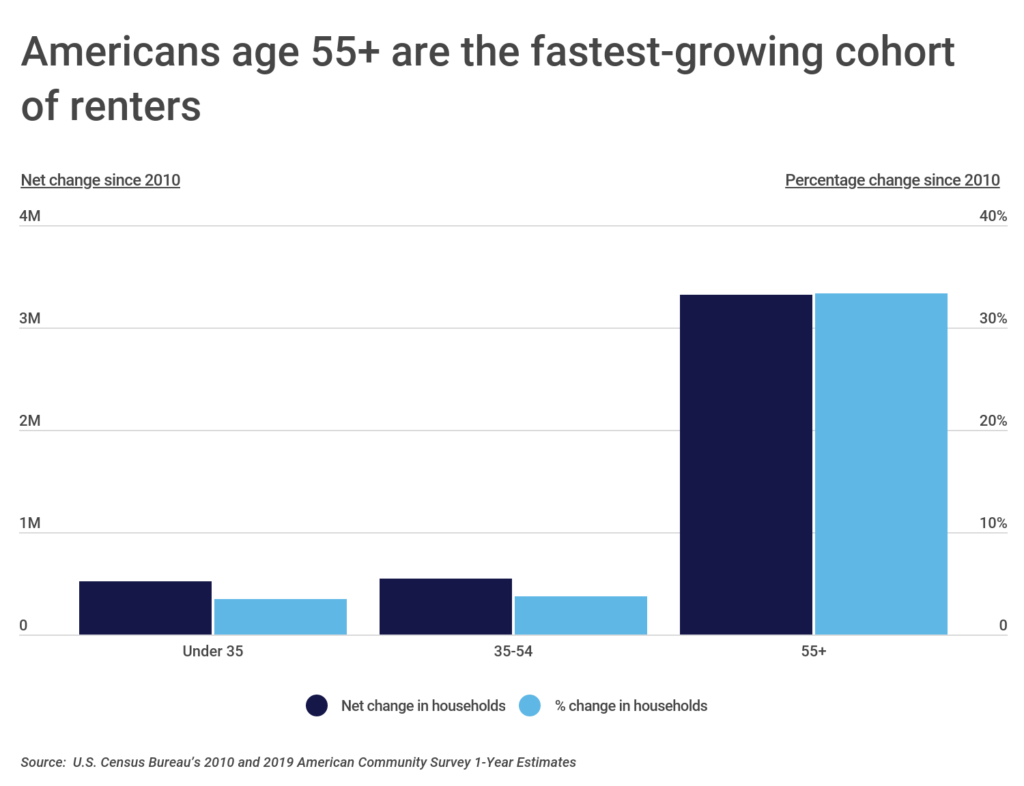
And this is not a minor trend. The percentage increase in renters aged 55 and over since 2010 is more than 10 times greater than the changes for other groups, and in raw numbers, the number of new 55-and-up renters is more than three times the number of new renters of any other age.
For cities and developers, the growing number of senior renters could have significant implications. Older renters tend to have slightly different preferences than young renters in terms of features and amenities, and they also tend to stay in rentals longer than their younger, more transient counterparts. This means that there is incentive to accommodate Boomers’ likings when constructing new units, but it remains to be seen how planners and developers will adjust to account for an older market.
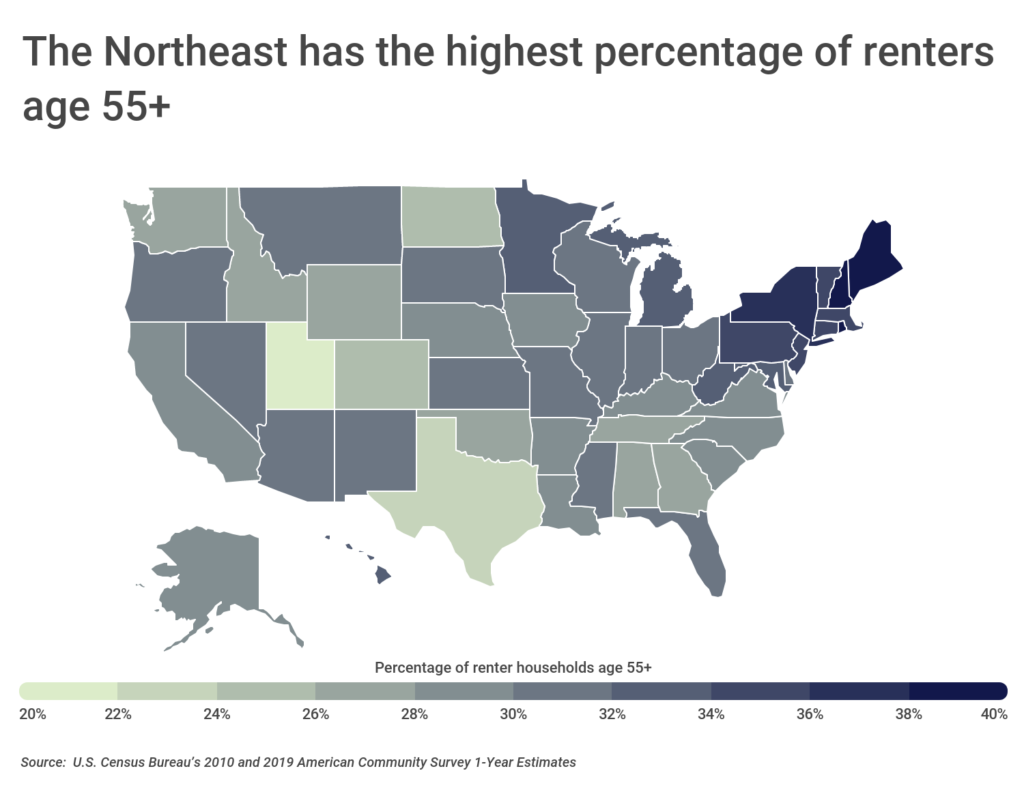
Currently, the Boomer-heavy rental market is most apparent in states in the Northeast, especially the New England states of Maine, New Hampshire, and Rhode Island. This may be a natural byproduct of the fact that these states also tend to have an older population on average than other parts of the country. But one trend to watch in coming years is whether migration patterns affect the number of seniors in the rental market as states like Florida, Arizona, and Nevada absorb higher concentrations of migrating retirees.
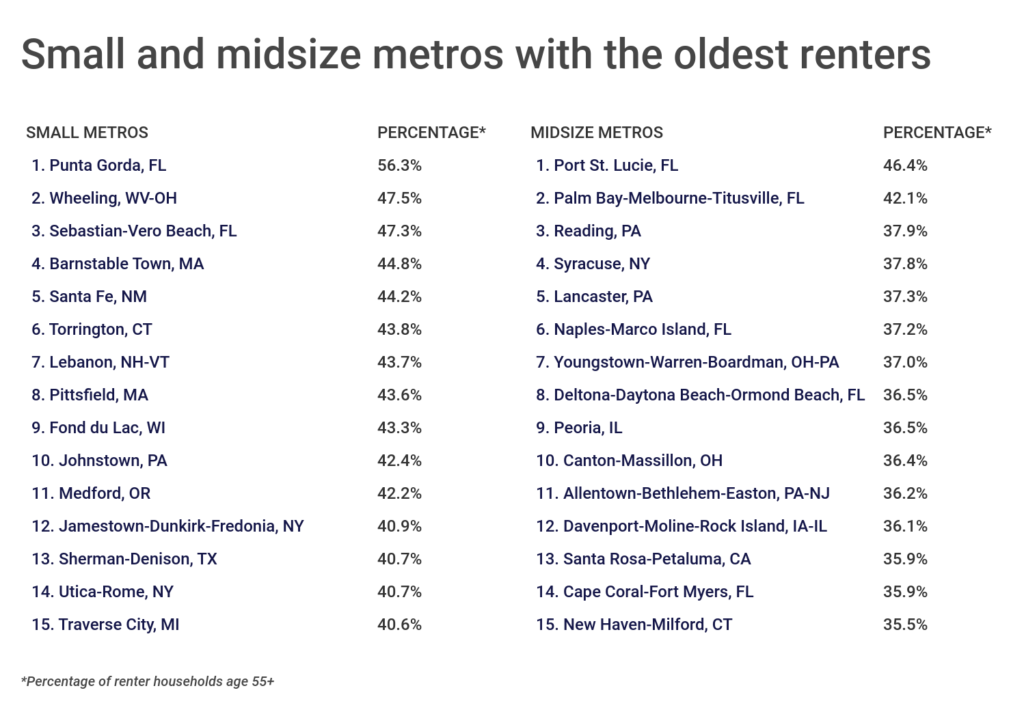
There are already some signs that this may be the case at the city level: the list of locations with the oldest renters is mostly a mix of northern metropolitan areas with older populations and those in the Sun Belt where retirees are moving in high numbers. To find these locations, researchers at Construction Coverage analyzed U.S. Census data to find the proportion of all renter-occupied households that have a householder aged 55 and over. The researchers also included the total number of renter households aged 55 and up, along with the percentage change in the number of renters for the oldest (55 or older) and youngest (under 35) population segments since 2010 for comparison.
Here are the metros with the oldest renters.
Large Metros With the Oldest Renters

Photo Credit: Alamy Stock Photo
15. Portland-Vancouver-Hillsboro, OR-WA
- Percentage of renter households age 55+: 27.8%
- Total number of 55+ renter households: 102,545
- Percentage change in 55+ renter households since 2010: 28.5%
- Percentage change in <35 renter households since 2010: 6.5%
- Population: 2,445,761

Photo Credit: Alamy Stock Photo
14. Riverside-San Bernardino-Ontario, CA
- Percentage of renter households age 55+: 28.1%
- Total number of 55+ renter households: 139,852
- Percentage change in 55+ renter households since 2010: 43.8%
- Percentage change in <35 renter households since 2010: No significant change
- Population: 4,560,470

Photo Credit: Alamy Stock Photo
13. Jacksonville, FL
- Percentage of renter households age 55+: 28.3%
- Total number of 55+ renter households: 56,157
- Percentage change in 55+ renter households since 2010: 48.1%
- Percentage change in <35 renter households since 2010: No significant change
- Population: 1,503,574
FOR PROPERTY MANAGERS
Just like builders risk insurance protects the property when under construction, workers’ compensation insurance protects the workers. Make sure you have both before starting your next remodel.

Photo Credit: Alamy Stock Photo
12. Birmingham-Hoover, AL
- Percentage of renter households age 55+: 28.5%
- Total number of 55+ renter households: 39,447
- Percentage change in 55+ renter households since 2010: 36.0%
- Percentage change in <35 renter households since 2010: No significant change
- Population: 1,085,330

Photo Credit: Alamy Stock Photo
11. Kansas City, MO-KS
- Percentage of renter households age 55+: 28.6%
- Total number of 55+ renter households: 84,340
- Percentage change in 55+ renter households since 2010: 28.9%
- Percentage change in <35 renter households since 2010: 14.6%
- Population: 2,124,518

Photo Credit: Alamy Stock Photo
10. Louisville/Jefferson County, KY-IN
- Percentage of renter households age 55+: 29.7%
- Total number of 55+ renter households: 48,271
- Percentage change in 55+ renter households since 2010: 26.4%
- Percentage change in <35 renter households since 2010: -7.1%
- Population: 1,257,088

Photo Credit: Alamy Stock Photo
9. Richmond, VA
- Percentage of renter households age 55+: 30.2%
- Total number of 55+ renter households: 50,050
- Percentage change in 55+ renter households since 2010: 45.5%
- Percentage change in <35 renter households since 2010: No significant change
- Population: 1,269,530

Photo Credit: Alamy Stock Photo
8. Tampa-St. Petersburg-Clearwater, FL
- Percentage of renter households age 55+: 30.8%
- Total number of 55+ renter households: 125,998
- Percentage change in 55+ renter households since 2010: 28.0%
- Percentage change in <35 renter households since 2010: No significant change
- Population: 3,097,859

Photo Credit: Alamy Stock Photo
7. Minneapolis-St. Paul-Bloomington, MN-WI
- Percentage of renter households age 55+: 31.3%
- Total number of 55+ renter households: 130,330
- Percentage change in 55+ renter households since 2010: 46.1%
- Percentage change in <35 renter households since 2010: No significant change
- Population: 3,573,609

Photo Credit: Alamy Stock Photo
6. Tucson, AZ
- Percentage of renter households age 55+: 31.6%
- Total number of 55+ renter households: 47,941
- Percentage change in 55+ renter households since 2010: 32.5%
- Percentage change in <35 renter households since 2010: No significant change
- Population: 1,027,207

Photo Credit: Alamy Stock Photo
5. Miami-Fort Lauderdale-Pompano Beach, FL
- Percentage of renter households age 55+: 31.9%
- Total number of 55+ renter households: 284,596
- Percentage change in 55+ renter households since 2010: 47.6%
- Percentage change in <35 renter households since 2010: 7.6%
- Population: 6,090,660

Photo Credit: Alamy Stock Photo
4. St. Louis, MO-IL
- Percentage of renter households age 55+: 32.1%
- Total number of 55+ renter households: 113,312
- Percentage change in 55+ renter households since 2010: 33.8%
- Percentage change in <35 renter households since 2010: No significant change
- Population: 2,805,190

Photo Credit: Alamy Stock Photo
3. Philadelphia-Camden-Wilmington, PA-NJ-DE-MD
- Percentage of renter households age 55+: 33.2%
- Total number of 55+ renter households: 257,056
- Percentage change in 55+ renter households since 2010: 30.4%
- Percentage change in <35 renter households since 2010: 4.2%
- Population: 6,079,130

Photo Credit: Alamy Stock Photo
2. Pittsburgh, PA
- Percentage of renter households age 55+: 35.6%
- Total number of 55+ renter households: 116,303
- Percentage change in 55+ renter households since 2010: 16.6%
- Percentage change in <35 renter households since 2010: 32.5%
- Population: 2,331,447

Photo Credit: Alamy Stock Photo
1. Rochester, NY
- Percentage of renter households age 55+: 36.0%
- Total number of 55+ renter households: 53,097
- Percentage change in 55+ renter households since 2010: 38.1%
- Percentage change in <35 renter households since 2010: 11.3%
- Population: 1,072,877
Detailed Findings & Methodology
The data used in this analysis is from the U.S. Census Bureau’s 2010 and 2019 American Community Survey 1-Year Estimates. Researchers ranked the locations based on the proportion of all renter-occupied households that have a householder aged 55 and over. To improve relevance, only metropolitan areas with at least 100,000 residents were included. Additionally, metros were grouped into cohorts based on population size: small (100,000-349,999), midsize (350,000-999,999), and large (1,000,000 or more).