U.S. Counties Where the Most Expensive Homes Are Being Built [2022 Edition]
Rising real estate prices and interest rate hikes have finally started to bring balance back to the residential market this year. But while demand is falling off, the U.S. still has a major need for new homes, which could create plenty of opportunity for residential builders.
One of the major factors that contributed to the heightened competition for housing over the last two years was housing supply. The U.S. suffered from a severe shortage of housing stock before COVID-19, and the pandemic sent available inventory to record lows. With a rush of buyers in the market, the limited availability of homes stoked competition and pushed prices higher.
Builders have rushed to meet the need for new units. Housing permits and starts bounced back strongly after falling sharply early in the COVID-19 pandemic. And despite a recent downtick, housing starts have been higher this year than at any other point since before the Great Recession.
While the construction industry has seen high levels of activity, recent conditions have nonetheless been challenging. Inflation has increased the cost of building materials by 33% since the beginning of the pandemic, and supply chain challenges over the last two years have contributed to increased costs and project delays. Construction firms have also struggled to hire and retain labor, and many have raised wages in efforts to do so.
DID YOU KNOW?
Homeowners insurance typically does not protect the property while a building is under construction. During periods of construction, a builders risk policy is needed to provide the necessary insurance coverage.
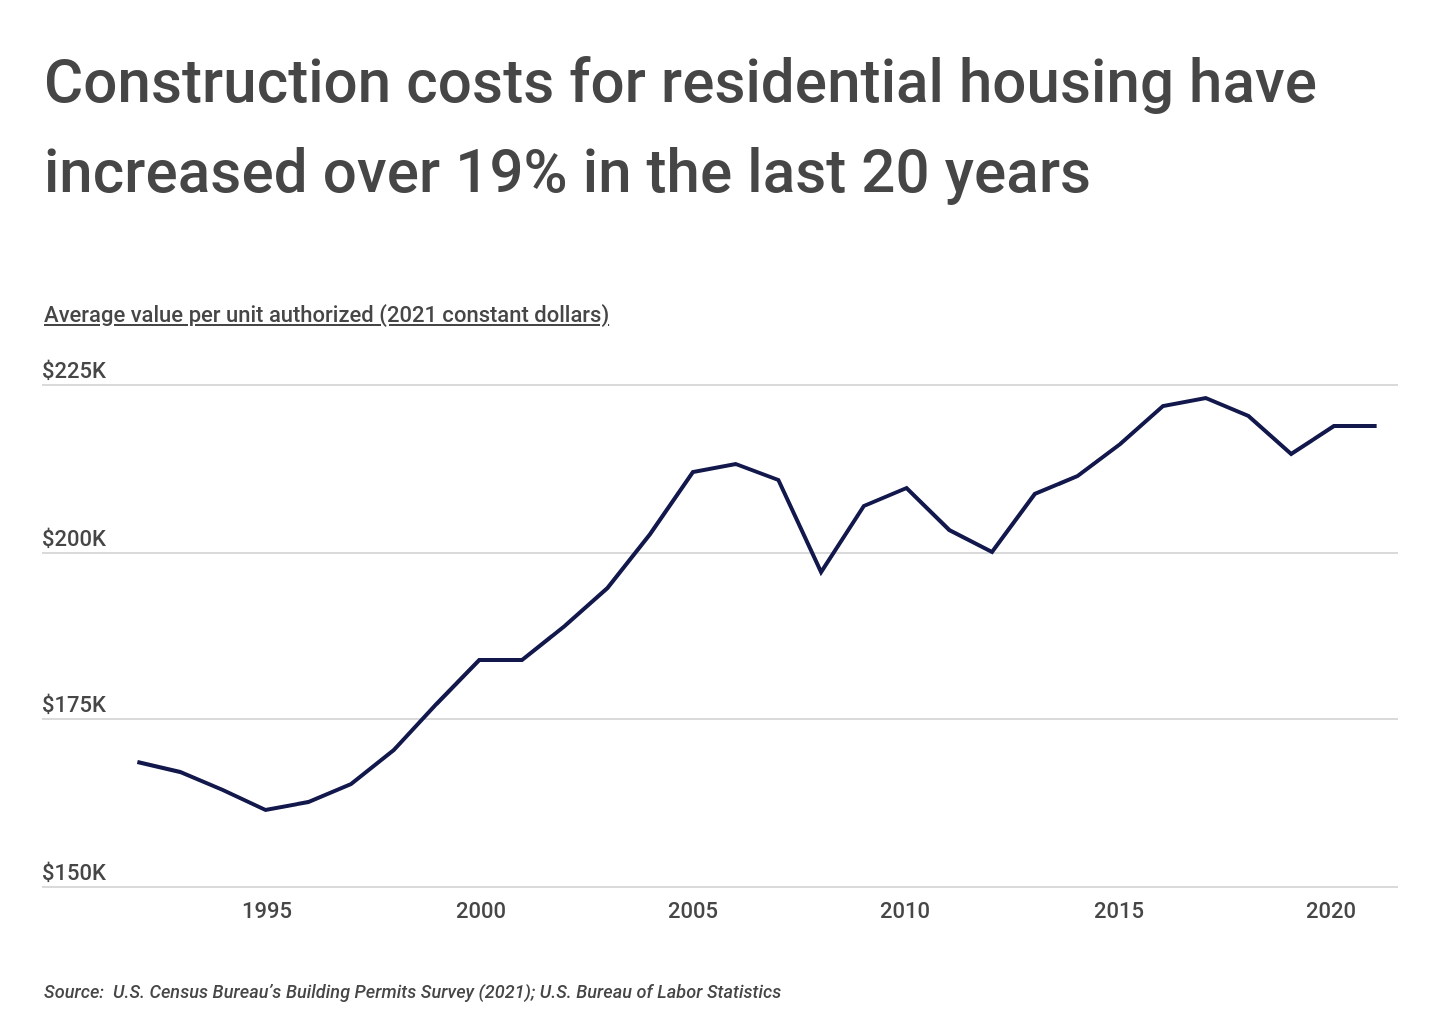
Further, the relative cost of building a new unit has increased over time. Three decades ago, the average construction cost per residential unit in 2021 dollars was $168,452. That figure today is $218,791. And notably, the construction cost per unit has outpaced the rate of inflation over that time, rising by around 7.6% just in the last decade.
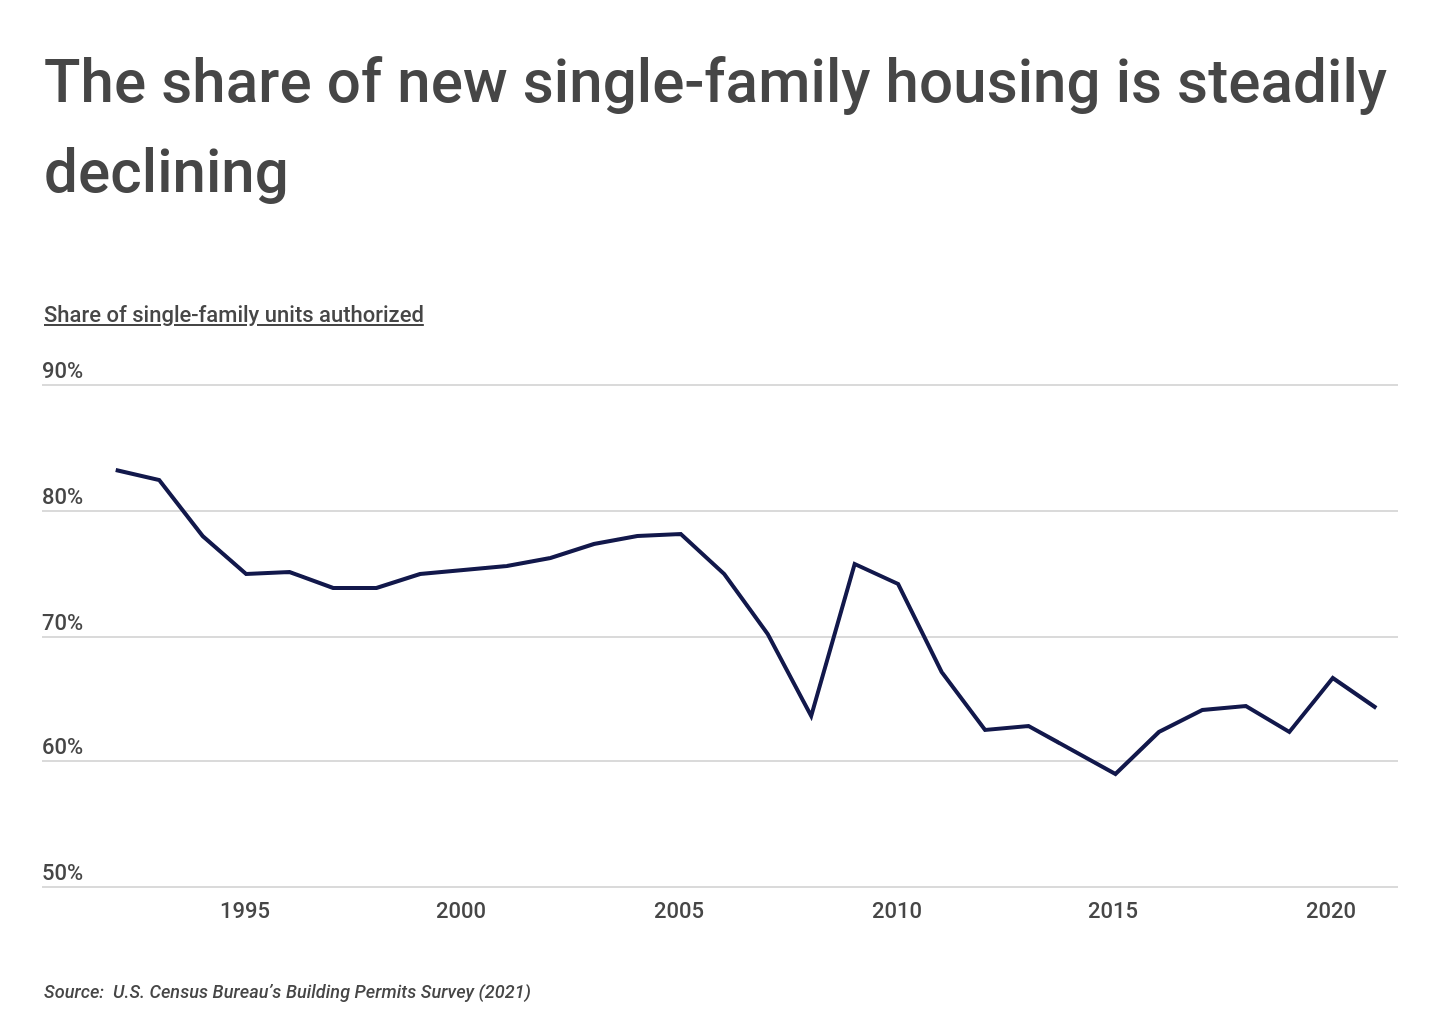
The rising costs of construction have taken place even as single-family home construction has fallen. Over the last decade, the proportion of single-family homes has decreased by more than 13%. Because single-family construction tends to be more costly than larger developments on a per-unit basis, this trend reinforces that construction costs overall are on the rise.
Beyond unit type, a number of other factors can contribute to how much residential units cost to build. Supplies, labor, and other costs may vary by the region where construction is taking place. And market conditions or a jurisdiction’s policies can also impact whether new units are high-end or affordable, or how easy it is to add single-family or multi-family units.
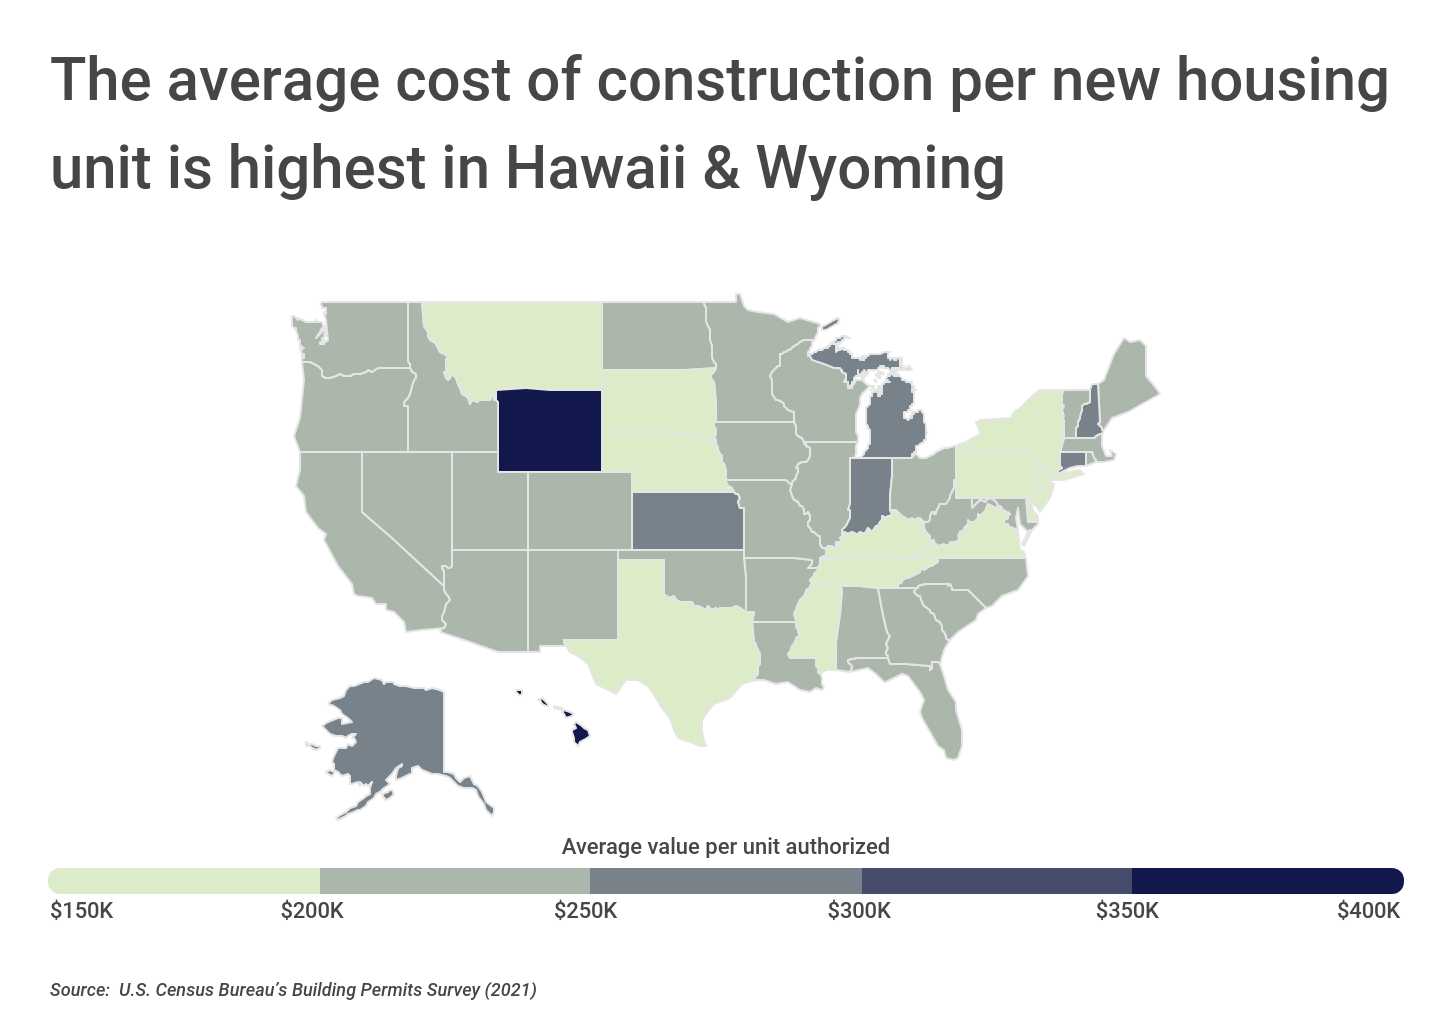
For that reason, the average cost of construction per unit can vary substantially across the country. Hawaii is the most expensive state to build new units with an average value per unit authorized of $403,596, a product of local regulations and the islands’ geography and distance from the mainland. But second in cost is Wyoming ($391,030 per unit), which has different challenges, including a lack of homebuilders. At the local level, many of the locations with the highest costs for new homes are among the most expensive real estate markets in the U.S., including the Bay Area and wealthy suburbs of New York.
The data used in this analysis is from the U.S. Census Bureau’s Building Permits Survey (2021), the most recent data available. To determine the locations where the most expensive homes are being built, researchers at Construction Coverage calculated the average permit value per unit authorized. Authorized units included both single-unit and multiple-unit structures. It’s important to note that the value of the building permit does not reflect the ultimate market value of the unit, but rather the total value of all construction work for which the permit is issued.
To improve relevance, only counties with at least 200,000 residents were included. Additionally, counties were grouped into cohorts based on population size: small (200,000-349,999), midsize (350,000-749,999), and large (750,000 or more). Note: only counties with complete data for 2021 were considered in this analysis.
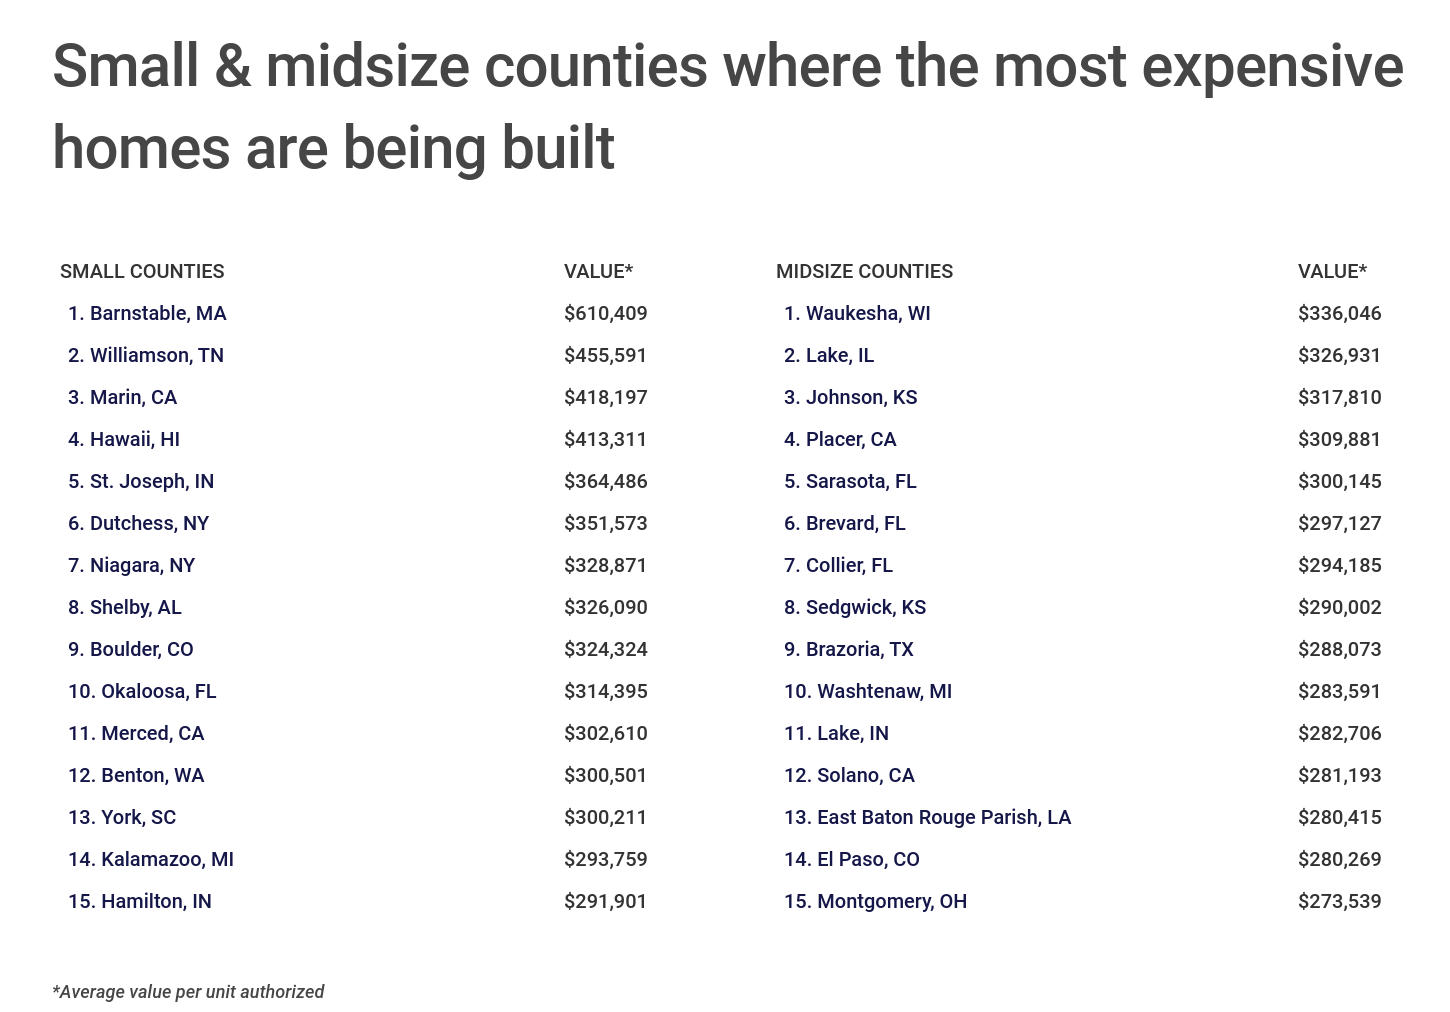
Here are the counties where the most expensive homes are being built.
FOR CONSTRUCTION PROFESSIONALS
Construction takeoff and estimating software can dramatically improve the bid process, helping contractors secure more jobs.
Large Counties Where the Most Expensive Homes Are Being Built
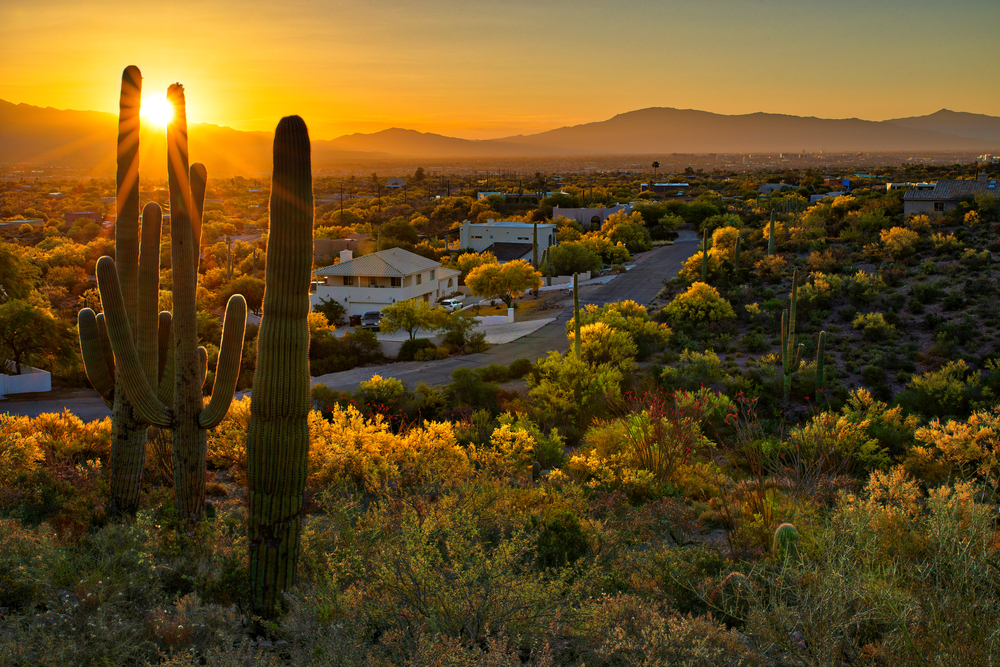
Photo Credit: LHBLLC / Shutterstock
15. Pima, AZ
- Average value per unit authorized: $279,120
- Total value of units authorized: $1,753,991,844
- Total units authorized: 6,284
- Single-family units as a proportion of total: 81.4%
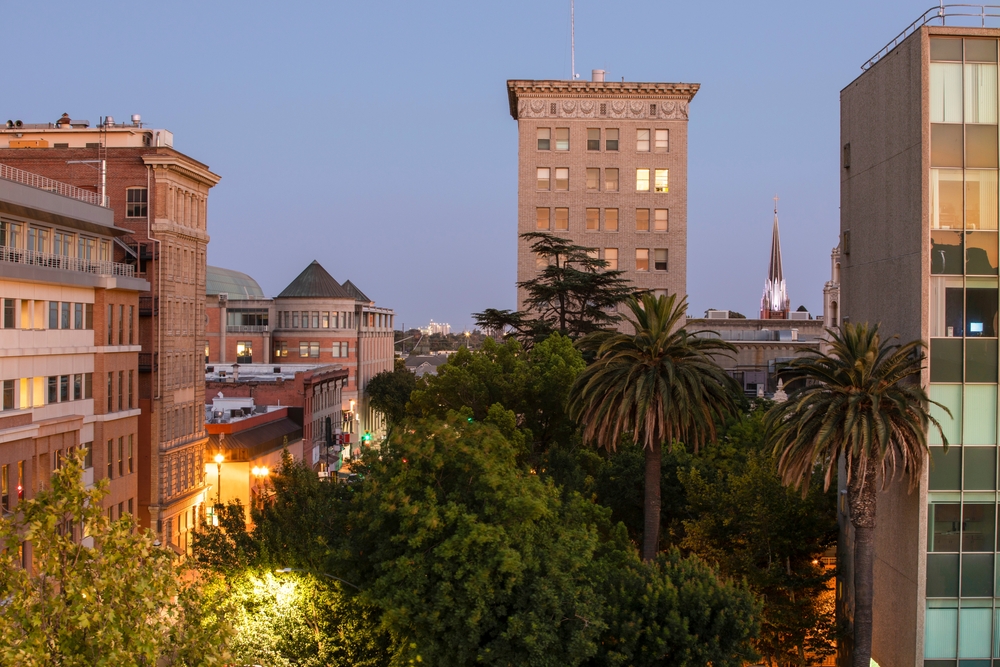
Photo Credit: Matt Gush / Shutterstock
14. San Joaquin, CA
- Average value per unit authorized: $291,070
- Total value of units authorized: $1,277,507,042
- Total units authorized: 4,389
- Single-family units as a proportion of total: 84.7%
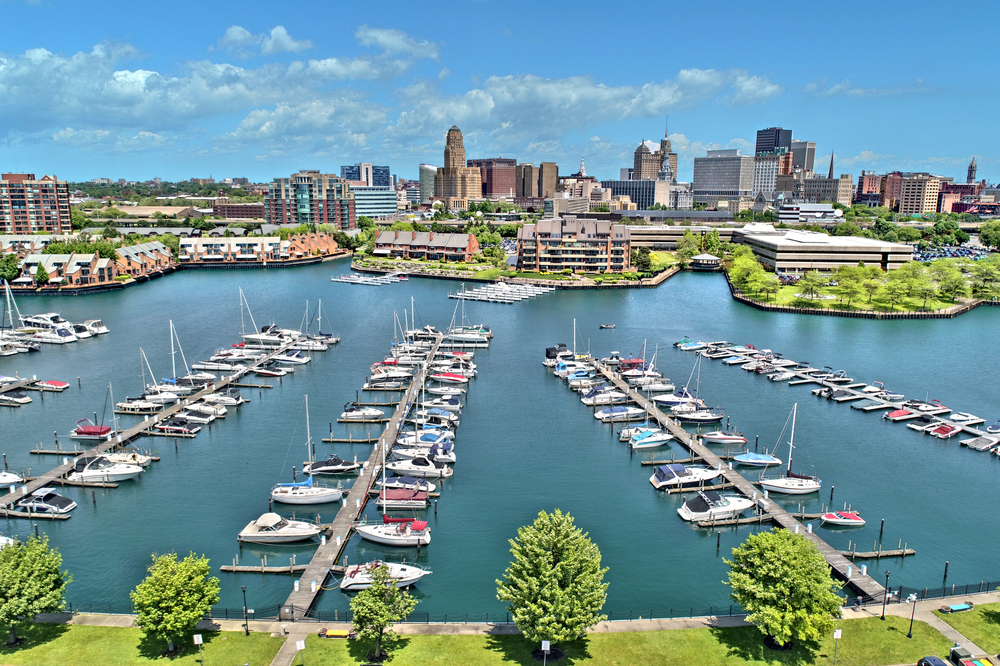
Photo Credit: Open.Tours LLC / Shutterstock
13. Erie, NY
- Average value per unit authorized: $306,682
- Total value of units authorized: $413,407,110
- Total units authorized: 1,348
- Single-family units as a proportion of total: 59.5%
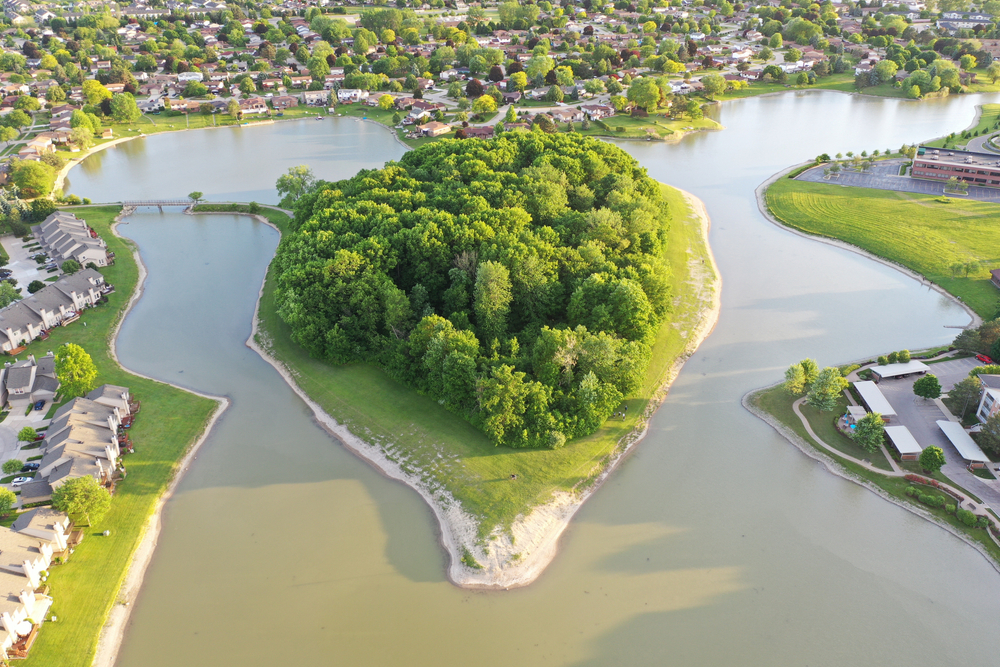
Photo Credit: Jerry Kozlowski / Shutterstock
12. Macomb, MI
- Average value per unit authorized: $307,076
- Total value of units authorized: $530,321,027
- Total units authorized: 1,727
- Single-family units as a proportion of total: 72.8%
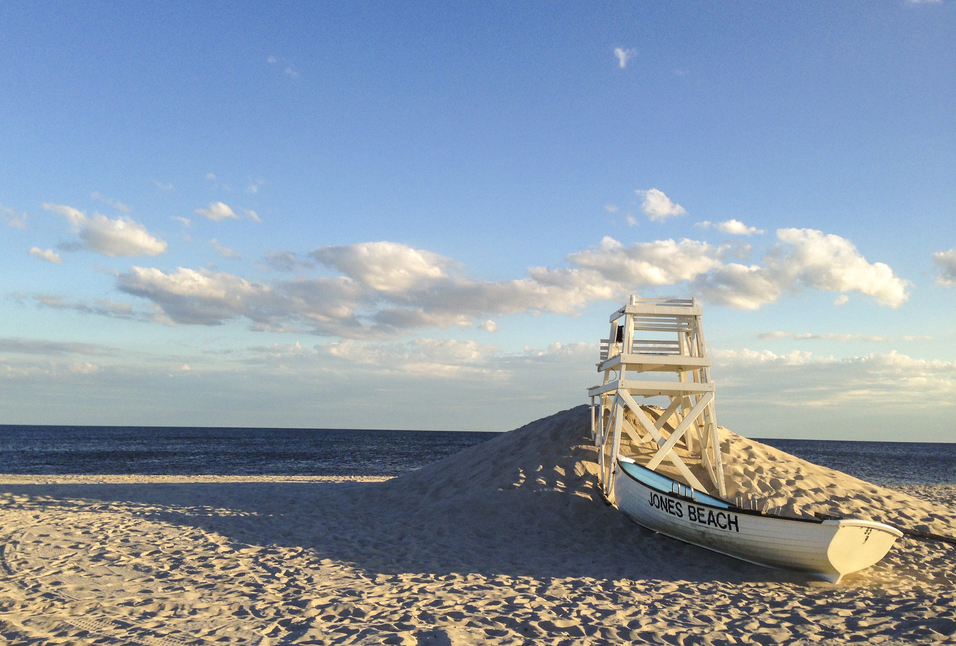
Photo Credit: Joe Trentacosti / Shutterstock
11. Nassau, NY
- Average value per unit authorized: $316,904
- Total value of units authorized: $432,573,679
- Total units authorized: 1,365
- Single-family units as a proportion of total: 55.2%
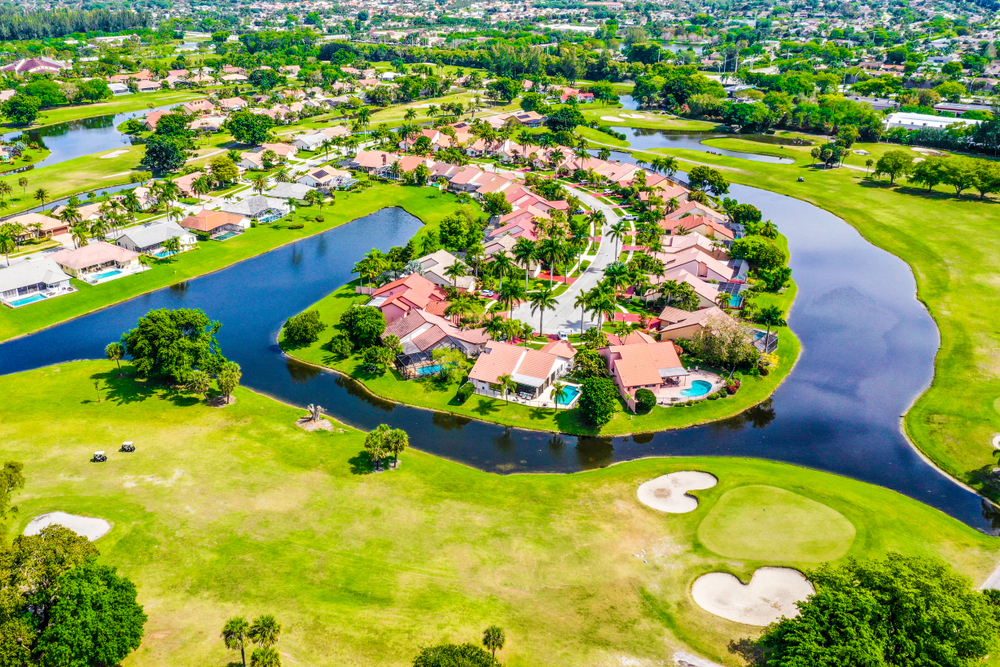
Photo Credit: Damijen Photography / Shutterstock
10. Palm Beach, FL
- Average value per unit authorized: $321,470
- Total value of units authorized: $2,523,859,005
- Total units authorized: 7,851
- Single-family units as a proportion of total: 53.6%
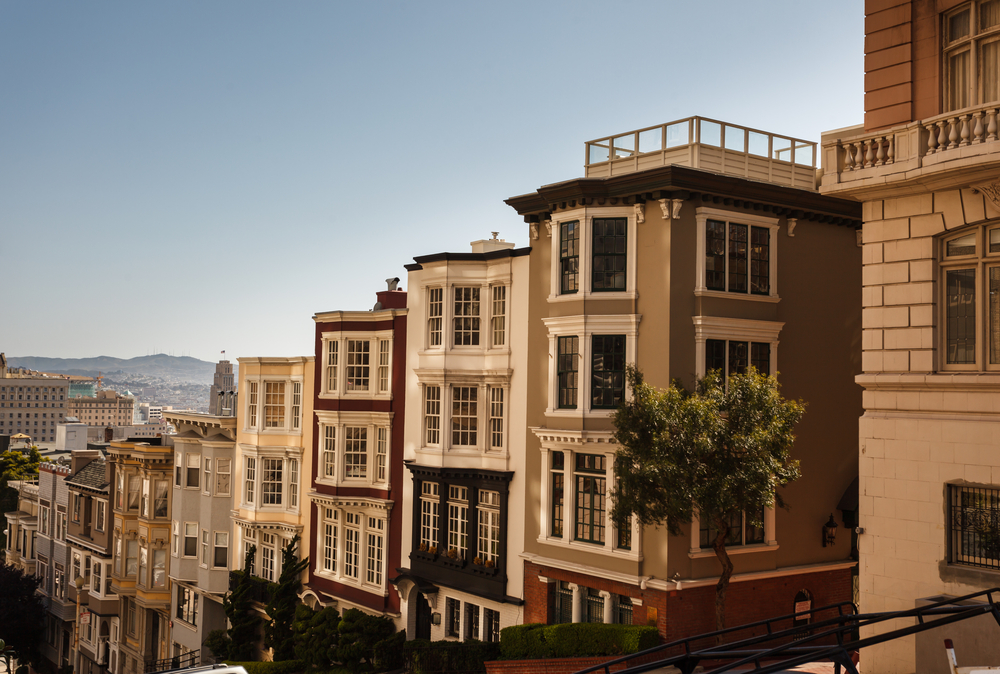
Photo Credit: Pete Niesen / Shutterstock
9. San Francisco, CA
- Average value per unit authorized: $325,290
- Total value of units authorized: $819,406,693
- Total units authorized: 2,519
- Single-family units as a proportion of total: 1.3%

Photo Credit: Izabela23 / Shutterstock
8. Honolulu, HI
- Average value per unit authorized: $325,696
- Total value of units authorized: $468,350,350
- Total units authorized: 1,438
- Single-family units as a proportion of total: 65.2%
Photo Credit: Dave_Manning / Shutterstock
7. Wayne, MI
- Average value per unit authorized: $340,811
- Total value of units authorized: $763,416,226
- Total units authorized: 2,240
- Single-family units as a proportion of total: 49.1%
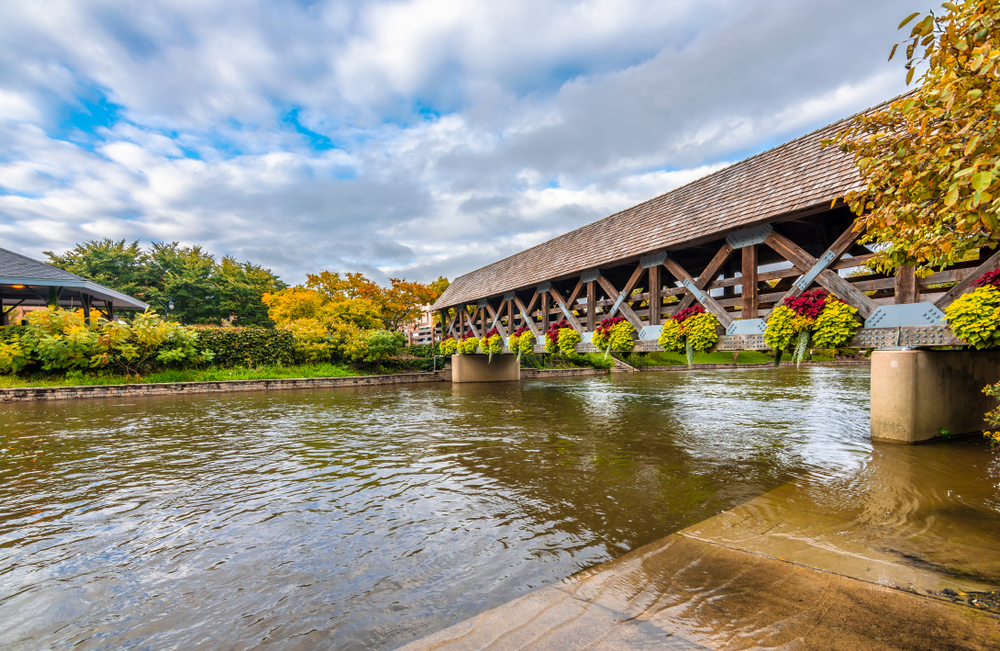
Photo Credit: Nejdet Duzen / Shutterstock
6. DuPage, IL
- Average value per unit authorized: $343,556
- Total value of units authorized: $533,886,282
- Total units authorized: 1,554
- Single-family units as a proportion of total: 62.1%
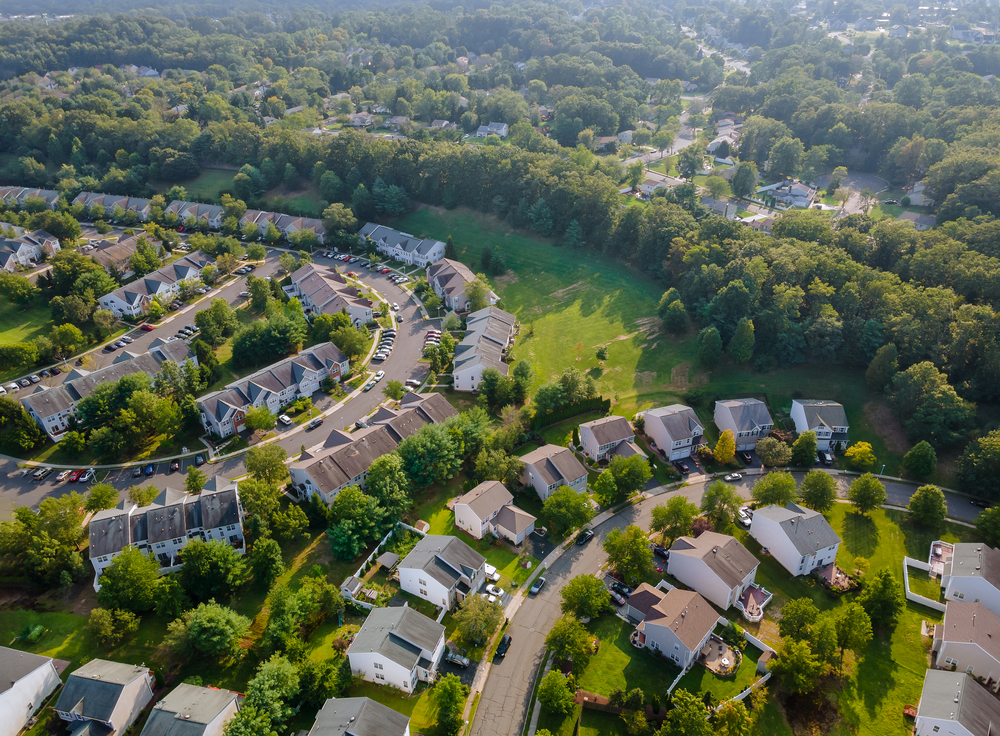
Photo Credit: ungvar / Shutterstock
5. Cuyahoga, OH
- Average value per unit authorized: $356,725
- Total value of units authorized: $279,672,077
- Total units authorized: 784
- Single-family units as a proportion of total: 95.9%
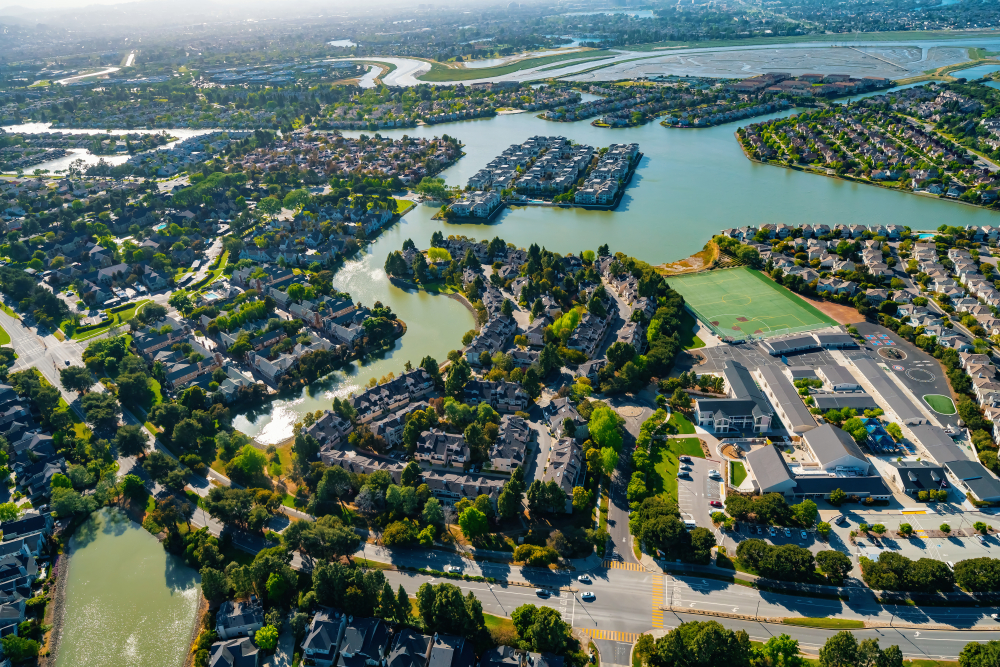
Photo Credit: Fast Speeds Imagery / Shutterstock
4. San Mateo, CA
- Average value per unit authorized: $406,705
- Total value of units authorized: $771,112,297
- Total units authorized: 1,896
- Single-family units as a proportion of total: 28.2%
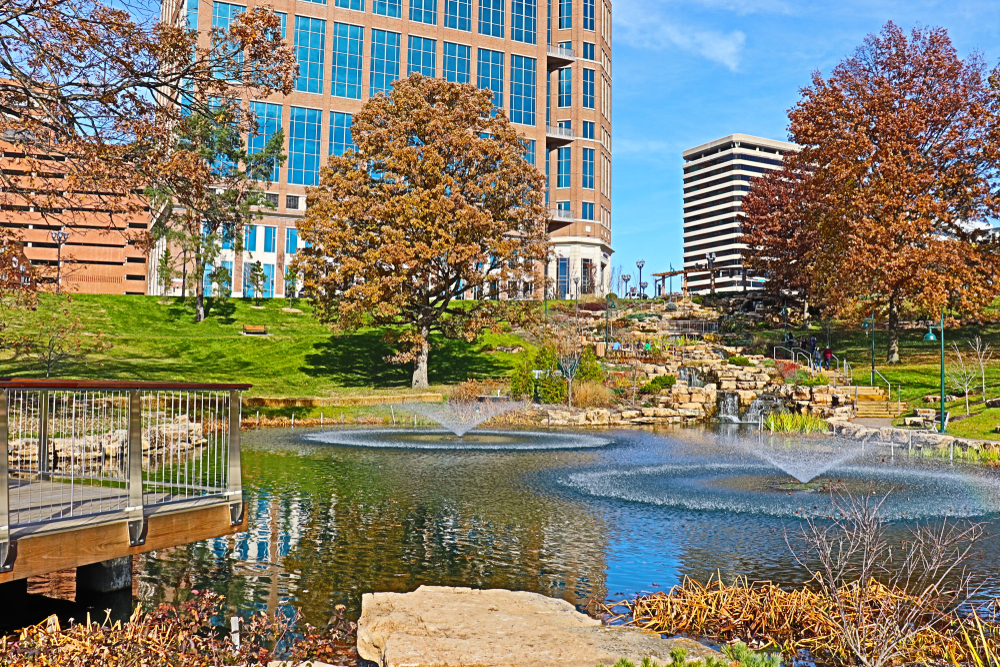
Photo Credit: Tales.org / Shutterstock
3. St. Louis, MO
- Average value per unit authorized: $416,004
- Total value of units authorized: $430,147,731
- Total units authorized: 1,034
- Single-family units as a proportion of total: 89.5%
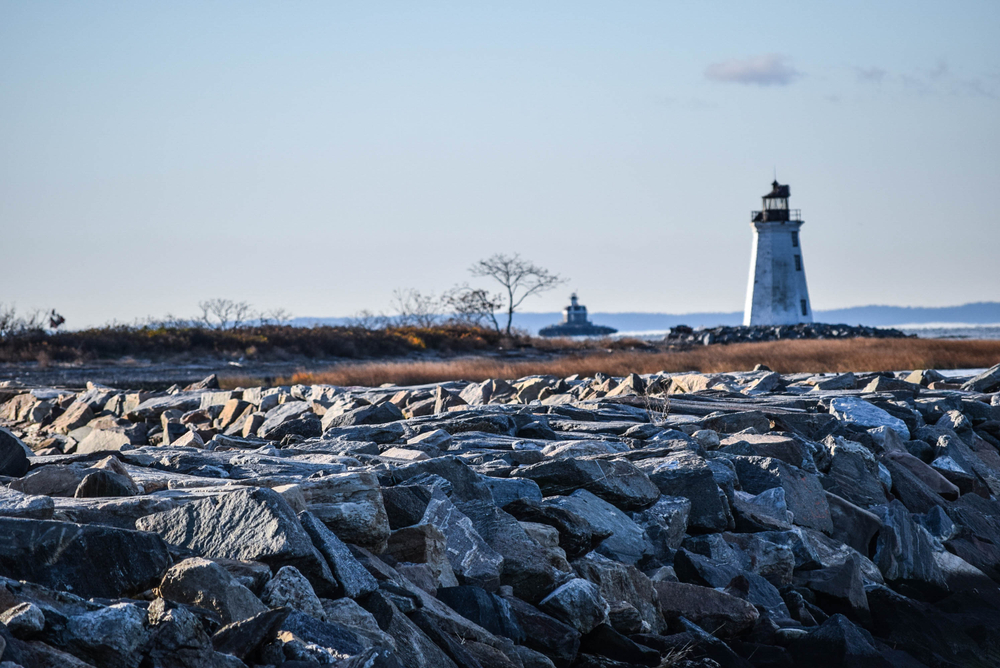
Photo Credit: Wendell Guy / Shutterstock
2. Fairfield, CT
- Average value per unit authorized: $416,959
- Total value of units authorized: $538,711,638
- Total units authorized: 1,292
- Single-family units as a proportion of total: 55.3%
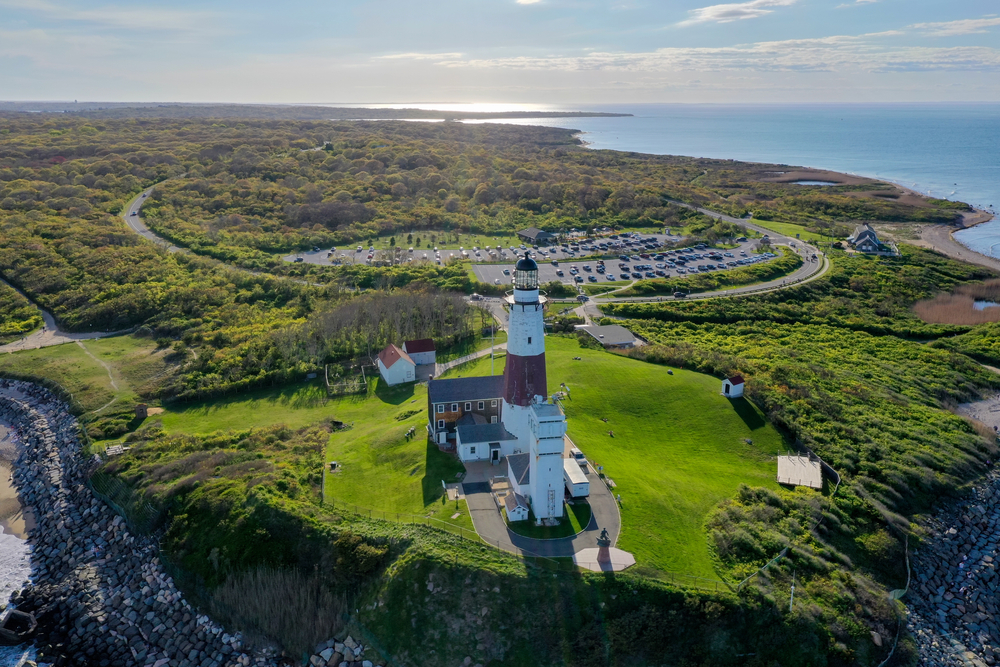
Photo Credit: Felix Lipov / Shutterstock
1. Suffolk, NY
- Average value per unit authorized: $682,633
- Total value of units authorized: $995,961,917
- Total units authorized: 1,459
- Single-family units as a proportion of total: 86.2%
Detailed Findings & Methodology
The data used in this analysis is from the U.S. Census Bureau’s Building Permits Survey (2021), the most recent data available. To determine the locations where the most expensive homes are being built, researchers at Construction Coverage calculated the average permit value per unit authorized. Authorized units included both single-unit and multiple-unit structures. It’s important to note that the value of the building permit does not reflect the ultimate market value of the unit, but rather the total value of all construction work for which the permit is issued.
To improve relevance, only counties with at least 200,000 residents were included. Additionally, counties were grouped into cohorts based on population size: small (200,000-349,999), midsize (350,000-749,999), and large (750,000 or more). Note: only counties with complete data for 2021 were considered in this analysis.
Each company featured in our guides has been independently selected and reviewed by our research team. If you select one of these companies and click on a link, we may earn a commission.
By clicking on these links, you may be taken to one of our insurance partners. The specific company listed here may or may not be included in our partner’s network at this time.
