
U.S. Counties That Have Built the Most Housing Over the Last Decade
Note: This is the most recent release of our U.S. Counties That Have Built the Most Housing Over the Past Decade study. To see data from prior years, please visit the Full Results section below.
The need for affordable housing in the United States has never been greater. After a dizzying run-up in residential real estate prices and rents in the last few years, housing costs are putting a financial squeeze on renters and homebuyers nationwide as they compete for a scarce, expensive supply of housing.
Research from federal mortgage backer Freddie Mac estimates that the U.S. is short 3.7 million housing units relative to current market needs, while the National Association of Realtors pegs the figure even higher at 5.5 million units. Regardless of the precise number, it is clear that the U.S. housing supply is insufficient, creating more competition for fewer units.
Experts cite a variety of factors that contribute to difficulties adding housing stock. In every state and locality, housing development may be subject to a host of laws and regulations regarding zoning, land use, building standards, environmental protection, historic preservation, and other issues that make it difficult to add housing. Developers and political officials may also face organized pressure from “not in my backyard” (NIMBY) interests concerned about neighborhood property values, overcrowding, or disruptions from construction work. Further, rising labor and material costs (alongside recent increases in tariffs) have made it more expensive to build over time, which impacts the type of units builders can afford to construct along with project timelines and costs.
Trends in U.S. Housing Construction Over Time
Since the 2008 housing market crash, the U.S. has underinvested in new residential construction
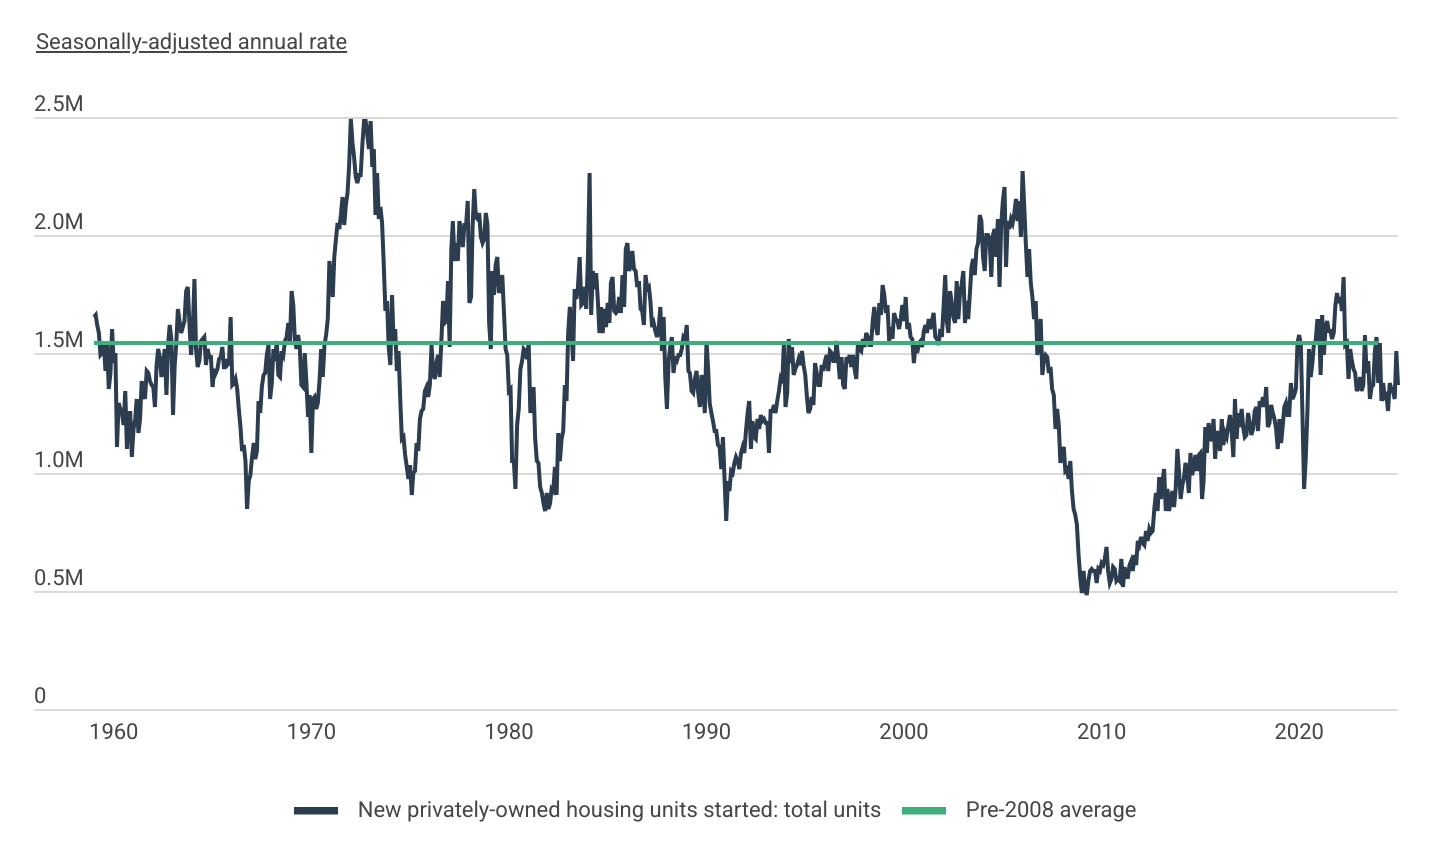
Beyond these conditions, one of the most significant drivers for the current undersupply of housing is the long-term impact of the Great Recession. Following the collapse of the housing bubble in the mid-2000s and the ensuing economic downturn, construction companies were extremely hard-hit. The industry experienced mass layoffs, many firms shuttered or were absorbed into others, and residential construction activity slowed dramatically. The annual rate of housing starts fell from more than 2 million at the height of the housing market in 2006 to just 490,000 at the beginning of 2009. After a prolonged recovery, housing starts did not exceed pre-2008 averages again until the beginning of 2020.
Since then, however, new home construction has decreased back below pre-2008 levels. As of January 2025, the seasonally adjusted annual rate of new housing starts stands at 1.37 million—roughly 25% below the recent peak of 1.83 million observed in April of 2022.
FOR CONSTRUCTION FIRMS
Efficient home construction relies on accurate planning and cost estimation. Construction takeoff software streamlines material measurement, while construction estimating software helps builders manage budgets with precision. Together, these tools improve efficiency and reduce costly overruns in residential projects.
Housing Growth by State
Mountain West states & Texas have added the most housing over the past 10 years
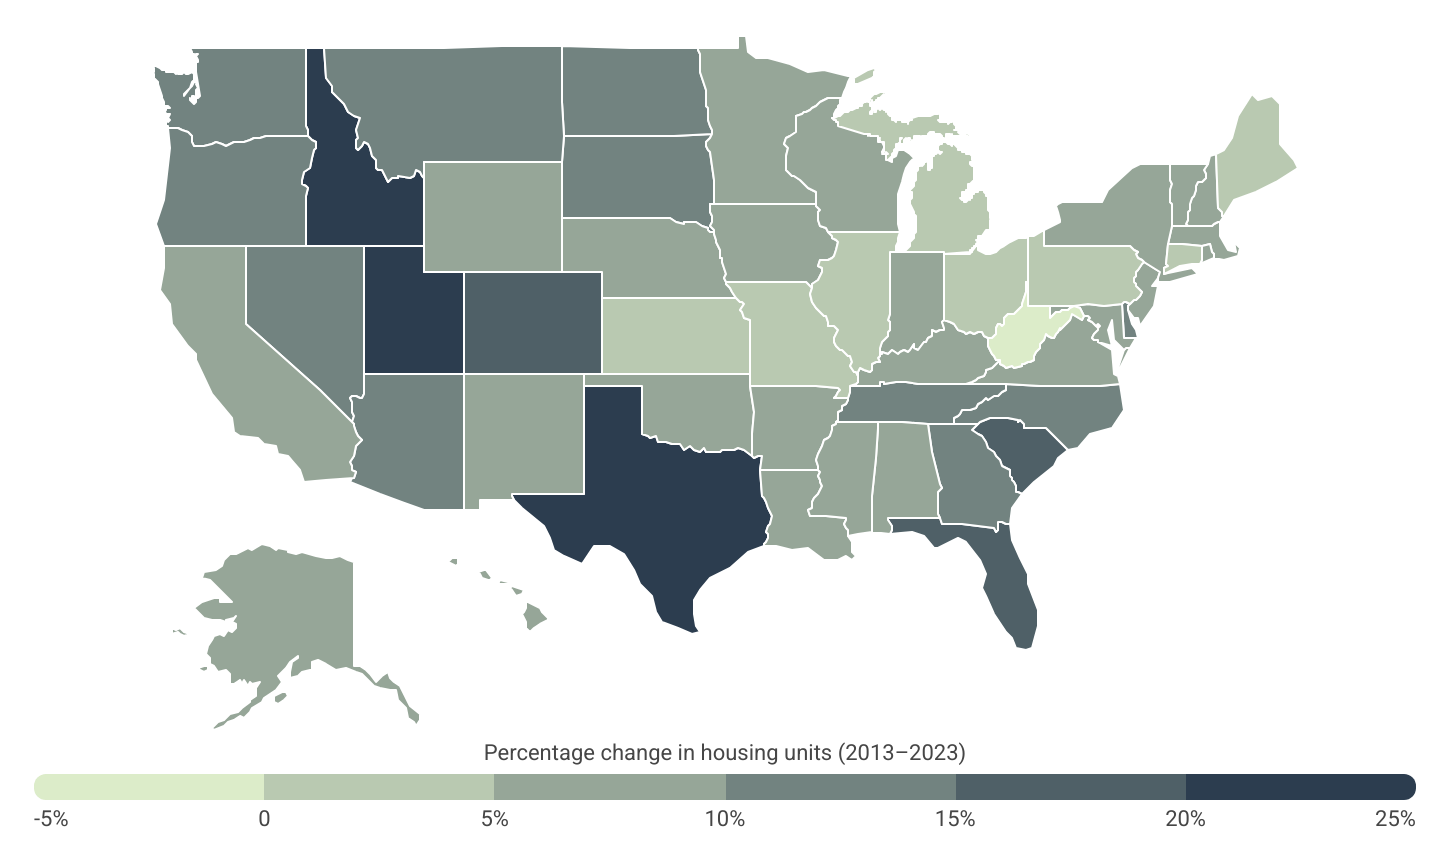
While the national supply of housing has been lagging overall, some parts of the country have managed to add homes faster than others. States that have experienced the most housing growth in recent years are largely found in the Mountain West and Sun Belt regions, which tend to be less expensive than heavily developed coastal markets and have fewer regulations limiting construction.
Utah leads the nation with a 25.1% increase in housing units, followed by Texas at 20.9%. Other western states, such as Idaho (+20.6%) and Colorado (+17.4%), rank third and fourth, respectively. Notably, Sun Belt states like Florida, South Carolina, Nevada, and North Carolina also feature prominently in the top 10, reflecting a broader trend of population growth and housing development in these regions.
In contrast, West Virginia is the only state to experience a net decline in housing stock, decreasing by 1.8%. Meanwhile, Great Lakes states such as Michigan, Illinois, and Ohio have seen relatively slow housing growth, reflecting broader trends of population stagnation or decline in the region.
FOR SPECIALTY CONTRACTORS
If you manage a team of contractors in the field, it’s worth considering field service management software. The best field service software allows users to schedule and dispatch employees, communicate with customers, and accept payments on the go.
Housing Growth vs. Population Growth for U.S. Counties
Relative to population growth, locations in Tennessee, Texas, and Utah have added housing at a faster pace than average
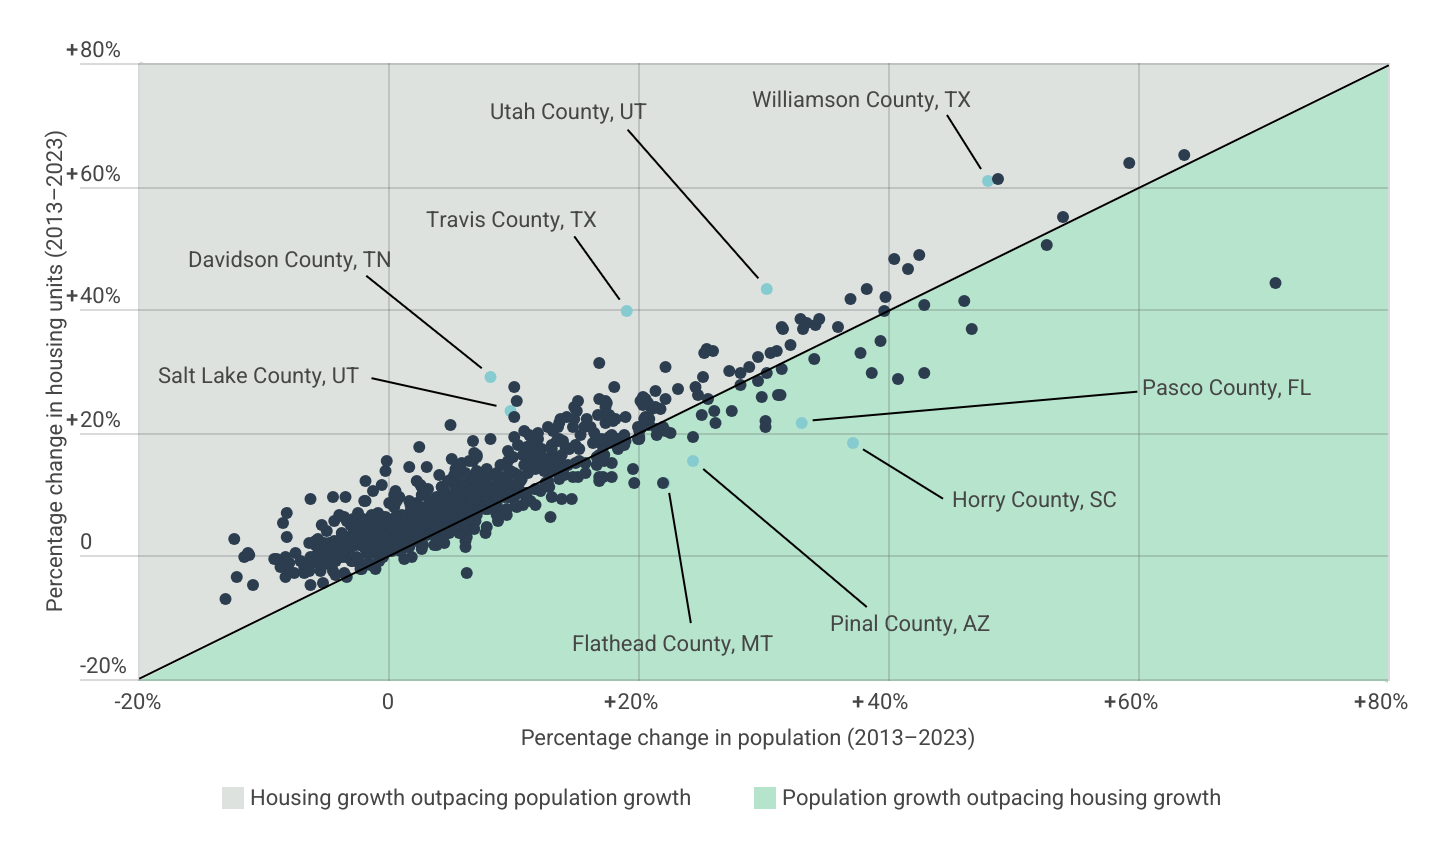
Measuring housing supply growth alone does not fully capture how well a location is meeting current and future housing needs. In some counties, new housing is being built at a faster rate than the population is growing, which helps maintain affordability and prepares these markets to accommodate future residents. This trend is particularly evident in states such as Tennessee, Texas, and Utah, where several counties have added housing stock faster than they have added people.
For example, in Travis County, TX—part of the Austin metropolitan area—housing growth outpaced population growth by more than two-to-one between 2013 and 2023 (+39.7% housing growth vs. +19.1% population growth). The trend is even more pronounced in Davidson County, TN (part of the Nashville metro), where housing growth exceeded population growth by more than three-to-one. Such dynamics suggest that these areas are better positioned to keep housing costs in check while preparing for continued in-migration.
Conversely, in parts of Florida, South Carolina, and Montana, the opposite trend is unfolding. Population growth in these regions has outstripped the pace of new housing construction, increasing competition for available homes. If this imbalance persists, housing affordability challenges may intensify as demand continues to outpace supply.
Below is a complete breakdown of housing growth across nearly 800 U.S. counties (grouped by size) and all 50 states. The analysis was conducted by Construction Coverage, using data from the Census Bureau and Zillow. For more information, see the methodology section below.
U.S. Counties With the Most Housing Growth
| Top Large Counties | Change* |
|---|---|
| 1. Williamson County, TX | +61.0% |
| 2. Montgomery County, TX | +48.8% |
| 3. Fort Bend County, TX | +48.3% |
| 4. Denton County, TX | +43.4% |
| 5. Utah County, UT | +43.2% |
| 6. Collin County, TX | +42.1% |
| 7. Travis County, TX | +39.7% |
| 8. Ada County, ID | +33.2% |
| 9. Wake County, NC | +30.7% |
| 10. Davidson County, TN | +28.9% |
| 11. Polk County, FL | +26.0% |
| 12. Mecklenburg County, NC | +25.1% |
| 13. Denver County, CO | +25.1% |
| 14. Clark County, WA | +24.1% |
| 15. Bexar County, TX | +24.0% |
| Bottom Large Counties | Change* |
|---|---|
| 1. Wayne County, MI | -1.6% |
| 2. Baltimore City, MD | -0.5% |
| 3. Cuyahoga County, OH | -0.4% |
| 4. Montgomery County, OH | -0.1% |
| 5. Shelby County, TN | +1.0% |
| 6. Hamilton County, OH | +1.7% |
| 7. Milwaukee County, WI | +1.7% |
| 8. Summit County, OH | +2.0% |
| 9. St. Louis County, MO | +2.2% |
| 10. Suffolk County, NY | +2.3% |
| 11. Nassau County, NY | +2.9% |
| 12. Jefferson County, AL | +3.1% |
| 13. DuPage County, IL | +3.3% |
| 14. Stanislaus County, CA | +3.6% |
| 15. Allegheny County, PA | +3.6% |
| Top Midsize Counties | Change* |
|---|---|
| 1. Hays County, TX | +63.8% |
| 2. St. Johns County, FL | +50.4% |
| 3. Forsyth County, GA | +39.6% |
| 4. Williamson County, TN | +38.4% |
| 5. Berkeley County, SC | +37.1% |
| 6. Weld County, CO | +36.9% |
| 7. Osceola County, FL | +36.8% |
| 8. Douglas County, CO | +33.6% |
| 9. Benton County, AR | +33.1% |
| 10. Rutherford County, TN | +33.0% |
| 11. Lake County, FL | +32.9% |
| 12. Hamilton County, IN | +32.9% |
| 13. Canyon County, ID | +32.3% |
| 14. Manatee County, FL | +30.7% |
| 15. Cherokee County, GA | +30.0% |
| Bottom Midsize Counties | Change* |
|---|---|
| 1. Genesee County, MI | -3.3% |
| 2. St. Clair County, IL | -1.1% |
| 3. Winnebago County, IL | -0.3% |
| 4. St. Louis City, MO | -0.2% |
| 5. Lucas County, OH | -0.1% |
| 6. Marin County, CA | +0.7% |
| 7. Erie County, PA | +0.9% |
| 8. Westmoreland County, PA | +1.0% |
| 9. Madison County, IL | +1.6% |
| 10. Cumberland County, NC | +1.6% |
| 11. Sonoma County, CA | +1.6% |
| 12. Stark County, OH | +2.2% |
| 13. Santa Cruz County, CA | +2.3% |
| 14. Luzerne County, PA | +2.5% |
| 15. Orleans Parish, LA | +2.6% |
| Top Small Counties | Change* |
|---|---|
| 1. Comal County, TX | +65.2% |
| 2. Dallas County, IA | +61.1% |
| 3. Rockwall County, TX | +54.9% |
| 4. Sumter County, FL | +46.6% |
| 5. Kaufman County, TX | +44.2% |
| 6. Washington County, UT | +41.6% |
| 7. Bastrop County, TX | +41.5% |
| 8. Ellis County, TX | +40.6% |
| 9. Lancaster County, SC | +38.5% |
| 10. Gallatin County, MT | +37.9% |
| 11. Wilson County, TN | +37.4% |
| 12. Johnston County, NC | +37.3% |
| 13. Guadalupe County, TX | +36.9% |
| 14. Canadian County, OK | +34.9% |
| 15. Maury County, TN | +34.2% |
| Bottom Small Counties | Change* |
|---|---|
| 1. Butte County, CA | -2.8% |
| 2. Mahoning County, OH | -2.8% |
| 3. Schuylkill County, PA | -2.1% |
| 4. Kanawha County, WV | -1.7% |
| 5. San Juan County, NM | -1.6% |
| 6. Calhoun County, MI | -1.5% |
| 7. Macon County, IL | -1.3% |
| 8. Cambria County, PA | -0.9% |
| 9. Trumbull County, OH | -0.9% |
| 10. Columbiana County, OH | -0.8% |
| 11. Mercer County, PA | -0.8% |
| 12. Delaware County, IN | -0.8% |
| 13. Monroe County, PA | -0.8% |
| 14. Cochise County, AZ | -0.2% |
| 15. Saginaw County, MI | -0.2% |
| Top Very Small Counties | Change* |
|---|---|
| 1. Walker County, TX | +27.5% |
| 2. Barrow County, GA | +25.9% |
| 3. Chatham County, NC | +25.4% |
| 4. Hancock County, IN | +24.6% |
| 5. Franklin County, WA | +22.5% |
| 6. Lincoln County, NC | +20.8% |
| 7. Twin Falls County, ID | +18.6% |
| 8. Frederick County, VA | +18.3% |
| 9. Bulloch County, GA | +17.3% |
| 10. Polk County, OR | +16.4% |
| 11. Robertson County, TN | +16.4% |
| 12. Madison County, KY | +16.0% |
| 13. Bedford County, VA | +15.9% |
| 14. Christian County, MO | +15.9% |
| 15. San Patricio County, TX | +15.4% |
| Bottom Very Small Counties | Change* |
|---|---|
| 1. Jefferson County, AR | -7.0% |
| 2. Vermilion County, IL | -4.7% |
| 3. Crawford County, PA | -4.6% |
| 4. Muskogee County, OK | -4.5% |
| 5. Lauderdale County, MS | -3.4% |
| 6. Raleigh County, WV | -3.3% |
| 7. Northumberland County, PA | -3.1% |
| 8. Lake County, CA | -2.9% |
| 9. Madison County, NY | -2.7% |
| 10. Harrison County, WV | -2.6% |
| 11. Wilkes County, NC | -2.6% |
| 12. Scioto County, OH | -2.5% |
| 13. Lawrence County, PA | -2.4% |
| 14. Rutherford County, NC | -2.0% |
| 15. Marquette County, MI | -2.0% |
TRENDING INSURANCE GUIDES
- Compare Commercial Auto Insurance
- Best Commercial Property Insurance Companies
- General Liability Insurance for Contractors
States With the Most Housing Growth
| Top States | Change* |
|---|---|
| 1. Utah | +25.1% |
| 2. Texas | +20.9% |
| 3. Idaho | +20.6% |
| 4. Colorado | +17.4% |
| 5. Florida | +15.5% |
| 6. South Carolina | +15.4% |
| 7. Washington | +14.8% |
| 8. Delaware | +14.4% |
| 9. Nevada | +13.6% |
| 10. North Carolina | +13.3% |
| 11. South Dakota | +12.7% |
| 12. Tennessee | +12.5% |
| 13. Georgia | +12.2% |
| 14. Arizona | +12.0% |
| 15. Oregon | +11.6% |
| Bottom States | Change* |
|---|---|
| 1. West Virginia | -1.8% |
| 2. Michigan | +2.6% |
| 3. Illinois | +3.4% |
| 4. Ohio | +3.8% |
| 5. Connecticut | +3.9% |
| 6. Missouri | +4.6% |
| 7. Maine | +4.7% |
| 8. Kansas | +4.9% |
| 9. Pennsylvania | +4.9% |
| 10. Mississippi | +5.2% |
| 11. Kentucky | +5.2% |
| 12. Vermont | +5.4% |
| 13. Wyoming | +5.5% |
| 14. Rhode Island | +5.5% |
| 15. Wisconsin | +5.8% |
*Percentage change in housing units (2013–2023)
Full Results
Methodology
Population and housing unit estimates are from the U.S. Census Bureau’s American Community Survey 1-Year Estimates (2013 and 2023). Median home prices are from Zillow’s Housing Data Series. All changes were calculated between 2013 and 2023. Only locations with data available from the Census Bureau and Zillow were included in the analysis. Additionally, counties were grouped into cohorts based on population: large (500,000 or more); midsize (250,000–499,999), small (100,000–249,999); and very small (less than 100,000).
References
- U.S. Census Bureau and U.S. Department of Housing and Urban Development. (2025, January 27). Median Sales Price of Houses Sold for the United States [MSPUS] [Data set]. Retrieved on April 8, 2025 from https://fred.stlouisfed.org/series/MSPUS.
- U.S. Bureau of Labor Statistics. (2025, March 12). Consumer Price Index for All Urban Consumers: Rent of Primary Residence in U.S. City Average [Data set]. Retrieved on April 8, 2025 from https://fred.stlouisfed.org/series/CUUR0000SEHA.
- FreddieMac. (2024, November 26). Economic, Housing and Mortgage Market Outlook – November 2024 | Spotlight: Housing Supply. Retrieved on April 8, 2025 from https://www.freddiemac.com/research/forecast/20241126-us-economy-remains-resilient-with-strong-q3-growth.
- Rosen Consulting Group. (2021, June). Housing is Critical Infrastructure: Social and Economic Benefits of Building More Housing. Retrieved on April 8, 2025 from https://www.nar.realtor/sites/default/files/documents/Housing-is-Critical-Infrastructure-Social-and-Economic-Benefits-of-Building-More-Housing-6-15-2021.pdf.
- Schuetz, Jenny. The Brookings Institute. (2022, February 22). Dysfunctional policies have broken America’s housing supply chain. Retrieved on April 8, 2025 from https://www.brookings.edu/articles/dysfunctional-policies-have-broken-americas-housing-supply-chain/.
- Lawrence, Peter. Novogradac. (2022, February 23). Rising Construction, Labor Costs Increase Rents, Contributing to the Affordable Housing Crisis. Retrieved on April 8, 2025 from https://www.novoco.com/notes-from-novogradac/rising-construction-labor-costs-increase-rents-contributing-affordable-housing-crisis.
- Strong, Alex. National Association of Home Builders. (2025). How Tariffs Impact the Home Building Industry. Retrieved on April 8, 2025 from https://www.nahb.org/advocacy/top-priorities/addressing-the-supply-chain-crisis/how-tariffs-impact-home-building.
- U.S. Census Bureau. (2024). American Community Survey [Data set]. Retrieved on April 8, 2025 from https://www.census.gov/programs-surveys/acs.
- Zillow. (2025). Housing Data [Data set]. Retrieved on April 8, 2025 from https://www.zillow.com/research/data/.