The Most Popular Construction Jobs in the U.S.
Note: This is the most recent release of our Most Popular Construction Jobs in the U.S. study. To see data from prior years, please visit the Full Results section below.
With red-hot demand for construction nationwide, many builders are struggling to find the professionals they need to keep up. One recent forecast from a national trade association estimated that an additional 501,000 construction professionals will be needed in the industry this year, plus an additional 454,000 in 2025 on top of normal hiring. Many employers are reporting particular difficulty finding enough workers who can fill roles that require more specialized skills or knowledge.
All of this is good news for many experienced construction professionals or those who are considering entering the profession. Workers with the requisite experience or training can command higher wages or other benefits since their skills are in high demand. Those looking to make a career switch can currently find ample opportunity for entry-level jobs in construction that pay better than other roles with similar educational requirements.
U.S. Construction Spending
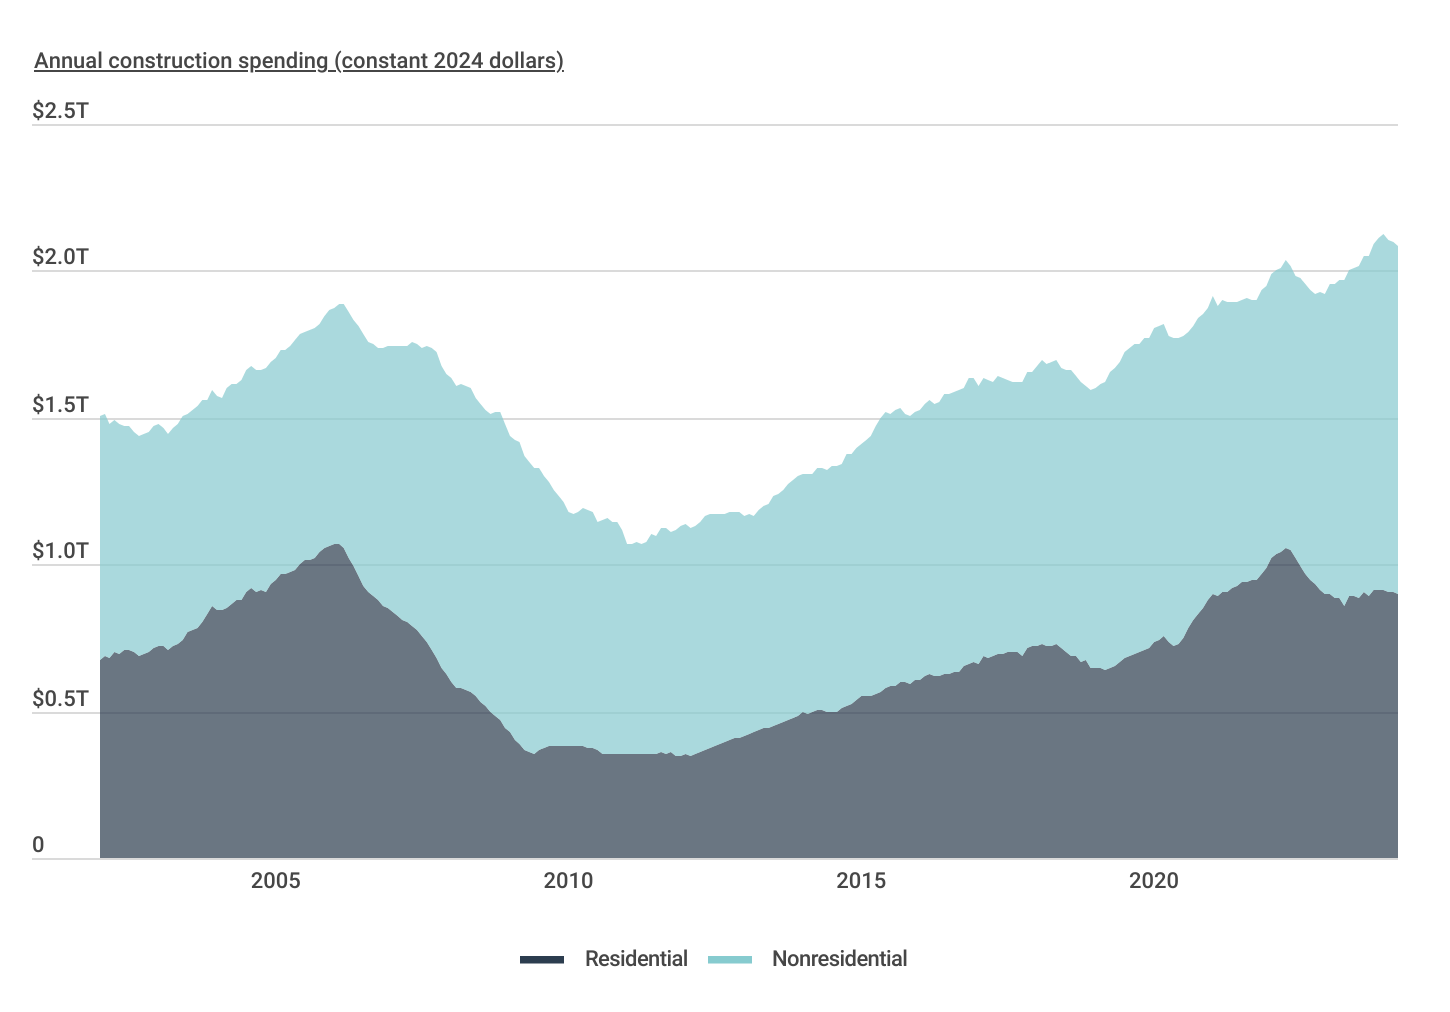
Real construction spending has nearly doubled since its low in 2011

RELATED
Nearly all construction workers require some form of commercial truck insurance for vehicles they use on the job. Truck insurance provides financial and legal protection for work trucks when personal auto insurance doesn’t apply.
Spending on construction gives a sense of how much potential there is in the industry. Following the Great Recession, construction spending plummeted to an annual rate of $758 billion in February 2011 (equivalent to approximately $1.1 trillion in 2024 dollars). However, since then, inflation-adjusted construction spending has surged by over 95%, surpassing the $2 trillion threshold in mid-2023.
Between 2011 and 2018, both residential and nonresidential construction spending experienced steady growth, albeit with minor fluctuations. However, in 2019, both sectors saw a slight downturn before rebounding in 2020. The residential construction sector witnessed a notable surge between 2020 and 2022, fueled by unprecedented demand and historically low interest rates. Yet, as interest rates have risen, demand for housing has moderated, leading to a decline from its peak. Conversely, nonresidential construction initially declined at the onset of the pandemic but has since experienced a strong resurgence. This growth can be largely attributed to bipartisan legislation that has created funding for both public sector infrastructure projects as well as private sector manufacturing and clean energy initiatives.
U.S. Construction Employment Numbers
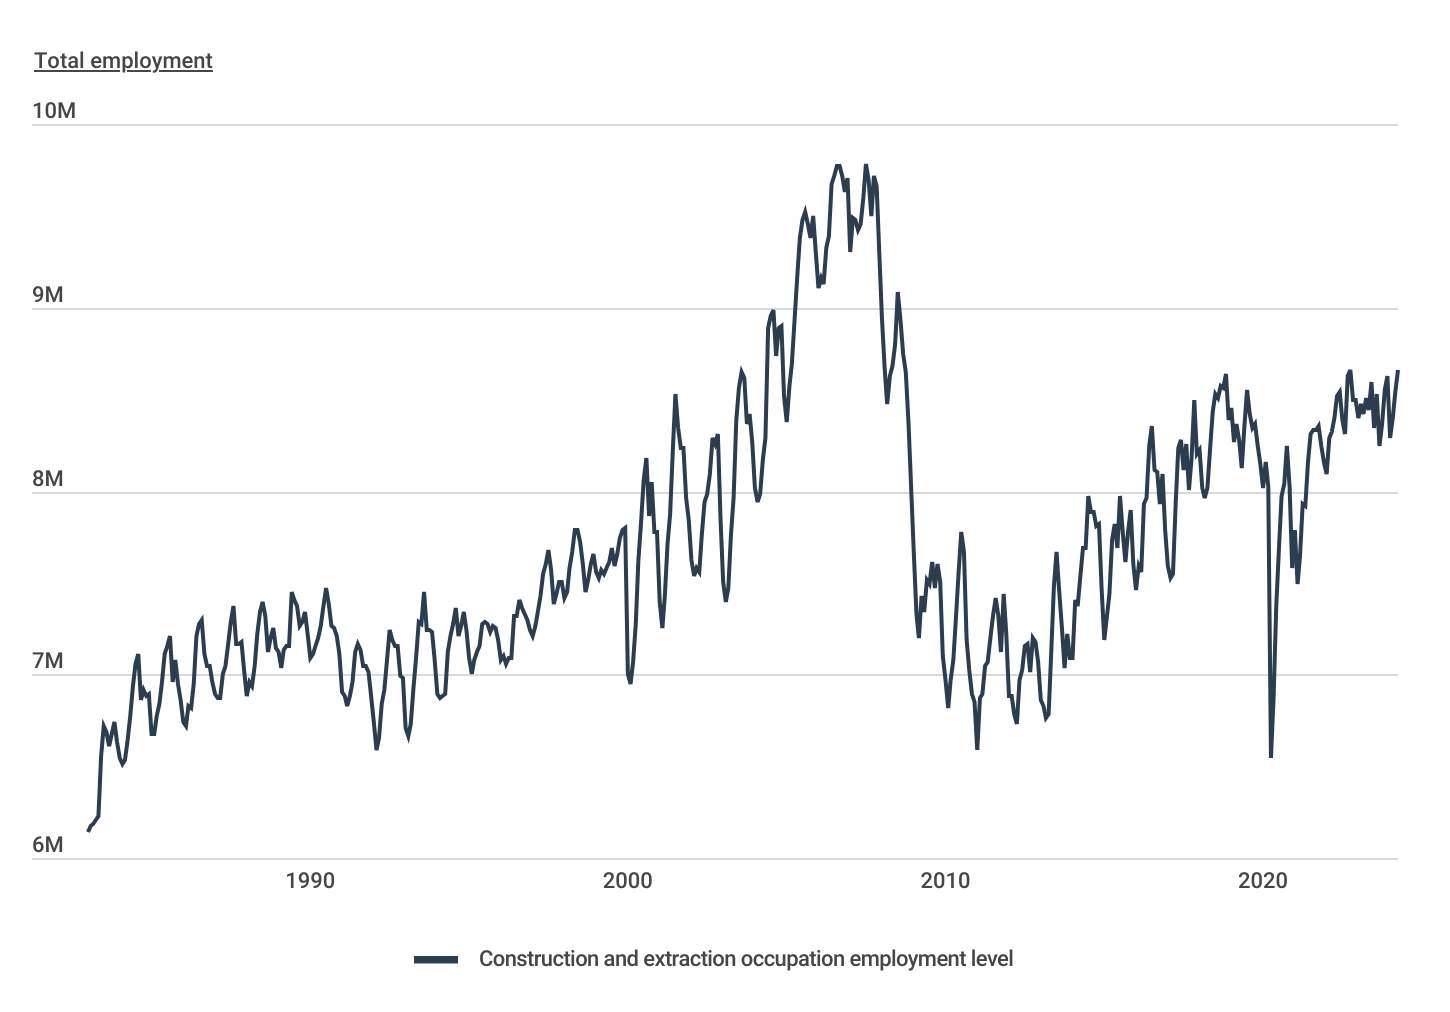
Total construction employment remains below historical levels

Despite record levels of spending, the construction industry has been plagued by lackluster employment figures since the last recession. After peaking at nearly 10 million jobs during the housing bubble, construction employment plummeted to less than 7 million during the Great Recession and had been trending upward for most of the last decade before the COVID-19 pandemic struck. Shutdowns early in the pandemic briefly sent construction employment falling to around 6.5 million in April 2020, but employment in the industry has rebounded to around 8.6 million currently. While the recovery is notable, these employment figures remain around 11% lower than the 2007 peak of 9.8 million, which again underscores the need for more workers in the field.
Given these trends, researchers at Construction Coverage set out to identify the most popular construction jobs and understand which roles in the industry are most common. The researchers analyzed data from the U.S. Bureau of Labor Statistics and ranked 57 total construction occupations based on their share of total construction employment. In addition, researchers included total employment figures, median wages, and statistics by city and state.
Here are the most popular construction jobs in the U.S.
The 15 Most Popular Jobs in Construction

Photo Credit: Bannafarsai Stock / Shutterstock
15. Structural Iron and Steel Workers
- Percentage of total U.S. construction employment: 1.0%
- Total employment: 63,780
- Median annual wage: $62,760
- State with the highest concentration of workers: South Dakota
- Metro with the highest concentration of workers: Vallejo-Fairfield, CA
FOR CONSTRUCTION PROFESSIONALS
No matter what your construction firm specializes in, construction accounting software will help streamline operations, pay contractors faster, and keep detailed profit and loss statistics on individual jobs.

Photo Credit: Virrage Images / Shutterstock
14. Helpers–Electricians
- Percentage of total U.S. construction employment: 1.1%
- Total employment: 68,670
- Median annual wage: $38,340
- State with the highest concentration of workers: North Carolina
- Metro with the highest concentration of workers: Lewiston-Auburn, ME

Photo Credit: Tong Stocker / Shutterstock
13. Drywall and Ceiling Tile Installers
- Percentage of total U.S. construction employment: 1.5%
- Total employment: 90,860
- Median annual wage: $55,700
- State with the highest concentration of workers: California
- Metro with the highest concentration of workers: San Jose-Sunnyvale-Santa Clara, CA

Photo Credit: Byjeng / Shutterstock
12. Sheet Metal Workers
- Percentage of total U.S. construction employment: 1.9%
- Total employment: 116,190
- Median annual wage: $58,780
- State with the highest concentration of workers: Missouri
- Metro with the highest concentration of workers: Warner Robins, GA

Photo Credit: Sorn340 Studio Images / Shutterstock
11. Construction and Building Inspectors
- Percentage of total U.S. construction employment: 2.1%
- Total employment: 133,640
- Median annual wage: $67,700
- State with the highest concentration of workers: New Jersey
- Metro with the highest concentration of workers: Trenton, NJ

Photo Credit: Saravutpics / Shutterstock
10. Roofers
- Percentage of total U.S. construction employment: 2.2%
- Total employment: 135,140
- Median annual wage: $50,030
- State with the highest concentration of workers: Florida
- Metro with the highest concentration of workers: Sebastian-Vero Beach, FL

Photo Credit: Vadim Ratnikov / Shutterstock
9. Highway Maintenance Workers
- Percentage of total U.S. construction employment: 2.4%
- Total employment: 150,860
- Median annual wage: $47,360
- State with the highest concentration of workers: Mississippi
- Metro with the highest concentration of workers: Danville, IL

Photo Credit: Doucefleur / Shutterstock
8. Cement Masons and Concrete Finishers
- Percentage of total U.S. construction employment: 3.3%
- Total employment: 203,560
- Median annual wage: $50,720
- State with the highest concentration of workers: South Dakota
- Metro with the highest concentration of workers: Merced, CA

Photo Credit: Visivastudio / Shutterstock
7. Painters, Construction and Maintenance
- Percentage of total U.S. construction employment: 3.5%
- Total employment: 215,910
- Median annual wage: $47,700
- State with the highest concentration of workers: Hawaii
- Metro with the highest concentration of workers: Bremerton-Silverdale, WA

Photo Credit: Dagmara K / Shutterstock
6. Plumbers, Pipefitters, and Steamfitters
- Percentage of total U.S. construction employment: 7.0%
- Total employment: 436,160
- Median annual wage: $61,550
- State with the highest concentration of workers: Rhode Island
- Metro with the highest concentration of workers: Kokomo, IN

Photo Credit: Virrage Images / Shutterstock
5. Operating Engineers and Other Construction Equipment Operators
- Percentage of total U.S. construction employment: 7.2%
- Total employment: 450,370
- Median annual wage: $56,160
- State with the highest concentration of workers: West Virginia
- Metro with the highest concentration of workers: Parkersburg-Vienna, WV

Photo Credit: Mind And I / Shutterstock
4. Carpenters
- Percentage of total U.S. construction employment: 11.2%
- Total employment: 700,290
- Median annual wage: $56,350
- State with the highest concentration of workers: Vermont
- Metro with the highest concentration of workers: Corvallis, OR

Photo Credit: Varavin88 / Shutterstock
3. Electricians
- Percentage of total U.S. construction employment: 11.4%
- Total employment: 712,580
- Median annual wage: $61,590
- State with the highest concentration of workers: Michigan
- Metro with the highest concentration of workers: Kokomo, IN
RELATED
Construction estimating software is especially helpful for electricians who must calculate detailed cost estimates that factor in a range of complicated formulas and material counts.

Photo Credit: Sirtravelalot / Shutterstock
2. First-Line Supervisors of Construction Trades and Extraction Workers
- Percentage of total U.S. construction employment: 12.5%
- Total employment: 777,420
- Median annual wage: $76,760
- State with the highest concentration of workers: North Carolina
- Metro with the highest concentration of workers: Wilmington, NC

Photo Credit: Halfpoint / Shutterstock
1. Construction Laborers
- Percentage of total U.S. construction employment: 16.4%
- Total employment: 1,019,090
- Median annual wage: $45,300
- State with the highest concentration of workers: Louisiana
- Metro with the highest concentration of workers: Sumter, SC
Detailed Findings & Methodology
The data used in this analysis is from the U.S. Bureau of Labor Statistics 2023 Occupational Employment and Wage Statistics. To determine the most popular construction jobs in the United States, researchers ranked 57 total construction occupations based on their percentage of total national construction and extraction employment. In addition, researchers calculated the most popular construction jobs in each state and metro based on each job’s local employment numbers relative to total construction and extraction employment in each location. Occupations with insufficient employment data were removed.
References
- Associated Builders and Contractors. (2024, January 31). ABC: 2024 Construction Workforce Shortage Tops Half a Million. Retrieved on May 13, 2024 from https://www.abc.org/News-Media/News-Releases/abc-2024-construction-workforce-shortage-tops-half-a-million.
- Jones, Jonathan. Construction Coverage. (2024, February 21). The Best-Paying Construction Jobs in the U.S. Retrieved on May 13, 2024 from https://constructioncoverage.com/research/best-paying-construction-jobs.
- The White House. (2023, November 9). FACT SHEET: Biden-Harris Administration Celebrates Historic Progress in Rebuilding America Ahead of Two-Year Anniversary of Bipartisan Infrastructure Law. Retrieved on May 13, 2024 from https://www.whitehouse.gov/briefing-room/statements-releases/2023/11/09/fact-sheet-biden-harris-administration-celebrates-historic-progress-in-rebuilding-america-ahead-of-two-year-anniversary-of-bipartisan-infrastructure-law/.
- U.S. Bureau of Labor Statistics. (2023). Occupational Employment and Wage Statistics [Data set]. Retrieved on May 13, 2024 from https://www.bls.gov/oes/.
Full Results
Each company featured in our guides has been independently selected and reviewed by our research team. If you select one of these companies and click on a link, we may earn a commission.
By clicking on these links, you may be taken to one of our insurance partners. The specific company listed here may or may not be included in our partner’s network at this time.
