These U.S. Cities Need More Electricians
The U.S. is increasingly moving towards electrification—replacing technologies that use fossil fuels with those that use electricity. Not only are private sector companies like Tesla pushing for the adoption of electric technologies to replace those that use greenhouse gas-emitting energy sources, but the federal government is also taking major steps to finance and expedite the deployment of clean energy technologies through the Inflation Reduction Act. However, the growth of electrification efforts requires expanding the workforce of electricians to install and maintain the new appliances and critical infrastructure, and some industry experts warn that there is currently a shortage of electricians to satisfy demand.

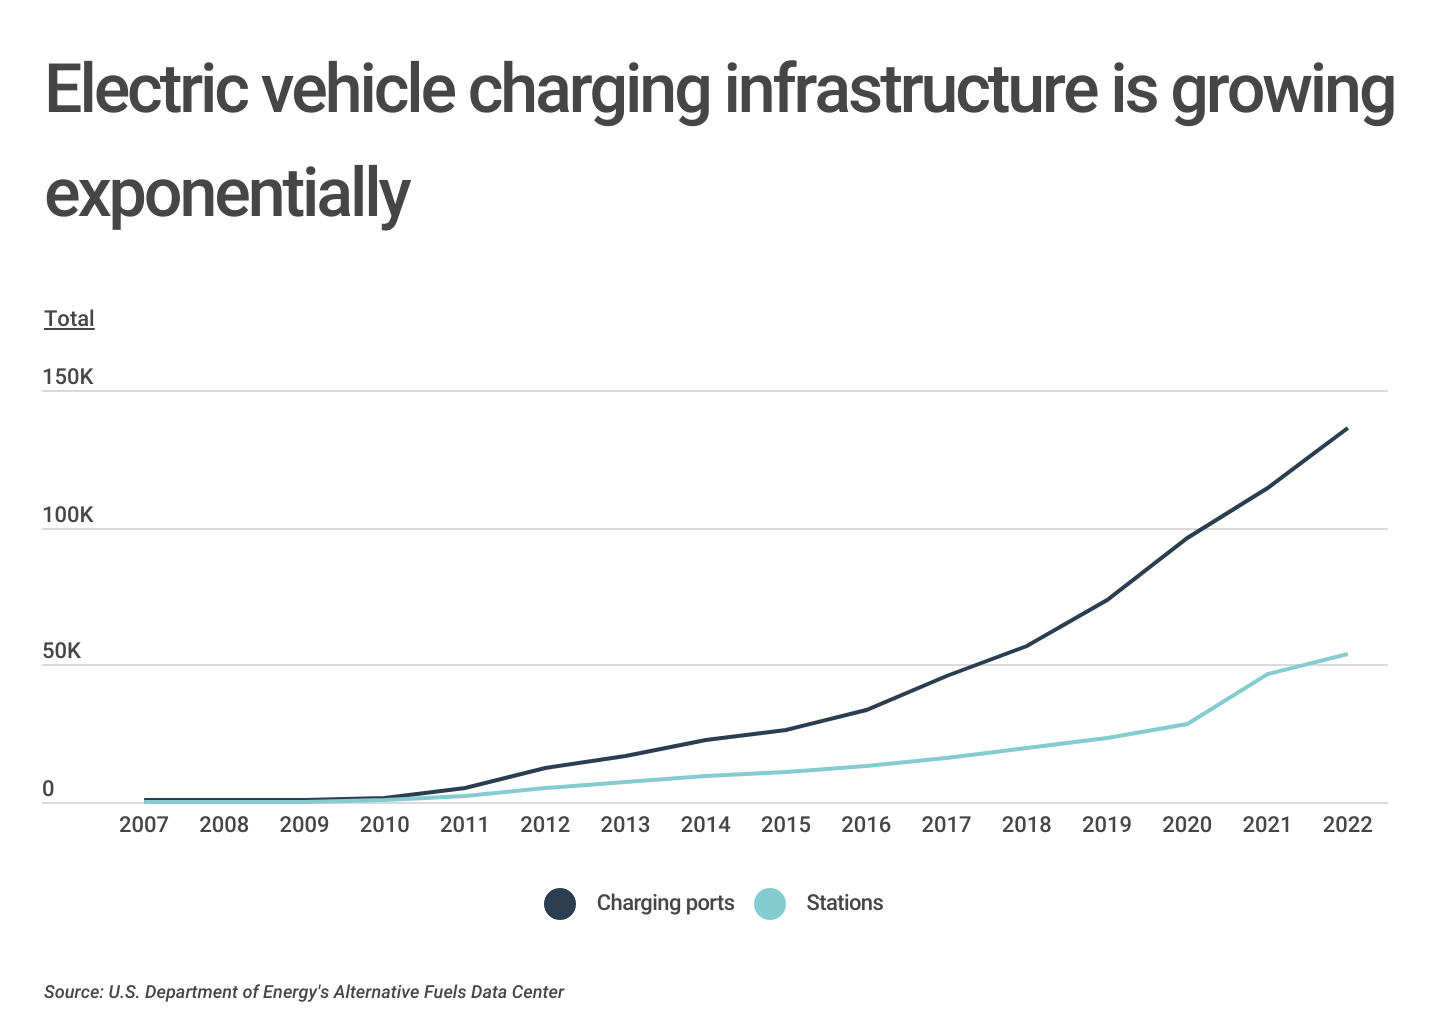
The automotive industry is one of the primary targets of electrification efforts in the U.S. today. Electric vehicles (EVs) are the leading candidates to replace internal combustion engine cars, and the EV market has grown significantly in recent years. In 2011, electric car sales accounted for just 0.2% of total car sales, but by 2021, EV sales made up 4.6% of the total. In order to meet the increased demand, EV charging infrastructure has grown exponentially. In 2007, there were just 417 EV charging ports and 139 stations publicly available to provide electricity to these vehicles. By 2022, EV charging ports topped 136,000, with stations numbering nearly 54,000.
Another example is the energy sector, where investment in solar and wind have experienced similar trends in recent years. Over the 20 year period between 2001 and 2021, renewable energy grew from 7.7% of total electricity generation to more than 20% of total. Looking ahead, the Energy Information Administration (EIA) predicts that renewables will supply 44% of U.S. electricity by 2050.
Because electricians are responsible for installing, maintaining, and repairing the related systems and infrastructure, the expansion of EVs and renewables is increasing the demand for electricians. The Bureau of Labor Statistics projects electrician employment to grow by about 7% from 2021 to 2031, faster than the projected growth for all occupations (5%).
RELATED
Frequently working with active circuits, live wires, and specialized equipment, electricians are regularly exposed to potential liability stemming from their work. For example, if a faulty installation causes a fire, the resulting damage—and costs—can be the electrician’s responsibility. For this reason, general liability insurance for contractors is a popular choice for electricians, as it can protect them from paying for their mistakes out-of-pocket.

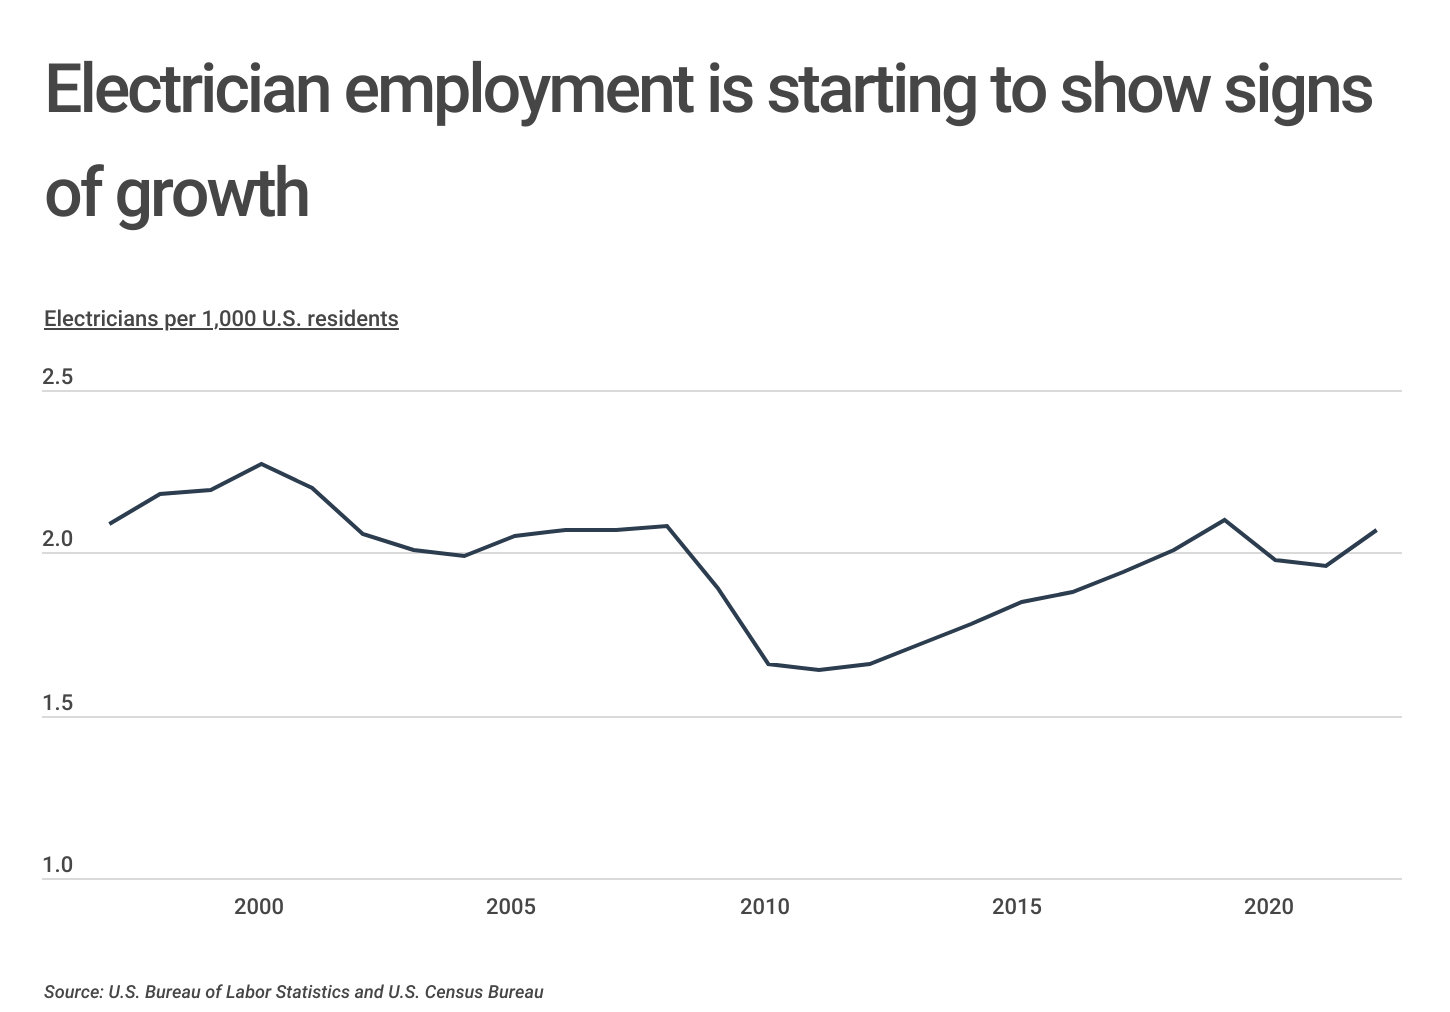
Historically, electrician employment has ebbed and flowed to generally follow the economic cycle. From 1997 to 2008, electrician employment remained relatively flat, and for every 1,000 U.S. residents, there were roughly two electricians gainfully employed. The onset of the housing market crash and subsequent Great Recession caused this ratio to drop to as low as 1.64, and only in recent years has electrician employment recovered. While this growth is promising, increased appetite for electric technologies from a growing population may require a larger ratio of electricians to adequately fulfill the demand.

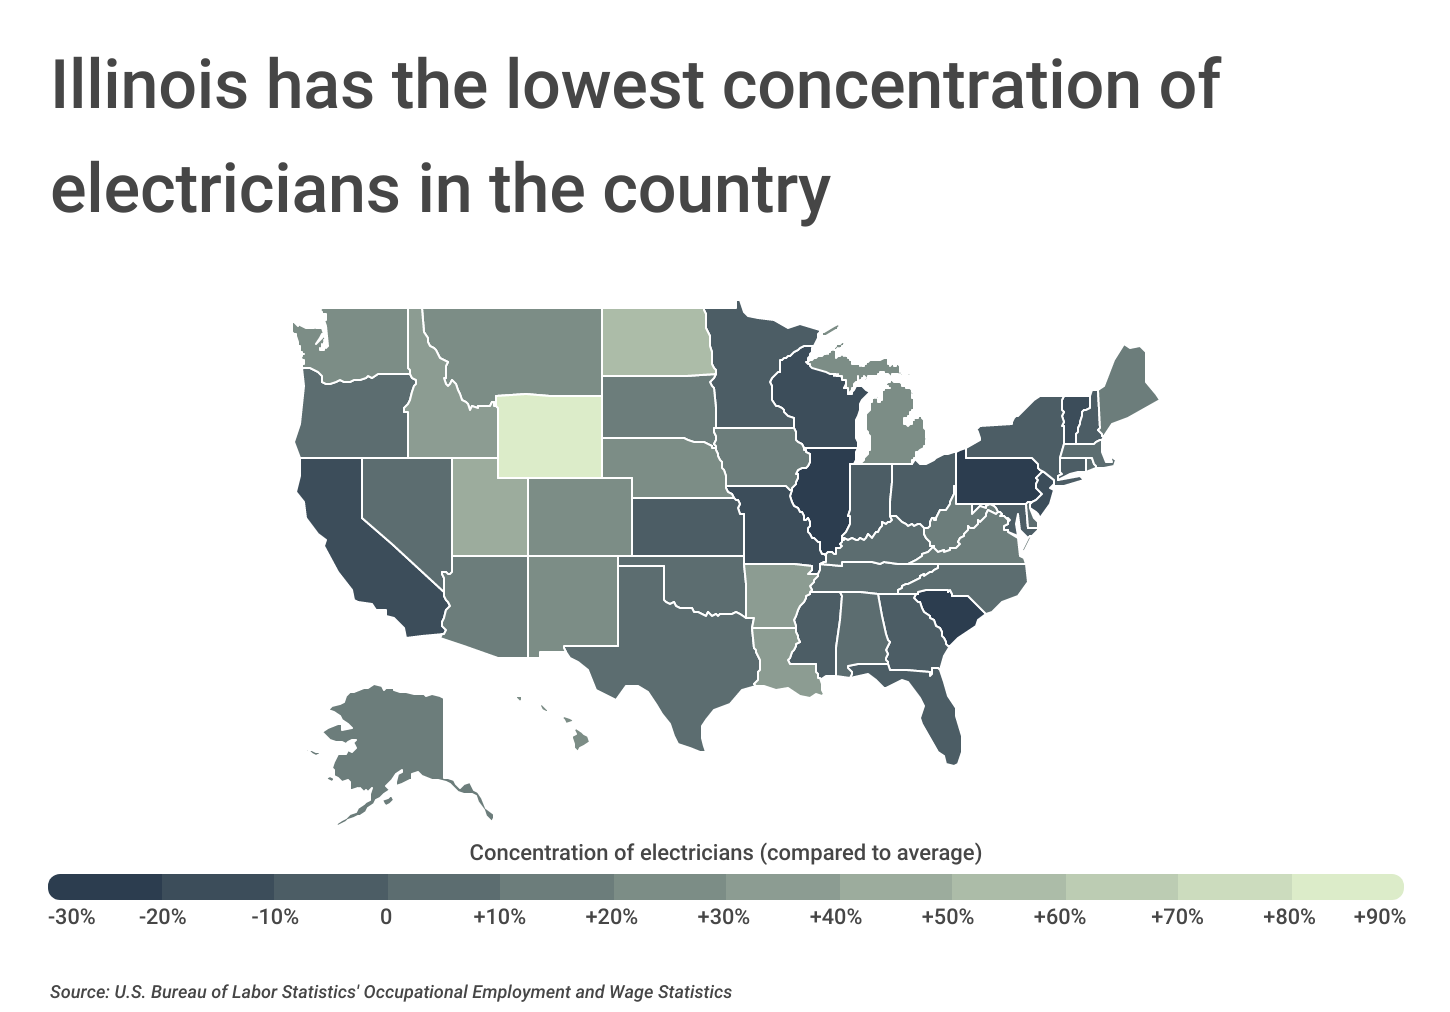
Electrician employment varies across the U.S. due to the supply and demand for electricians, which depends on local industry makeup and the local labor market. At the state level, Wyoming has the greatest relative concentration of electricians in the country, with 88% more electricians than the national average, in part due to its burgeoning wind energy market and it being the second-biggest net energy supplier among the states. In contrast, Pennsylvania, South Carolina, and Illinois have relatively few electricians. The concentration of electricians in Pennsylvania and South Carolina is 22% lower than average, while Illinois’s electrician concentration is 27% lower than the national average.
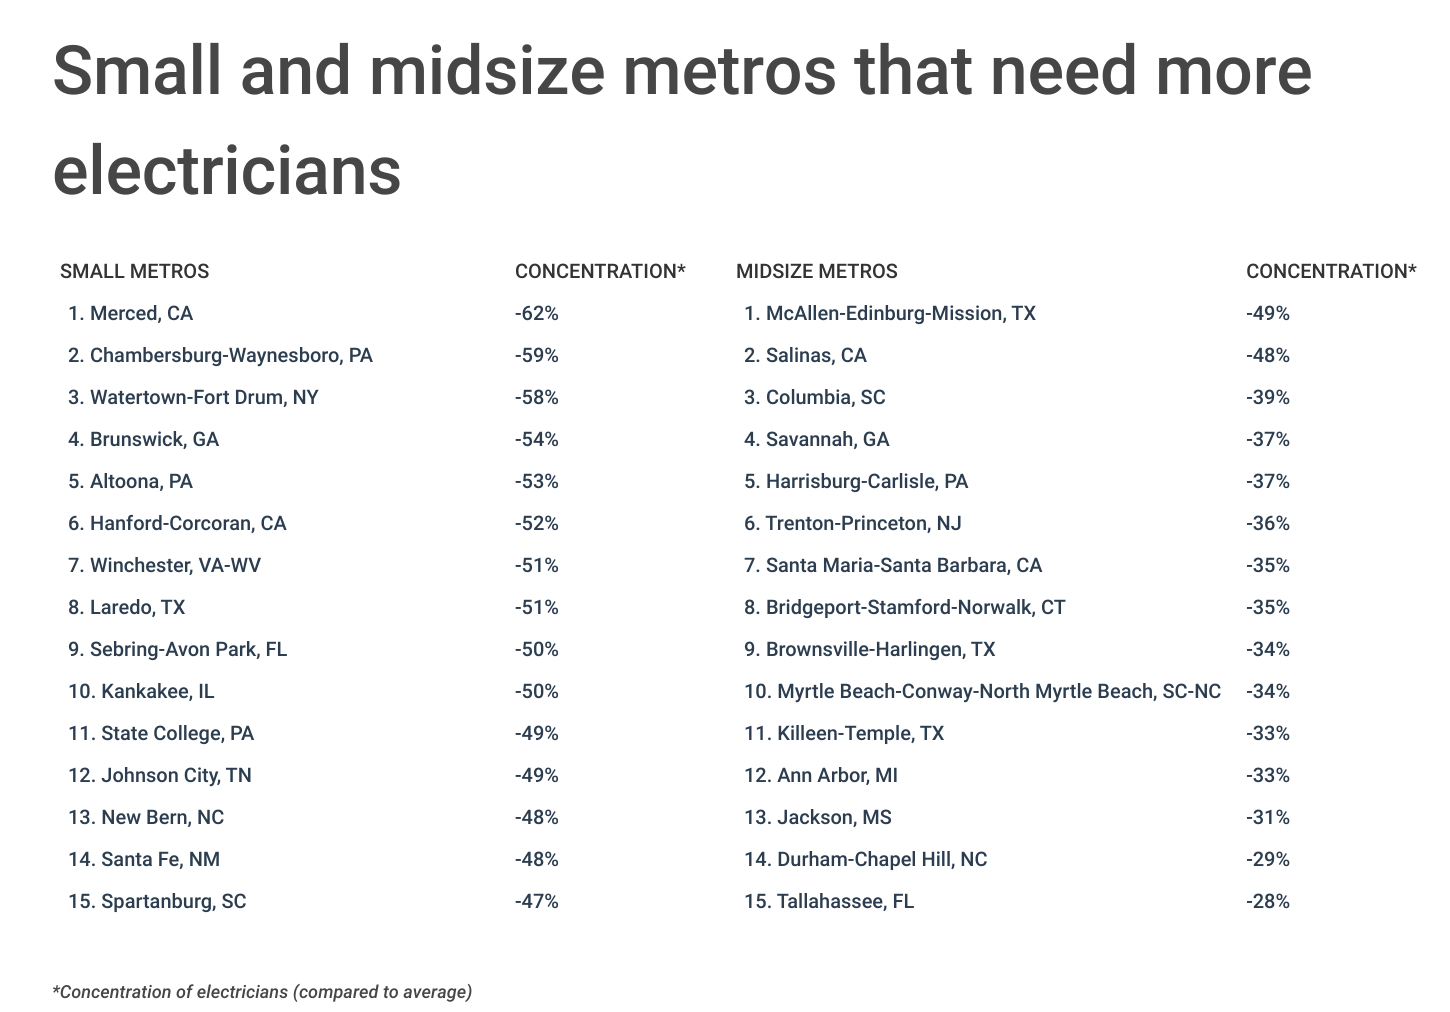
To determine the locations that need more electricians, researchers at Construction Coverage analyzed the latest data from the U.S. Bureau of Labor Statistics and the U.S. Census Bureau. The researchers ranked metropolitan areas according to the local concentration of electricians compared to the national average. Researchers also calculated the total number of electricians, the number of electricians per 1,000 residents, and the number of electricians per 1,000 households.
Here are the U.S. metropolitan areas that need more electricians.

Large Metros That Need More Electricians

Photo Credit: Jacob Boomsma / Shutterstock
15. Fresno, CA
- Concentration of electricians (compared to average): -9%
- Total electricians: 1,690
- Electricians per 1k residents: 1.67
- Electricians per 1k households: 4.95
FOR CONTRACTORS
Many contractors choose to carry tool insurance—which is often purchased as an add-on to general liability insurance—to protect themselves from having to pay out-of-pocket for damaged or stolen tools. Unlike inland marine insurance, tool insurance protects your tools when they are used on and stored at various job sites, and not just when they are moved between them.

Photo Credit: Sean Pavone / Shutterstock
14. New York-Newark-Jersey City, NY-NJ-PA
- Concentration of electricians (compared to average): -10%
- Total electricians: 38,760
- Electricians per 1k residents: 1.96
- Electricians per 1k households: 4.67

Photo Credit: Just dance / Shutterstock
13. Miami-Fort Lauderdale-Pompano Beach, FL
- Concentration of electricians (compared to average): -10%
- Total electricians: 10,980
- Electricians per 1k residents: 1.80
- Electricians per 1k households: 4.12

Photo Credit: Bogdan Vacarciuc / Shutterstock
12. San Francisco-Oakland-Berkeley, CA
- Concentration of electricians (compared to average): -10%
- Total electricians: 9,990
- Electricians per 1k residents: 2.16
- Electricians per 1k households: 5.36

Photo Credit: Stephen Bakin / Shutterstock
11. San Jose-Sunnyvale-Santa Clara, CA
- Concentration of electricians (compared to average): -10%
- Total electricians: 4,700
- Electricians per 1k residents: 2.41
- Electricians per 1k households: 6.58

Photo Credit: f11photo / Shutterstock
10. St. Louis, MO-IL
- Concentration of electricians (compared to average): -11%
- Total electricians: 5,450
- Electricians per 1k residents: 1.94
- Electricians per 1k households: 4.30

Photo Credit: Kenneth Sponsler / Shutterstock
9. Cleveland-Elyria, OH
- Concentration of electricians (compared to average): -14%
- Total electricians: 3,940
- Electricians per 1k residents: 1.90
- Electricians per 1k households: 4.06

Photo Credit: AevanStock / Shutterstock
8. Pittsburgh, PA
- Concentration of electricians (compared to average): -15%
- Total electricians: 4,210
- Electricians per 1k residents: 1.79
- Electricians per 1k households: 3.73

Photo Credit: Dave Riewe / Shutterstock
7. Minneapolis-St. Paul-Bloomington, MN-WI
- Concentration of electricians (compared to average): -16%
- Total electricians: 7,380
- Electricians per 1k residents: 2.00
- Electricians per 1k households: 4.80

Photo Credit: Laura Lee Cobb / Shutterstock
6. Memphis, TN-MS-AR
- Concentration of electricians (compared to average): -16%
- Total electricians: 2,430
- Electricians per 1k residents: 1.82
- Electricians per 1k households: 4.23

Photo Credit: John D Sirlin / Shutterstock
5. Tucson, AZ
- Concentration of electricians (compared to average): -18%
- Total electricians: 1,450
- Electricians per 1k residents: 1.38
- Electricians per 1k households: 3.05

Photo Credit: Paul Brady Photography / Shutterstock
4. Milwaukee-Waukesha, WI
- Concentration of electricians (compared to average): -20%
- Total electricians: 2,990
- Electricians per 1k residents: 1.91
- Electricians per 1k households: 4.30

Photo Credit: Gang Liu / Shutterstock
3. Philadelphia-Camden-Wilmington, PA-NJ-DE-MD
- Concentration of electricians (compared to average): -22%
- Total electricians: 10,070
- Electricians per 1k residents: 1.62
- Electricians per 1k households: 3.87

Photo Credit: Susanne Pommer / Shutterstock
2. Los Angeles-Long Beach-Anaheim, CA
- Concentration of electricians (compared to average): -27%
- Total electricians: 20,870
- Electricians per 1k residents: 1.61
- Electricians per 1k households: 4.39

Photo Credit: marchello74 / Shutterstock
1. Chicago-Naperville-Elgin, IL-IN-WI
- Concentration of electricians (compared to average): -27%
- Total electricians: 14,960
- Electricians per 1k residents: 1.57
- Electricians per 1k households: 3.78
Detailed Findings & Methodology
To determine the locations that need more electricians, researchers at Construction Coverage analyzed employment data from the U.S. Bureau of Labor Statistics’s 2022 Occupational Employment Survey and population and housing unit data from the U.S. Census Bureau’s 2021 American Community Survey and 2021 Housing Unit Estimates. All of these datasets are the latest available. The researchers ranked metropolitan areas according to the local concentration of electricians compared to the national average. In the event of a tie, the metro with the smaller number of total electricians was ranked higher. Researchers also calculated the number of electricians per 1,000 residents and the number of electricians per 1,000 households.
To improve relevance, only metropolitan areas with at least 100,000 people were included in the analysis. Additionally, metro areas were grouped into the following cohorts based on population size:
- Small metros: 100,000-349,999
- Midsize metros: 350,000-999,999
- Large metros: more than 1,000,000
Each company featured in our guides has been independently selected and reviewed by our research team. If you select one of these companies and click on a link, we may earn a commission.
By clicking on these links, you may be taken to one of our insurance partners. The specific company listed here may or may not be included in our partner’s network at this time.
