
Cities With the Most Working-Age Residents Who Have Paid off Their Homes
Note: This is the most recent release of our Cities With the Most Working-Age Residents Who Have Paid Off Their Homes study. To see data from previous years, please visit the Full Results section below.
The rise in mortgage rates beginning in 2022 has placed significant financial pressure on American households, reshaping the housing landscape. While some homeowners locked in historically low rates during the pandemic era, today’s elevated borrowing costs have made it much more challenging for new buyers to enter the market or for existing homeowners to refinance. For those with adjustable-rate mortgages or those nearing the end of fixed-rate periods, the financial strain has intensified as monthly payments rise sharply.
Homeowners who have fully paid off their homes are in a stronger financial position to weather periods of economic uncertainty and elevated rates. According to Census Bureau data, while approximately 63% of homeowners aged 65 and over have fully paid off their homes, less than 28% of working-age homeowners (under 65) have done so. This leaves a substantial portion of the working population vulnerable to financial stress, especially during times of high interest rates and inflationary pressures.
Home Value and Housing Costs for Homeowners by Mortgage Status
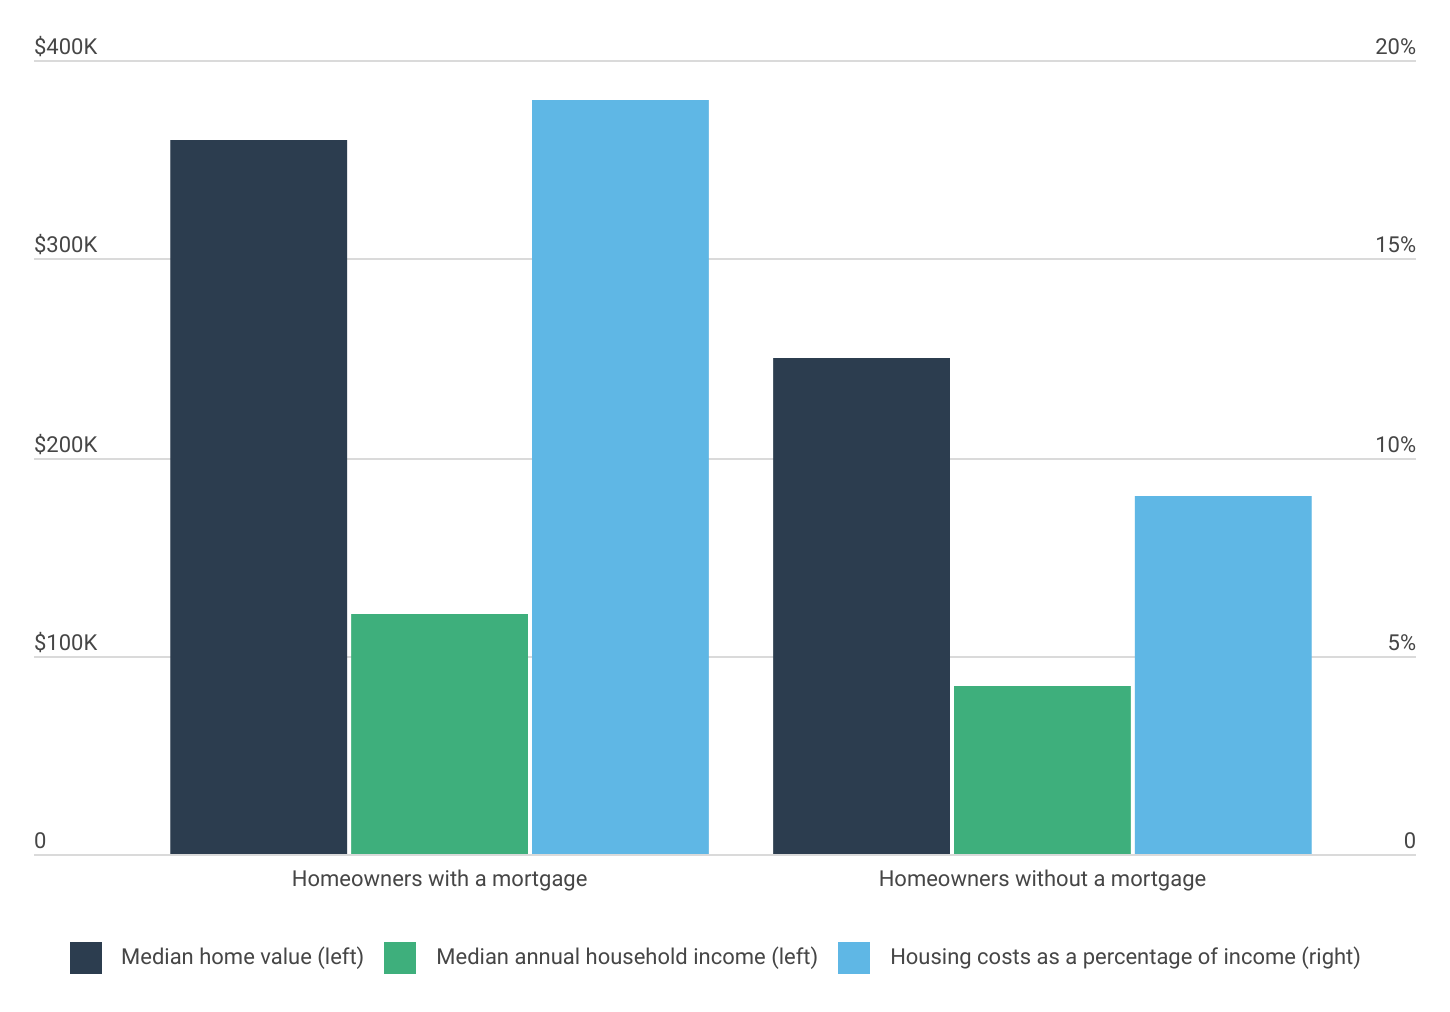
Homeowners with mortgages have higher home values, incomes, and housing costs
Data: Home Value and Housing Costs for Homeowners by Mortgage Status
| Mortgage status | Median home value | Median annual household income | Housing costs as a percentage of income |
|---|---|---|---|
| Homeowners with a mortgage | $360,000 | $121,000 | 19% |
| Homeowners without a mortgage | $250,000 | $85,070 | 9% |
When focusing on working-age homeowners, those with mortgages tend to have higher home values and incomes compared to those who have fully paid off their homes. This challenges the assumption that mortgage-free homeowners are necessarily more affluent or financially successful.
Homeowners with a mortgage report a median home value of $360,000, significantly higher than the $250,000 median value for homes owned outright. Similarly, households with a mortgage have a median annual income of $121,000, compared to just over $85,000 for those without a mortgage. Consequently, median housing costs as a percentage of income—including mortgage payments, insurance, utilities, and other home-related expenses—amount to 19% for homeowners with a mortgage, compared to just 9% for their mortgage-free counterparts.
These figures suggest that mortgage-free homeowners under 65 may prioritize financial stability over owning higher-value properties, may have transitioned to less expensive homes after paying off their debt, or may have inherited their properties. The disparity in home values and incomes also reflects broader housing market dynamics, where higher incomes typically enable buyers to qualify for larger loans, often resulting in the purchase of more expensive homes.
FOR CONSTRUCTION PROFESSIONALS
If you are getting ready to bid on a new construction project, check out our recently updated guides on the best construction estimating software and takeoff software. Both can substantially speed up the bid process, saving time and money.
Percentage of Homes Owned Free & Clear by State
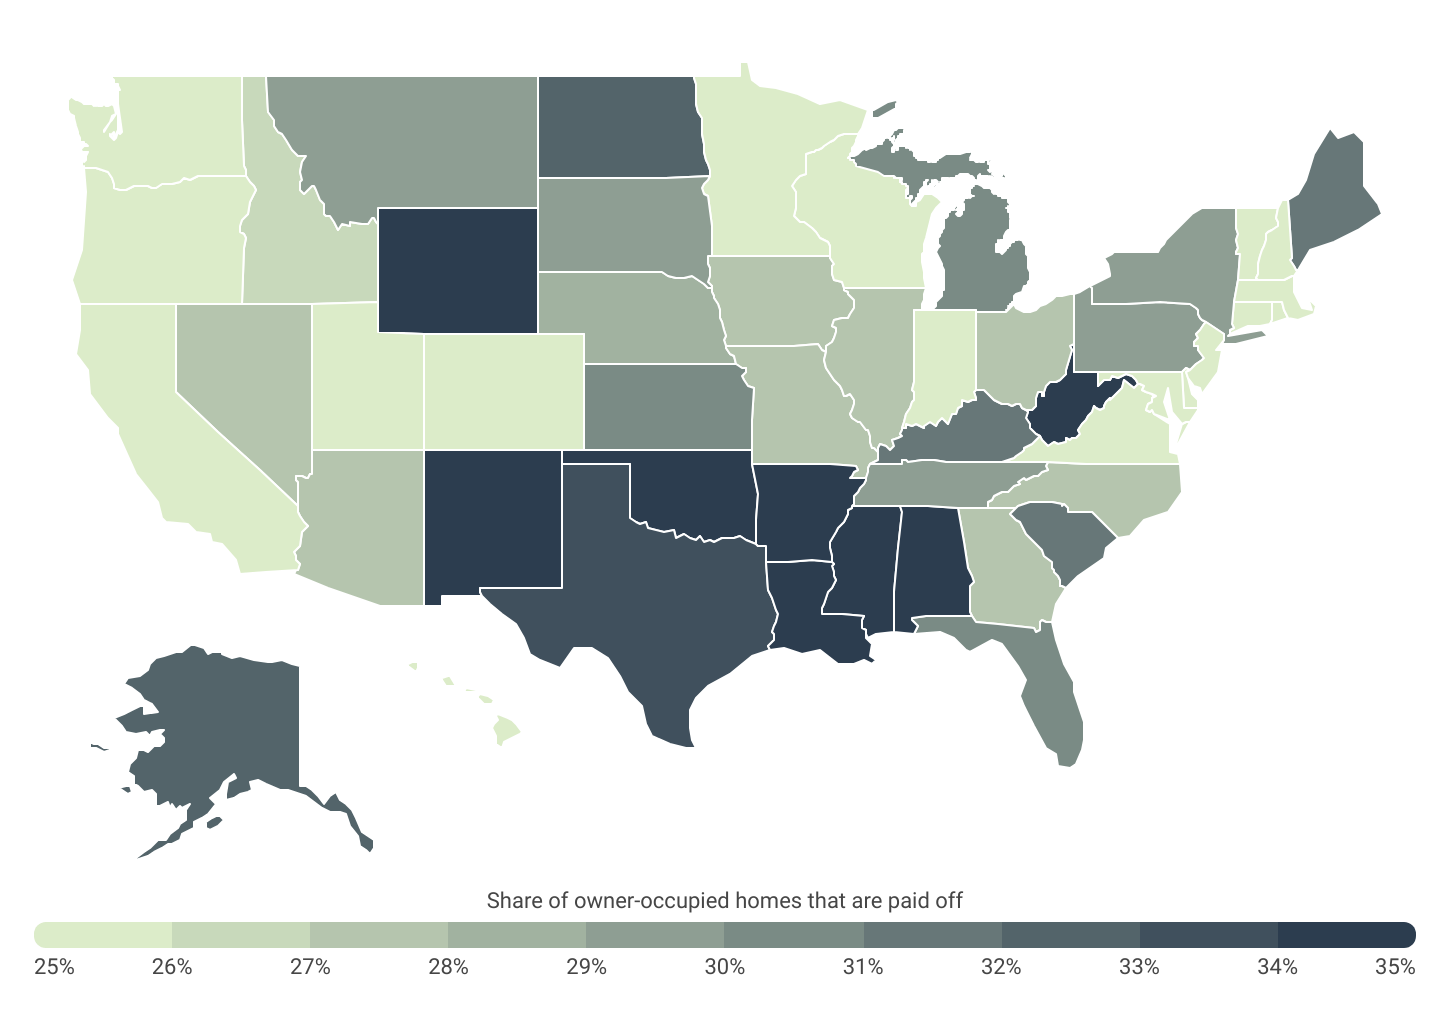
Southern states have the most residents who have paid off their homes
Date: Share of Owner-Occupied Homes That Are Paid Off by U.S. State
| State | Share of owner-occupied homes that are paid off |
|---|---|
| West Virginia | 41.1% |
| Mississippi | 40.8% |
| New Mexico | 36.3% |
| Louisiana | 36.2% |
| Oklahoma | 34.9% |
| Arkansas | 34.6% |
| Wyoming | 34.4% |
| Alabama | 34.0% |
| Texas | 33.7% |
| North Dakota | 32.6% |
| Alaska | 32.3% |
| Maine | 31.1% |
| Kentucky | 31.1% |
| South Carolina | 31.0% |
| Michigan | 30.9% |
| Florida | 30.5% |
| Kansas | 30.2% |
| Montana | 29.7% |
| Tennessee | 29.4% |
| New York | 29.2% |
| Pennsylvania | 29.2% |
| South Dakota | 29.0% |
| Nebraska | 28.1% |
| Missouri | 27.9% |
| Nevada | 27.8% |
| Iowa | 27.7% |
| Arizona | 27.2% |
| North Carolina | 27.2% |
| Ohio | 27.2% |
| Illinois | 27.1% |
| Georgia | 27.0% |
| Idaho | 26.2% |
| Wisconsin | 25.9% |
| Hawaii | 25.9% |
| Vermont | 25.1% |
| Indiana | 25.0% |
| New Hampshire | 24.2% |
| Minnesota | 24.2% |
| Delaware | 24.1% |
| New Jersey | 23.7% |
| Oregon | 23.7% |
| Connecticut | 23.6% |
| Rhode Island | 23.3% |
| California | 22.8% |
| Washington | 22.3% |
| Virginia | 21.4% |
| Utah | 20.6% |
| Massachusetts | 20.6% |
| Colorado | 20.4% |
| Maryland | 18.4% |
Mortgage payoff rates vary substantially across the country. While at the national level, the share of homeowners under age 65 who have paid off their homes is 27.7%, not all areas have equal rates of free-and-clear homeownership. Being mortgage-free is strongly negatively correlated with both household income and home value, so certain states in the South like West Virginia (41.1%), Mississippi (40.8%), and Louisiana (36.2%), all have shares of owner-occupied homes that are paid off above 35%.
At the other end of the spectrum, Maryland has the lowest rate of owner-occupied homes that are paid off at 18.4%. Other states with low rates of free-and-clear homeownership among the working-age population include high-home-price states Colorado (20.4%), Massachusetts (20.6%), and Utah (20.6%).
At the metropolitan level, nine out of the top 15 large metros for free-and-clear homeownership are found in the South—led by Greenville, SC at 32.1%. Conversely, more expensive coastal cities and desirable locations in the Mountain West—such as Washington, DC (16.0%) and Denver, CO (18.4%)—have the lowest share of owner-occupied homes that are paid off.
Below is a complete breakdown of working-age residents who have paid off their homes across more than 250 metropolitan areas and all 50 states. The analysis was conducted by researchers at Construction Coverage, using data from the U.S. Census Bureau. For more information, refer to the methodology section.
Cities With the Most Residents Who Have Paid off Their Homes
| Top Large Metros | Share* |
|---|---|
| 1. Greenville-Anderson-Greer, SC | 32.1% |
| 2. Tulsa, OK | 31.9% |
| 3. Houston-Pasadena-The Woodlands, TX | 31.7% |
| 4. Detroit-Warren-Dearborn, MI | 31.4% |
| 5. Buffalo-Cheektowaga, NY | 31.1% |
| 6. Miami-Fort Lauderdale-West Palm Beach, FL | 30.8% |
| 7. Birmingham, AL | 29.8% |
| 8. Pittsburgh, PA | 29.8% |
| 9. Tampa-St. Petersburg-Clearwater, FL | 29.7% |
| 10. Oklahoma City, OK | 28.8% |
| 11. San Antonio-New Braunfels, TX | 28.6% |
| 12. Dallas-Fort Worth-Arlington, TX | 27.9% |
| 13. Tucson, AZ | 27.7% |
| 14. Cleveland, OH | 27.6% |
| 15. Fresno, CA | 27.1% |
| Bottom Large Metros | Share* |
|---|---|
| 1. Washington-Arlington-Alexandria, DC-VA-MD-WV | 16.0% |
| 2. Virginia Beach-Chesapeake-Norfolk, VA-NC | 17.1% |
| 3. Denver-Aurora-Centennial, CO | 18.4% |
| 4. Raleigh-Cary, NC | 18.9% |
| 5. Baltimore-Columbia-Towson, MD | 19.1% |
| 6. Salt Lake City-Murray, UT | 19.8% |
| 7. Portland-Vancouver-Hillsboro, OR-WA | 19.8% |
| 8. Columbus, OH | 19.9% |
| 9. Seattle-Tacoma-Bellevue, WA | 19.9% |
| 10. Boston-Cambridge-Newton, MA-NH | 20.1% |
| 11. Sacramento-Roseville-Folsom, CA | 20.5% |
| 12. San Francisco-Oakland-Fremont, CA | 20.8% |
| 13. Minneapolis-St. Paul-Bloomington, MN-WI | 20.8% |
| 14. Richmond, VA | 21.0% |
| 15. San Diego-Chula Vista-Carlsbad, CA | 21.3% |
TRENDING ON CONSTRUCTION COVERAGE
As a small business owner, it can be difficult finding a reliable insurance carrier to work with. That’s why we’ve put together lists of the best commercial auto insurance companies, workers’ compensation insurance companies, and commercial truck insurance companies. For each guide, we review what to look for when comparing companies, as well as our top recommendations for small businesses.
| Top Midsize Metros | Share* |
|---|---|
| 1. McAllen-Edinburg-Mission, TX | 54.2% |
| 2. Brownsville-Harlingen, TX | 53.6% |
| 3. Beaumont-Port Arthur, TX | 44.5% |
| 4. Ocala, FL | 40.9% |
| 5. El Paso, TX | 38.9% |
| 6. Corpus Christi, TX | 37.6% |
| 7. Youngstown-Warren, OH | 37.1% |
| 8. Lafayette, LA | 34.9% |
| 9. Montgomery, AL | 34.9% |
| 10. Scranton–Wilkes-Barre, PA | 33.7% |
| 11. Mobile, AL | 33.7% |
| 12. New Orleans-Metairie, LA | 33.5% |
| 13. Lakeland-Winter Haven, FL | 33.4% |
| 14. Palm Bay-Melbourne-Titusville, FL | 33.0% |
| 15. Crestview-Fort Walton Beach-Destin, FL | 32.6% |
| Bottom Midsize Metros | Share* |
|---|---|
| 1. Vallejo, CA | 15.1% |
| 2. Provo-Orem-Lehi, UT | 18.0% |
| 3. Greeley, CO | 18.1% |
| 4. Worcester, MA | 18.6% |
| 5. Santa Rosa-Petaluma, CA | 18.7% |
| 6. Ogden, UT | 19.4% |
| 7. Fort Collins-Loveland, CO | 19.5% |
| 8. Colorado Springs, CO | 20.0% |
| 9. Waterbury-Shelton, CT | 21.1% |
| 10. Visalia, CA | 21.4% |
| 11. Eugene-Springfield, OR | 22.3% |
| 12. Spokane-Spokane Valley, WA | 22.3% |
| 13. Springfield, MA | 22.5% |
| 14. Boise City, ID | 22.7% |
| 15. York-Hanover, PA | 23.0% |
| Top Small Metros | Share* |
|---|---|
| 1. Odessa, TX | 43.9% |
| 2. Beckley, WV | 43.7% |
| 3. Wildwood-The Villages, FL | 43.6% |
| 4. Hattiesburg, MS | 42.7% |
| 5. Rocky Mount, NC | 42.6% |
| 6. Wichita Falls, TX | 42.4% |
| 7. Goldsboro, NC | 41.6% |
| 8. Ithaca, NY | 40.8% |
| 9. Santa Fe, NM | 40.2% |
| 10. Bangor, ME | 39.4% |
| 11. Laredo, TX | 39.2% |
| 12. Saginaw, MI | 37.7% |
| 13. Johnson City, TN | 37.6% |
| 14. Johnstown, PA | 37.5% |
| 15. San Angelo, TX | 37.5% |
| Bottom Small Metros | Share* |
|---|---|
| 1. Lexington Park, MD | 15.3% |
| 2. San Luis Obispo-Paso Robles, CA | 17.7% |
| 3. Pueblo, CO | 18.4% |
| 4. Albany, OR | 18.4% |
| 5. Bremerton-Silverdale-Port Orchard, WA | 18.4% |
| 6. Kenosha, WI | 19.0% |
| 7. Lewiston-Auburn, ME | 19.0% |
| 8. Bellingham, WA | 19.5% |
| 9. Lawrence, KS | 21.4% |
| 10. Slidell-Mandeville-Covington, LA | 21.5% |
| 11. Bloomington, IN | 21.6% |
| 12. Jonesboro, AR | 21.6% |
| 13. Hanford-Corcoran, CA | 21.7% |
| 14. Clarksville, TN-KY | 21.9% |
| 15. Santa Cruz-Watsonville, CA | 22.2% |
States With the Most Residents Who Have Paid off Their Homes
| Top States | Share* |
|---|---|
| 1. West Virginia | 41.1% |
| 2. Mississippi | 40.8% |
| 3. New Mexico | 36.3% |
| 4. Louisiana | 36.2% |
| 5. Oklahoma | 34.9% |
| 6. Arkansas | 34.6% |
| 7. Wyoming | 34.4% |
| 8. Alabama | 34.0% |
| 9. Texas | 33.7% |
| 10. North Dakota | 32.6% |
| 11. Alaska | 32.3% |
| 12. Maine | 31.1% |
| 13. Kentucky | 31.1% |
| 14. South Carolina | 31.0% |
| 15. Michigan | 30.9% |
| Bottom States | Share* |
|---|---|
| 1. Maryland | 18.4% |
| 2. Colorado | 20.4% |
| 3. Massachusetts | 20.6% |
| 4. Utah | 20.6% |
| 5. Virginia | 21.4% |
| 6. Washington | 22.3% |
| 7. California | 22.8% |
| 8. Rhode Island | 23.3% |
| 9. Connecticut | 23.6% |
| 10. Oregon | 23.7% |
| 11. New Jersey | 23.7% |
| 12. Delaware | 24.1% |
| 13. Minnesota | 24.2% |
| 14. New Hampshire | 24.2% |
| 15. Indiana | 25.0% |
*Share of owner-occupied homes that are paid off
Methodology
The data used in this study is from the U.S. Census Bureau’s American Community Survey 2023 1-Year Estimates. To determine the locations with the most residents who have paid off their homes, researchers at Construction Coverage ranked locations by the share of owner-occupied households without a mortgage (owned “free and clear”). For relevance, only owner-occupied households with positive income and a working-age primary householder (under the age of 65) were considered.
To improve relevance only metropolitan areas with complete data were included. Additionally, metros were grouped into cohorts based on population: small (under 350,000), midsize (350,000–999,999), and large (1,000,000 or more).
References
- U.S. Census Bureau. (2023). American Community Survey 1-Year Estimates [Data set]. Retrieved on December 30, 2024 from https://www.census.gov/programs-surveys/acs.